. 2025 May 13;16(1):744.
doi: 10.1007/s12672-025-02484-5.

Development of a machine learning-based predictive risk model combining fatty acid metabolism and ferroptosis for immunotherapy response and prognosis in prostate cancer

Affiliations

Development of a machine learning-based predictive risk model combining fatty acid metabolism and ferroptosis for immunotherapy response and prognosis in prostate cancer

Zhenwei Wang et al. Discov Oncol. .

Abstract

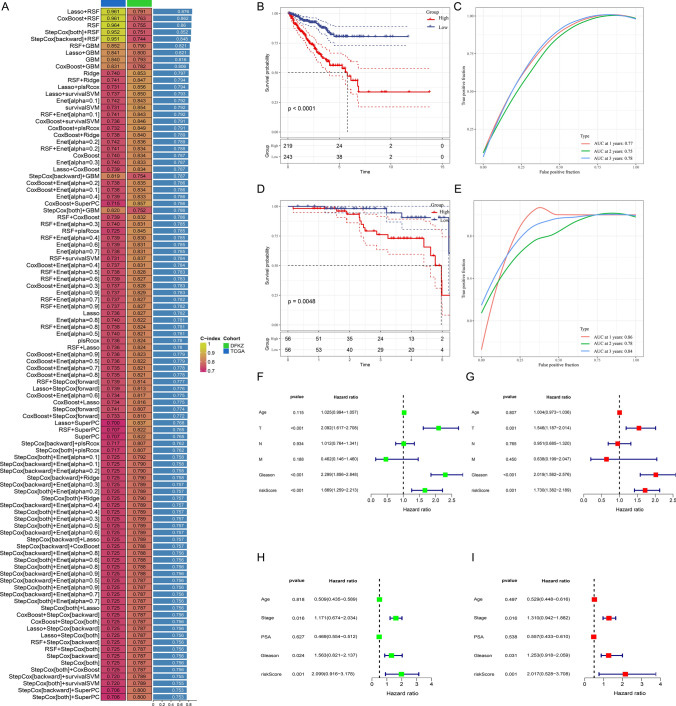
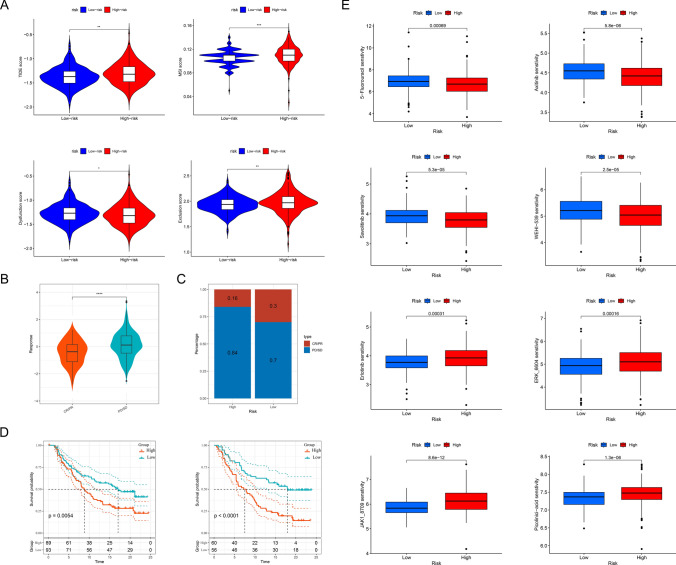
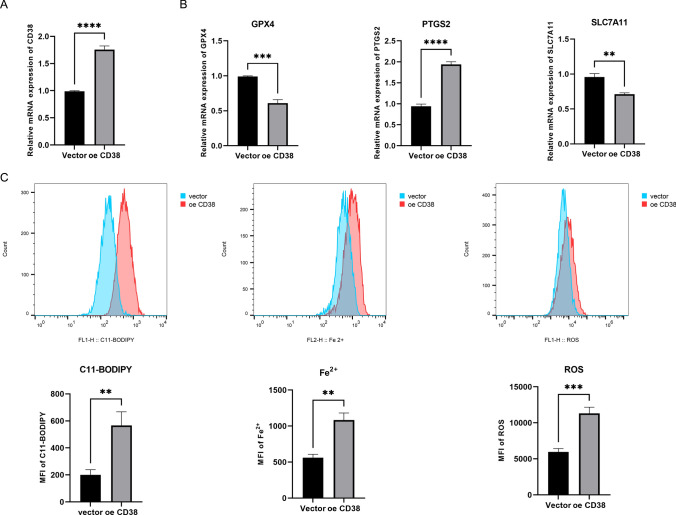
Prostate cancer (PCa) remains a leading cause of cancer-related mortality, necessitating robust prognostic models and personalized therapeutic strategies. This study integrated bulk RNA sequencing, single-cell RNA sequencing (scRNA-seq), and spatial transcriptomics to construct a prognostic model based on genes shared between ferroptosis and fatty acid metabolism (FAM). Using the TCGA-PRAD dataset, we identified 73 differentially expressed genes (DEGs) at the intersection of ferroptosis and FAM, of which 19 were significantly associated with progression-free survival (PFS). A machine learning-based prognostic model, optimized using the Lasso + Random Survival Forest (RSF) algorithm, achieved a high C-index of 0.876 and demonstrated strong predictive accuracy (1-, 2-, and 3-year AUCs: 0.77, 0.75, and 0.78, respectively). The model, validated in the DFKZ cohort, stratified patients into high- and low-risk groups, with the high-risk group exhibiting worse PFS and higher tumor mutation burden (TMB). Functional enrichment analysis revealed distinct pathway activities, with high-risk patients showing enrichment in immune-related and proliferative pathways, while low-risk patients were enriched in metabolic pathways. Immune microenvironment analysis revealed heightened immune activity in high-risk patients, characterized by increased infiltration of CD8 + T cells, regulatory T cells, and M2 macrophages, alongside elevated TIDE scores, suggesting immune evasion and resistance to immunotherapy. In contrast, low-risk patients exhibited higher infiltration of plasma cells and neutrophils and demonstrated better responses to immune checkpoint inhibitors (ICIs). Spatial transcriptomics and scRNA-seq further elucidated the spatial distribution of model genes, highlighting the central role of macrophages in mediating risk stratification. Additionally, chemotherapy sensitivity analysis identified potential therapeutic agents, such as Erlotinib and Picolinic acid, for low-risk patients. In vitro experiments showed that overexpression of CD38 in the PC-3 cell line led to elevated lipid peroxidation (C11-BODIPY) and reactive oxygen species (ROS), suggesting increased cell ferroptosis. These findings provide a comprehensive framework for risk stratification and personalized treatment in PCa, bridging molecular mechanisms with clinical outcomes.

Keywords: Fatty acid metabolism; Ferroptosis; Machine learning; Multi-omics; Prostate cancer; Tumor microenvironment.


Conflict of interest statement

Declarations. Ethics approval and consent to participate: Not available, for the study used only public database samples and did not involve collecting human or animal specimens for experiments. Competing interests: The authors declare no competing interests.

Figures

Fig. 1
Fig. 1
Identification of prognostic common genes between the DEGs, FAMRGs, and FRGs. A Venn diagram displayed the common genes of DEGs, FAMRGs, and FRGs. B Identification of prognostic genes derived from the common genes via univariate Cox analysis. C Construction of a PPI network from the STRING database. D Correlation network of the generated prognostic genes. The bluer the color, the stronger the negative correlation, and the redder the color, the stronger the positive correlation
Fig. 2
Fig. 2
Construction and validation of a prognostic model via machine learning methods. A Mean values of C-index values calculated by machine learning methods in the TCGA and DFKZ cohorts. B, D PFS survival curves of the high- and low-risk group in the TCGA and DFKZ cohorts, respectively. C, E ROC curves at 1-, 2-, and 3-years of TCGA and DFKZ cohorts, respectively. F, G Univariate and multivariate Cox regression analysis of Age, TNM stage, Gleason score, and risk score in the TCGA cohort. H, I Univariate and multivariate Cox regression analysis of Age, stage, Gleason score, PSA, and risk score in the DFKZ cohort
Fig. 3
Fig. 3
Building and evaluating a nomogram integrated clinical factors and risk score. A Comparison of risk scores across different clinical characteristics. B, C The predicted ability of the nomogram was estimated by calibration curves (B) and decision curves (C). D Based on clinical factors such as age, TNM stage, Gleason score, and risk score, a nomogram score table was constructed to predict the 1-, 2- and 3-year PFS of prostate cancer patients
Fig. 4
Fig. 4
Potential mechanisms were analyzed by functional enrichment. A GO enrichment analysis. B KEGG enrichment analysis. C, D Hallmark enrichment analysis in the high- and low-risk groups
Fig. 5
Fig. 5
Differences in tumor mutation burden between high- and low-risk groups. A The difference in TMB score among the two groups. B The CNV frequency of model genes. C The top 10 pathways most significantly affected by mutations in the low- (left) and high-risk (right) groups. D The top 15 most frequent genes in the low- (left) and high-risk (right) groups. ****p < 0.0001. E The top 15 genes with the highest mutation frequencies in the high-risk and low-risk groups
Fig. 6
Fig. 6
Estimation of immune cell infiltration among the two groups. A Differences of Estimate, immune, and stromal scores calculated by ESTIMATE method. B Differences in different immune cell populations between the two groups were evaluated via the CIBERSORT algorithm. C Differences in different immune checkpoints between the two groups. D Correlation analysis between model genes and infiltration levels of different immune cell subsets. The bluer the color, the stronger the negative correlation, and the redder the color, the stronger the positive correlation. *p < 0.05, **p < 0.01, ***p < 0.001, ****p < 0.0001
Fig. 7
Fig. 7
Prediction of immunotherapy response and chemotherapy drug sensitivity. A Differences in TIDE, MSI, dysfunction, and exclusion scores were calculated by the TIDE method. B Differences in scores between responding and non-responding patients. C Distribution of the proportion of responding and non-responding patients between high-risk and low-risk groups. D Survival analysis of patients with early (stages of I + II, the left panel) and advanced (stages of III + IV, the right panel) stages in the two groups. E Differences in drug sensitivity between the two groups. *p < 0.05, **p < 0.01, ***p < 0.001, ****p < 0.0001
Fig. 8
Fig. 8
Exploring the relationship between risk score and cell distribution via sc-RNA analysis. A Identifying specific markers for different cell types. B Different cell types in the GSE141445 dataset are shown in the UMAP plot. C Weight and count of cell chat network. D The communication network of each cell type with other cells. E The incoming and outgoing pathways. F Explore the distribution of model scores across different cell populations via the AUCell function shown by UMAP. G Distribution of model scores in the main cell types. H Distribution of model scores in the various specific cell types. I Distribution of model genes in the sc-RNA sequencing
Fig. 9
Fig. 9
Exploring the relationship between risk score and cell distribution via spatial transcriptomics. Visualizing risk scores through spatial transcriptome, distribution of different cells, and risk scores in the slice
Fig. 10
Fig. 10
CD38 contributes to ferroptosis of PC-3 cells. A Relative mRNA level of CD38. B Relative mRNA level of ferroptosis markers GPX4, PTGS2, and SLC7A11, respectively. C Detection of C11-BODIPY, Fe2+, and ROS, respectively. **p < 0.01, ***p < 0.001, ****p < 0.0001

References

    1. Bray F, Laversanne M, Sung H, Ferlay J, Siegel RL, Soerjomataram I, Jemal A. Global cancer statistics 2022: GLOBOCAN estimates of incidence and mortality worldwide for 36 cancers in 185 countries. CA Cancer J Clin. 2024;74:229–63. 10.3322/caac.21834. - PubMed
    1. Currie E, Schulze A, Zechner R, Walther TC, Farese RV. Cellular fatty acid metabolism and cancer. Cell Metab. 2013;18:153–61. 10.1016/j.cmet.2013.05.017. - PMC - PubMed
    1. Liu Y, Sun Y, Guo Y, Shi X, Chen X, Feng W, Wu LL, et al. An overview: the diversified role of mitochondria in cancer metabolism. Int J Biol Sci. 2023;19:897–915. 10.7150/ijbs.81609. - PMC - PubMed
    1. Luo Y, Wang H, Liu B, Wei J. Fatty acid metabolism and cancer immunotherapy. Curr Oncol Rep. 2022;24:659–70. 10.1007/s11912-022-01223-1. - PubMed
    1. Koundouros N, Poulogiannis G. Reprogramming of fatty acid metabolism in cancer. Br J Cancer. 2020;122:4–22. 10.1038/s41416-019-0650-z. - PMC - PubMed

LinkOut - more resources