Randomized Controlled Trial
. 2025 Jun;7(6):1136-1149.
doi: 10.1038/s42255-025-01290-1. Epub 2025 May 12.

Nicotinamide modulates gut microbial metabolic potential and accelerates recovery in mild-to-moderate COVID-19

Collaborators, Affiliations
Randomized Controlled Trial

Nicotinamide modulates gut microbial metabolic potential and accelerates recovery in mild-to-moderate COVID-19

Stefan Schreiber et al. Nat Metab. 2025 Jun.

Abstract

Cellular NAD+ depletion, altered tryptophan metabolism and gut microbiome dysbiosis are associated with disease progression and unfavourable clinical outcomes in COVID-19. Here, we show that supplementing tryptophan metabolism with nicotinamide alleviates COVID-19 symptoms. We evaluate a 4-week intervention with a novel nicotinamide formulation (1,000 mg) in a prospective, double-blind, randomized, placebo-controlled trial in 900 symptomatic outpatients with PCR-proven COVID-19. In the primary analysis population of participants at risk for severe COVID-19, 57.6% of those receiving nicotinamide and 42.6% receiving placebo recover from their performance drop at week 2 (P = 0.004). Nicotinamide is also beneficial for returning to normal activities (P = 0.009). Effects on gut metagenomic signatures parallel clinical efficacy, suggesting that nicotinamide influences COVID-19-associated faecal microbiome changes. After 6 months, responders to nicotinamide in acute COVID-19 show fewer post-COVID symptoms than placebo responders (P = 0.010). No relevant safety signals are observed. Overall, our results show that nicotinamide leads to faster recovery of physical performance and modulates COVID-19-associated faecal microbiome changes.


Conflict of interest statement

Competing interests: S.S. reports indirect stock ownership in Gerion Biotech as well as consulting and personal fees from AbbVie, Allergosan, Amgen, Arena, BMS, Biogen, Celltrion, Celgene, Falk, Ferring, Fresenius, Galapagos/Gilead, HIKMA, I-Mab, Janssen, Lilly, Morphic, MSD, Mylan, Pfizer, Prometheus, Protagonist, Provention Bio, Sandoz/Hexal, Takeda and Theravance. G.H.W. is employed part-time by the CONARIS Research Institute AG (Kiel, Germany). T.B. reports consulting fees, honoraria or other support from AstraZeneca, Boehringer-Ingelheim, Chiesi, GlaxoSmithKline, Merck, MSD, Novartis, Pfizer and Roche. J.M.P. reports stock ownership in Apeiron Biologics and JLP Health. K.A. reports consulting fees, honoraria or other support from AbbVie, Falk, Galapagos, Janssen, Pfizer and Takeda. M.L. reports a lecture honorarium and travel support by AstraZeneca. P.R. reports stock ownership in Gerion Biotech and consulting fees from Takeda. Additional authors of the COVit-2 Study Group: B.B. reports grants, contracts, consulting fees, honoraria or other support from AbbVie, Arena, BMS, Falk, Ferring, Galapagos, Janssen, MSD and Takeda. D.P. reports meeting support from Advanz Pharma. F.T. reports consulting fees, honoraria or other support from AbbVie, Falk, Janssen, L.E.K. Consulting, Lilly and Sanofi. The remaining authors declare no competing interests.

Figures

Fig. 1
Fig. 1. Clinical endpoints.
a, The primary endpoint (RFITT population) was a significant difference in resolution of performance drop at week 2 in the 379 participants reporting the symptom at baseline (nicotinamide: n = 191 (73 males, 118 females); placebo: n = 188 (77 males, 111 females)). One hundred ten participants responded to nicotinamide at week 2 (48 males, 62 females) and 80 to placebo (34 males, 46 females). Data are shown as relative frequency ± s.d. Two-sided Fisher’s exact test, adjusted for hierarchical testing. OR, odds ratio; CI, confidence interval. be, Secondary endpoints (RFITT population). Data are shown as mean ± s.e. (b,c) or relative frequency ± s.d. (d,e). b, Significant improvement in the ability to perform normal activities at week 2 in the 198 participants with baseline scores of >3 (nicotinamide: n = 103 (41 males, 62 females); placebo: n = 95 (34 males, 61 females)): 3.07 ± 0.12 with nicotinamide (males: 3.34 ± 0.17, females: 2.89 ± 0.16), 2.62 ± 0.13 with placebo (males: 3.00 ± 0.19, females: 2.41 ± 0.16). Two-sided t-test of contrast within a mixed model for repeated measures (MMRM), adjusted for hierarchical testing. c, Improvement of cough at week 2 in the 77 participants with baseline scores of >3 (nicotinamide: n = 44 (17 males, 27 females); placebo: n = 33 (8 males, 25 females)): 3.22 ± 0.16 with nicotinamide (males: 3.31 ± 0.21, females: 3.17 ± 0.22), 2.76 ± 0.18 with placebo (males: 3.09 ± 0.31, females: 2.66 ± 0.23). Two-sided t-test of contrast within MMRM, adjusted for hierarchical testing. d, Among the 397 participants reporting fatigue at baseline (nicotinamide: n = 199 (82 males, 117 females); placebo: n = 198 (78 males, 120 females)), 105 responded to nicotinamide at week 2 (48 males, 57 females) and 96 to placebo (45 males, 51 females). Two-sided Fisher’s exact test, adjusted for hierarchical testing. e, Among the 182 participants reporting shortness of breath at baseline (nicotinamide: n = 92 (36 males, 56 females); placebo: n = 90 (28 males, 62 females)), 56 responded to nicotinamide at week 2 (24 males, 32 females) and 37 to placebo (14 males, 23 females). Exploratory P value from two-sided, post-hoc, unadjusted Fisher’s exact test: P = 0.012. Details regarding symptoms and risk factors are available in Supplementary Tables 8 and 9 and Supplementary Sections 3.2 and 3.3. Source data
Fig. 2
Fig. 2. Gut microbiome characterization in COVit-2 trial participants.
a, Stool samples from 88 participants were collected at baseline (week (W) 0), during intervention (weeks 2 and 4; nicotinamide (NAM) or placebo) and at follow-up (week 6). Cohort 1 included 35 participants per group (NAM: 25 females, 10 males; placebo: 24 females, 11 males), and cohort 2 included 9 participants per group (NAM: 4 females, 5 males; placebo: 5 females, 4 males). Samples underwent 16S rRNA (n = 280) and shotgun metagenomics (n = 72) sequencing. b, α-diversity analysis (Shannon index at amplicon sequence variant level) of 16S rRNA data showed no significant (n.s.) differences across intervention groups or timepoints (two-sided Wilcoxon rank-sum test; likelihood ratio test on linear mixed-effect models; n per group is depicted below each box plot). Box plots show the median (centre line), interquartile range (IQR, box), 1.5 × IQR (whiskers) and outliers (points). c, Microbiota shifts (Aitchison distance, 16S rRNA) were examined using constraint-based principal coordinates analysis in participants with key COVID-19-related symptoms. Significant differences emerged between nicotinamide and placebo at week 2 and week 4 (n = 45 per intervention; PERMANOVA, R2 = 0.015, Fxy = 1.43, false discovery rate (FDR) = 0.002) but not at baseline (week 0) (NAM: n = 24; placebo: n = 23; PERMANOVA, R2 = 0.018, Fxy = 0.82, FDR = 0.99; Supplementary Fig. 4). Dots indicate individual samples, and arrows represent trajectories (baseline → week 2 → week 4). Ellipses show sample distributions per intervention group (solid line: 70% confidence; dashed line: 80% confidence; assuming multivariate normality). Black arrows show the impact of key COVID-19-related symptoms, intervention and age on microbiota dissimilarity, proportional to their correlation. Placebo and key COVID-19-related symptoms had similar effects. FDR: Benjamini–Hochberg-corrected P values. d, Variance partition analysis of the top 20 microbial genera that show highest variation at week 2 and week 4 in the 16S data (n = 67 per intervention). The bar plot shows the mean variance explained for the top 20 microbial genera, with variance attributed to covariates including age (light green), body mass index (BMI) (yellow), key COVID-19-related symptoms (red), fever at baseline (orange), sex (dark green), intervention (purple) and residuals (grey). Prefixes in genus labels denote higher taxonomic ranks: f_, family; p_, phylum. Only samples with at least 5,000 reads were included. For additional metagenomics-based variance partition analyses at the taxonomical level, see Supplementary Fig. 7 and Supplementary Table 21. Source data
Fig. 3
Fig. 3. The metabolic potential of the faecal microbial communities is modified by nicotinamide.
a, Heatmap of changes in significant amino-acid-related pathways found during a cross-sectional comparison of nicotinamide (NAM) versus placebo over time (n = 9 participants per group). There was an increase in tryptophan biosynthesis in participants receiving placebo compared with participants receiving nicotinamide at week 2. For each cell, colours indicate the z-score of the pathway abundance per sample, asterisks denote the significance of Benjamini–Hochberg-corrected P values (false discovery rate (FDR) < 0.25), and prevalence represents the percentage of non-zero features used in the comparison. b, Longitudinal plot of the counts per million (CPM) abundances of the tryptophan biosynthesis pathway (n = 9 per group; two-sided Wilcoxon rank-sum test, *P = 0.026, corrected for multiple comparisons). c, Longitudinal plot of the CPM abundances of the l-lysine biosynthesis pathway (n = 9 per group; two-sided Wilcoxon rank-sum test, *P = 0.014, corrected for multiple comparisons). d, Heatmap of changes in significant cofactor, carrier and vitamin-biosynthesis-related pathways found during a cross-sectional comparison of nicotinamide versus placebo over time (n = 9 per group). Similar to a, colours of cells indicate the z-score of the pathway abundance per sample, asterisks denote the significance of Benjamini–Hochberg-corrected P values (FDR < 0.25) and prevalence represents the percentage of non-zero features used in the comparison. e, Longitudinal plot of the CPM abundances of the NAD+ salvage pathway (n = 9 per group; two-sided Wilcoxon rank-sum test, *P = 0.024, corrected for multiple comparisons). f, Longitudinal plot of the CPM abundances of the menaquinol-6 biosynthesis pathway (n = 9 per group; two-sided Wilcoxon rank-sum test, *P = 0.013, corrected for multiple comparisons). Box plots show the median (centre line), IQR (box), 1.5 × IQR (whiskers) and outliers (points). Source data
Fig. 4
Fig. 4. Differences in the functional potential of the gut microbiota between nicotinamide- versus placebo-receiving COVit-2 trial participants and healthy controls versus people with mild or severe COVID-19.
a, Venn diagram showing 43 overlapping pathways between the COVit-2 trial cohort (green) and the public dataset from Essex et al. (purple) among 220 significant pathways (false discovery rate (FDR) < 0.25). b, PYRIDNUCSAL-PWY pathway (NAD+ salvage pathway I) activity in healthy controls and patients with mild or severe COVID-19 (from ref. ), and longitudinal samples (week (W) 0–6) from nicotinamide (NAM)- and placebo-receiving COVit-2 trial participants. The pathway was enriched in severe COVID-19 and in placebo participants. pnuE, NAD+ pyrophosphatase; pncA, nicotinamidase; pncB, nicotinate phosphoribosyltransferase; nadD, nicotinate-nucleotide adenyltransferase; nadE, NAD+ synthetase; Pi, phosphate; PPi, pyrophosphate. c, Differential pathway abundance plot for cofactor, carrier and vitamin biosynthesis pathways, comparing nicotinamide-receiving or healthy individuals (NAM/healthy) with placebo-receiving individuals or patients with mild or severe COVID-19 (placebo/mild/severe), respectively. d, PWY-5838 (superpathway of menaquinol-8 biosynthesis) abundances, enriched in the placebo and severe groups. e, PWY-6151 (S-adenosyl-l-methionine cycle I) abundances is enriched in nicotinamide-receiving individuals and in healthy individuals over time. f, Differential pathway abundance plot for nucleotide biosynthesis and degradation pathways, showing enriched pathways in NAM/healthy versus placebo/mild/severe groups. g, PWY-6609 (adenine and adenosine salvage III) abundances, enriched in the nicotinamide-receiving and healthy groups. h, Differential pathway abundance plot for amino acid biosynthesis pathways, showing pathways enriched in NAM/healthy versus placebo/mild/severe groups. i, PWY-5097 (l-lysine biosynthesis VI) abundances, enriched in the NAM, healthy and mild groups. Dot plots (c, f, h) represent significantly different pathways from MaasLin2 output (Supplementary Section 3.5), where log2(fold change (FC)) indicates enrichment in NAM/healthy (negative values) or placebo/mild/severe (positive values) groups. Symbol size reflects the number of samples in which the pathway was detected (N.not.zero), and the FDR significance is shown in the colour gradient. Box plots (b, d, e, g, i) show the median (centre line), IQR (box), 1.5 × IQR (whiskers) and outliers (points) of counts per million (CPM) abundance of pathways across healthy (n = 15), mild (n = 15) and severe (n = 8) groups from Essex et al., as well as nicotinamide (n = 9) and placebo (n = 9) groups from COVit-2 (two-sided Wilcoxon rank-sum test, *P < 0.05, **P < 0.01, corrected for multiple comparisons). Right panels in b, d, e, g and i show metabolic maps and key genes of the pathways. Source data
Extended Data Fig. 1
Extended Data Fig. 1. Design of the COVit-2 trial.
Details on trial procedures and design are available in Supplementary Section 3.1.
Extended Data Fig. 2
Extended Data Fig. 2. CONSORT diagram for COVit-2.
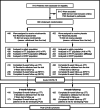
ITT, intention-to-treat; PP, per-protocol; RFITT, participants with at least one risk factor for severe COVID-19; RFPP, participants from RFITT with per-protocol compliance. The main reasons for exclusion of screened subjects were exceedance of the 7-day time window after the first positive PCR test, complete lack of symptoms, rejection of the trial by the subject, or vaccination against SARS-CoV-2. Refusal of potential subjects to participate occurred during the multi-step registration and verification process, usually after they had fully understood the comprehensive requirements of the trial. Reasons for withdrawal from the trial were mostly non-compliance and worsening of COVID-19.
Extended Data Fig. 3
Extended Data Fig. 3. Primary endpoint: resolution of performance drop in the RFITT population from baseline to week 6.
A significantly different resolution of performance drop was seen in the 379 participants reporting the symptom at baseline (nicotinamide: n = 191 [73 males, 118 females]; placebo: n = 188 [77 males, 111 females]). One hundred ten participants responded to nicotinamide at week 2 (48 males, 62 females) and 80 participants to placebo (34 males, 46 females). Graphs represent relative frequency ± s.d. Two-sided Fisher exact test, adjusted for hierarchical testing. Source data
Extended Data Fig. 4
Extended Data Fig. 4. Physical role functioning (SF-36 questionnaire) from baseline to week 6.
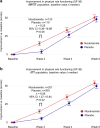
a, Primary analysis population RFITT. b, ITT population. For details on trial populations, see Supplementary Section 3.4. Only subjects with severe complaints (baseline values ≤ median) were included in the analyses (RFITT: nicotinamide: n = 123 [49 males, 74 females], placebo: n = 119 [45 males, 74 females]; ITT: nicotinamide: n = 207 [79 males, 128 females], placebo: n = 209 [74 males, 135 females]. Graphs represent mean ± s.e. Two-sided t-test of contrasts within a mixed model for repeated measures, adjusted for multiple timepoints. The questions from SF-36 V 1.0 related to physical role functioning were as follows: ‘During the past 4 weeks, have you had any of the following problems with your work or other regular daily activities as a result of your physical health? Cut down the amount of time you spent on work or other activities; accomplished less than you would like; were limited in the kind of work or other activities; had difficulty performing the work or other activities (for example, it took extra effort)’. Source data
Extended Data Fig. 5
Extended Data Fig. 5. Subgroup analysis of primary and key secondary endpoints in the RFITT population at week 2.
a, Resolution of performance drop (primary endpoint). The number of participants indicates those included in the analysis due to the presence of performance drop at baseline. b, Improvement in the ability to perform normal activities (first key secondary endpoint). The number of participants indicates those included in the analysis due to the presence of a sufficiently severe reduction in the ability to perform normal activities (a value of >3 on the 6-point complaint scale) at baseline. c, Improvement in cough (second key secondary endpoint). The number of participants indicates those included in the analysis due to the presence of a sufficiently severe cough (a value of >3 on the 6-point complaint scale) at baseline. d, Resolution of fatigue (third key secondary endpoint). The number of participants indicates those included in the analysis due to the presence of fatigue at baseline. For details regarding symptoms and risk factors, see Supplementary Sections 3.2–3.4. Forest plot graphs represent odds ratios (a, d) or mean deviations (b, c) and the respective lower/upper 95% confidence intervals (CI). Source data
Extended Data Fig. 6
Extended Data Fig. 6. Sex-specific analysis of primary and key secondary endpoints in the RFITT population at week 2.
a, Binary symptoms. Forest plot graphs represent odds ratios and the respective lower/upper 95% confidence intervals (CI). Resolution of performance drop: nicotinamide: n = 191 (73 males, 118 females); placebo: n = 188 (77 males, 111 females). Resolution of fatigue: nicotinamide: n = 199 (82 males, 117 females); placebo: n = 198 (78 males, 120 females). The number of participants indicates those included in the analysis due to the presence of performance drop or fatigue at baseline, respectively. b, Complaint scale. Forest plot graphs represent Hedges’ g and lower/upper CI. Improvement in the ability to perform normal activities: nicotinamide: n = 103 (41 males, 62 females); placebo: n = 95 (34 males, 61 females). Improvement of cough: nicotinamide: n = 44 (17 males, 27 females); placebo: n = 33 (8 males, 25 females). The number of participants indicates those included in the analysis due to the presence of a sufficiently severe reduction in the ability to perform normal activities or a sufficiently severe cough (a value of >3 on the 6-point complaint scale) at baseline, respectively. Source data
Extended Data Fig. 7
Extended Data Fig. 7. 6-month follow-up for post-COVID syndrome (PCS) in responders to nicotinamide in the acute phase who were at risk for developing PCS.
The box plots depict the PCS scores of 105 participants at risk for developing PCS with a PCS score >0, who had shown improvement in the primary endpoint or one of the three key secondary endpoints in the acute phase of the disease (nicotinamide: n = 48 [19 males, 29 females]; placebo: n = 57 [15 males, 42 females]). The median PCS score was 6.5 (quartile [Q]1: 3.5, Q3: 11.0) in participants who had received nicotinamide (males: 6.5 [3.5; 11.5], females: 6.5 [3.5; 11.0]) and 10.5 (Q1: 5.5, Q3: 17.0) in participants who had received placebo (males: 10.5 [5.25; 11.0], females: 10.75 [6.5; 17.0]). The mean PCS score ± s.e. was 8.33 ± 0.84 with nicotinamide (males: 8.37 ± 1.34, females: 8.31 ± 1.09) and 11.82 ± 1.03 with placebo (males: 9.67 ± 1.37, females: 12.60 ± 1.29). Box plots show the median (center line), interquartile range (IQR, box), 1.5x IQR (whiskers) and outliers (points). The means (red points) ± standard error (red whiskers) are shown within the box. Two-sided, unadjusted t-test for independent groups. Source data

References

    1. Brenner, C. Viral infection as an NAD+ battlefield. Nat. Metab.4, 2–3 (2022). - PMC - PubMed
    1. Zheng, M., Schultz, M. B. & Sinclair, D. A. NAD+ in COVID-19 and viral infections. Trends Immunol.43, 283–295 (2022). - PMC - PubMed
    1. Bogan, K. L. & Brenner, C. Nicotinic acid, nicotinamide, and nicotinamide riboside: a molecular evaluation of NAD+ precursor vitamins in human nutrition. Annu. Rev. Nutr.28, 115–130 (2008). - PubMed
    1. Anderson, G., Carbone, A. & Mazzoccoli, G. Tryptophan metabolites and aryl hydrocarbon receptor in severe acute respiratory syndrome, coronavirus-2 (SARS-CoV-2) pathophysiology. Int. J. Mol. Sci.22, 1597 (2021). - PMC - PubMed
    1. Sencio, V., Machado, M. G. & Trottein, F. The lung–gut axis during viral respiratory infections: the impact of gut dysbiosis on secondary disease outcomes. Mucosal Immunol.14, 296–304 (2021). - PMC - PubMed

Publication types