. 2025 Jun;21(6):560-598.
doi: 10.1038/s44320-025-00106-4. Epub 2025 May 12.

Metabolic mapping of the human solute carrier superfamily

Affiliations

Metabolic mapping of the human solute carrier superfamily

Tabea Wiedmer et al. Mol Syst Biol. 2025 Jun.

Abstract

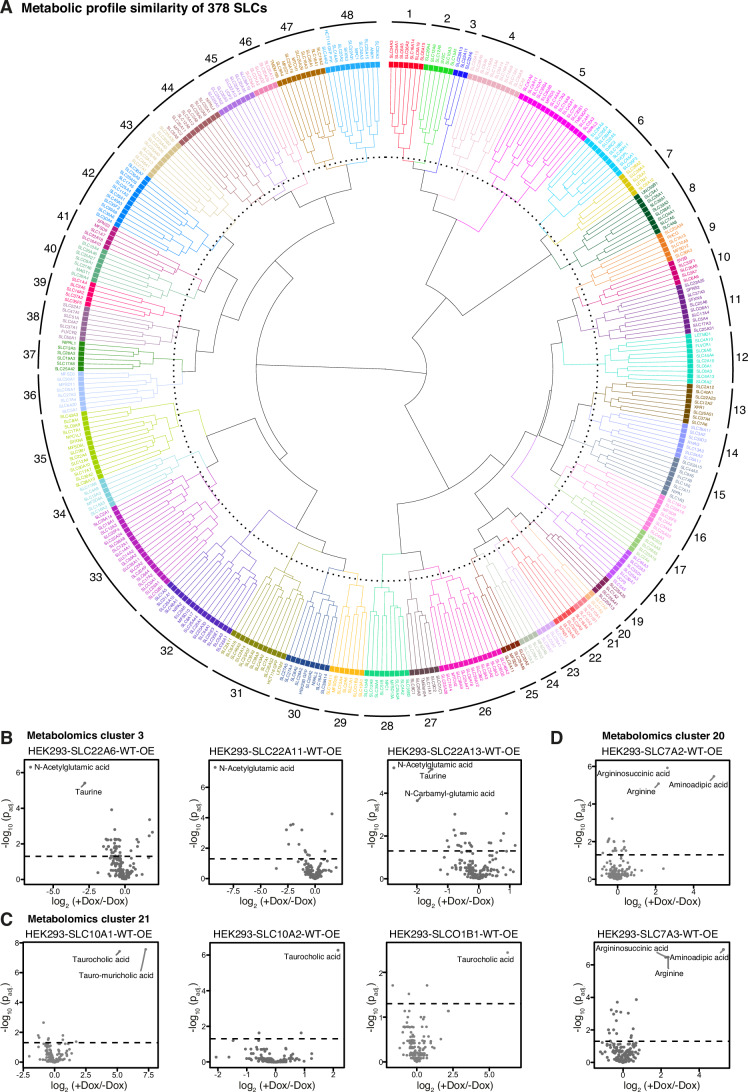
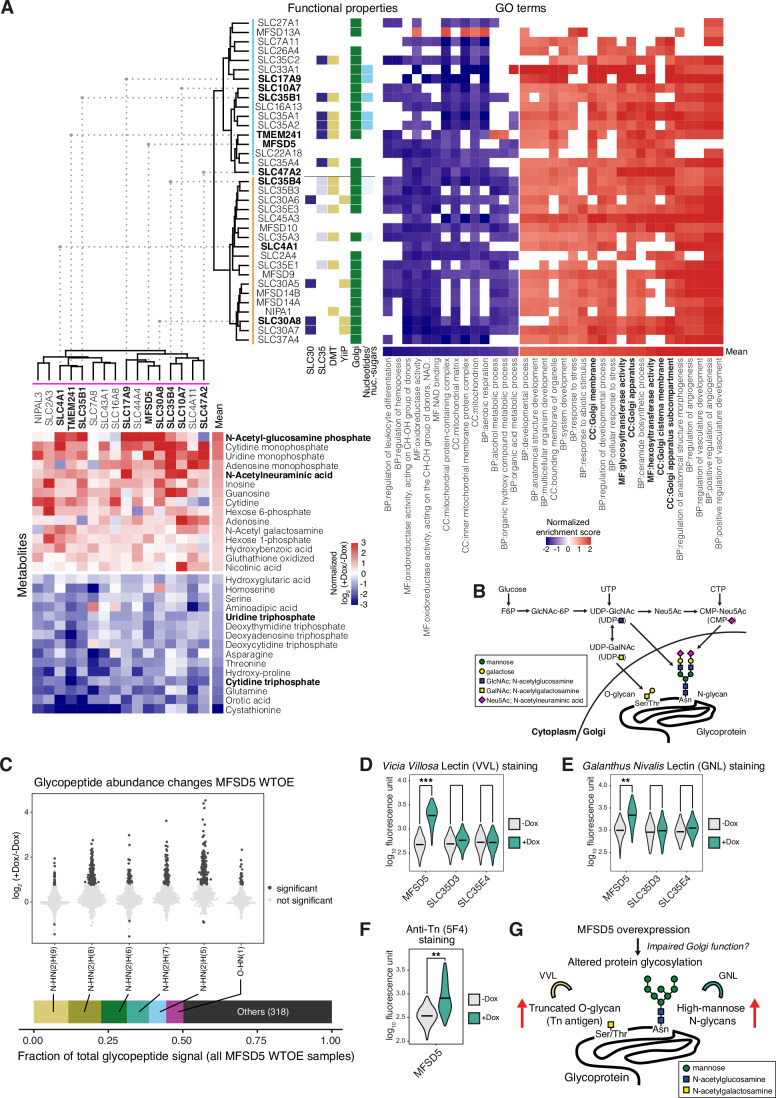
Solute carrier (SLC) transporters govern most of the chemical exchange across cellular membranes and are integral to metabolic regulation, which in turn is linked to cellular function and identity. Despite their key role, individual functions of the SLC superfamily members were not evaluated systematically. We determined the metabolic and transcriptional profiles upon SLC overexpression in knock-out or wild-type isogenic cell backgrounds for 378 SLCs and 441 SLCs, respectively. Targeted metabolomics provided a fingerprint of 189 intracellular metabolites, while transcriptomics offered insights into cellular programs modulated by SLC expression. Beyond the metabolic profiles of 102 SLCs directly related to their known substrates, we identified putative substrates or metabolic pathway connections for 71 SLCs without previously annotated bona fide substrates, including SLC45A4 as a new polyamine transporter. By comparing the molecular profiles, we identified functionally related SLC groups, including some with distinct impacts on osmolyte balancing and glycosylation. The assessment of functionally related human genes presented here may serve as a blueprint for other systematic studies and supports future investigations into the functional roles of SLCs.

Keywords: Membrane Transporters; Metabolism; Metabolomics; Solute Carriers; Transcriptomics.


Conflict of interest statement

Disclosure and competing interests statement. GS-F is a co-founder and owns shares of Solgate GmbH, an SLC-focused company.

Figures

Figure 1
Figure 1. Multi-omic analysis of SLC superfamily-mediated metabolic regulation.
(A) Overview representation of the SLC superfamily-wide RESOLUTE paper collection. (B) Workflow for RESOLUTE cell line generation and acquisition and analysis of targeted metabolomics and RNA-sequencing data sets. For the generation of an SLC cell line collection, the Jump-In™ T-REx™ HEK293 cell line and a panel of five human cancer cell lines of different tissue origin (HCT 116/colon, LS180/colon, 1321N1/brain, SK-MEL-28/skin, and Huh-7/liver) were selected. A set of cell lines with doxycycline-controlled overexpression in wild-type Jump-In™ T-REx™ HEK293 was generated for all SLCs (WT-OE). Among the cancer cell lines, a parental cell line for each individual SLC gene was chosen based on its expression pattern across the panel, and two independent monoclonal knock-out (KO) cell lines generated. Subsequently, the genetically depleted genes were re-expressed with doxycycline-controlled expression vectors of the cognate codon-optimized cDNA to create two KO-overexpression (KO-OE) cell models. SLC expression in KO-OE and WT-OE cell lines was induced by overnight treatment with doxycycline prior to the collection of both untreated and treated samples (four biological replicates per condition for metabolomics, two biological replicates per condition for transcriptomics). Expression plasmids are available at Addgene (https://www.addgene.org/depositor-collections/re-solute/) and HCT 116 KO cell lines at ATCC (https://www.atcc.org/cell-products/cell-models/solute-transporter-carrier-cells). Raw data is available at public repositories (MetaboLights MTBLS10077; ENA PRJEB81360) and the differential analyses in interactive dashboards on the RESOLUTE webpage (https://re-solute.eu/resources/dashboards). (C) Frequency of metabolite abundance changes in Reactome metabolic pathways. For each pathway, the number of metabolomics analyses featuring differentially abundant metabolites that were matched to any reaction within the pathway were counted (metabolomics data set of 378 SLCs, metabolites with Padj. <0.05). Significance of the observed frequencies was tested by permutation, shuffling the identities of the quantified metabolites 200,000 times. Significance levels are visualized on a Voronoi treemap of the hierarchical structure of all sub-pathways of the human Metabolism pathway in Reactome, to show areas specifically affected by SLC overexpression. (D) Frequency of gene expression changes in Reactome metabolic pathways. For each pathway, the number of transcriptomics analyses featuring differentially expressed genes that were matched to any reaction within the pathway were counted (transcriptomics data set of 441 SLCs, genes with Padj. <0.05). Significance of the observed frequencies was tested by permutation, shuffling the identities of the quantified genes 200,000 times. Significance levels are visualized on a Voronoi treemap of the hierarchical structure of all sub-pathways of the human Metabolism pathway in Reactome, to show areas specifically affected by SLC overexpression. (E) Significant SLC-metabolite pairs of SLCs and their annotated substrate. Log2 fold changes and adjusted P values between +/−doxycycline (Dox) of 124 SLC-metabolite pairs of 57 SLCs are visualized. Significance for each SLC-metabolite pair was determined by contrasting each metabolite’s normalized and batch-corrected values in doxycycline-induced samples to the corresponding uninduced samples (four replicates each) in a one-way ANOVA for WT-OE cell lines, or a two-way ANOVA for KO-OE cell lines, modeling the clone effect as an additional factor. P values were adjusted using the Benjamini–Hochberg correction. (F) Significant SLC-metabolite pairs of SLCs and metabolic conversions of their annotated substrate. Log2 fold changes and adjusted P values between +Dox/-Dox of 382 SLC-metabolite pairs of 82 SLCs are visualized. Pairs are colored according to the substrate class of the respective substrate. Significance for each SLC-metabolite pair was determined by contrasting each metabolite’s normalized and batch-corrected values in Dox-induced samples to the corresponding uninduced samples (four replicates each) in a one-way ANOVA for WT-OE cell lines, or a two-way ANOVA for KO-OE cell lines, modeling the clone effect as an additional factor. P values were adjusted using the Benjamini–Hochberg correction. (G) Uniqueness of gene expression changes induced by SLC overexpression. Strong differential gene expression in specific HEK293 WT-OE cell lines ( + Dox/−Dox) were identified by calculation of z-scores of the shrunken log fold change of each gene within a certain analysis and across all analyses. Genes were then further filtered for significance of differential expression (Padj. <0.05; statistical analysis using Wald test and P value adjustment using the Benjamini–Hochberg correction) and for minimal signal (the gene had to have in one condition at least 50 read counts in both replica). Dots of selected pairs to illustrate the differential expression of zinc transporters and metallothioneins upon overexpression of SLC39 family members are colored in red. (H) Differential gene expression analysis between +Dox/−Dox samples of HEK293-SLC39A5-WT-OE, HEK293-SLC39A10-WT-OE, HEK293-SLC39A12-WT-OE, HEK293-SLC39A14-WT-OE cell lines. This analysis only considers endogenous transcripts and excludes transcripts of codon-optimized, overexpressed SLCs. Statistical analysis was performed using the Wald test. P values were adjusted using the Benjamini–Hochberg correction. The dashed line indicates Padj. <0.05.
Figure 2
Figure 2. SLC-metabolite differential abundance pairs illuminate known and novel functional relationships.
(A) Boxplot of all significant SLC-metabolite pairs divided into categories “annotated substrate”, “metabolic conversion”, “novel (non-orphan SLCs)”, “novel (orphan SLCs)”. The number of pairs and the respective number of SLCs are indicated per category. Kruskal–Wallis test was performed between all categories, and the P value for the significant difference indicated between differential metabolite levels of “annotated substrate” and “metabolic conversion” categories (P = 0.000004). The log2 fold change minima, lower whisker, Q1 percentiles, center, Q3 percentiles, upper whisker, maxima for categories “annotated substrate”; “metabolic conversion”; “novel (non-orphan SLCs)”; “novel (orphan SLCs)” are for upregulated pairs 0.02, 0.02, 0.37, 0.92, 2.16, 4.85, 6.26; 0.02, 0.02, 0.15, 0.32, 0.71, 1.55, 6.57; 0.02, 0.02, 0.25, 0.45, 0.79, 1.59, 7.27; 0.04, 0.04, 0.25, 0.40, 0.64, 1.21, 5.97 and for downregulated pairs −8.84, −1.60, −0.80, −0.44, −0.27, −0.05, −0.05; −3.49, −1.27, −0.63, −0.38, −0.21, −0.04, −0.04; −9.79, −1.39, −0.71, −0.44, −0.26, −0.02, −0.02; −5.37, −1.13, −0.62, −0.43, −0.28, −0.03, −0.03, respectively. (B) Significant novel SLC-metabolite pairs for SLCs with an annotated substrate. Respective metabolites are not substrates or metabolic conversions. Pairs are colored according to the substrate class of the respective SLC substrate. Log2 fold changes and adjusted P values between +/−doxycycline (Dox) of 4553 SLC-metabolite pairs of 209 SLCs are visualized. Significance for each SLC-metabolite pair was determined by contrasting each metabolite’s normalized and batch-corrected values in Dox-induced samples to the corresponding uninduced samples (four replicates each) in a one-way ANOVA for WT-OE cell lines, or a two-way ANOVA for KO-OE cell lines, modeling the clone effect as additional factor. P values were adjusted using the Benjamini–Hochberg correction. (C) Significant novel SLC-metabolite pairs for orphan SLCs. Log2 fold changes and adjusted P values between +/−doxycycline (Dox) of 1515 SLC-metabolite pairs of 71 SLCs are visualized. Significance for each SLC-metabolite pair was determined by contrasting each metabolite’s normalized and batch-corrected values in Dox-induced samples to the corresponding uninduced samples (four replicates each) in a one-way ANOVA for WT-OE cell lines, or a two-way ANOVA for KO-OE cell lines, modeling the clone effect as additional factor. P values were adjusted using the Benjamini–Hochberg correction. (DG) Differential metabolite abundance analysis between +/−doxycycline (Dox) samples of (D) HEK293-SLC16A14-WT-OE, (E) HEK293-SLC35F6-WT-OE, (F) HCT116-SLC45A4-KO-OE, (G) HEK293-MFSD5-KO-OE cell lines. Significance for each SLC-metabolite pair was determined by contrasting each metabolite’s normalized and batch-corrected values in Dox-induced samples to the corresponding uninduced samples (four replicates each) in a one-way ANOVA for WT-OE cell lines, or a two-way ANOVA for KO-OE cell lines, modeling the clone effect as additional factor. P values were adjusted using the Benjamini–Hochberg correction. The dashed line indicates Padj. <0.05.
Figure 3
Figure 3. The orphan SLC45A4 is a novel putrescine exporter.
(A) Schematic representation of metabolic pathways that produce GABA. Carbon and nitrogen atoms potentially derived from arginine (and hence labeled from 13C15N-arginine) are marked by small green dots. (B) Labeled (from 13C15N-arginine) and unlabeled abundances of intracellular vs extracellular metabolites for HCT116-SLC45A4-KO-OE cells +/− 24 h doxycycline (Dox) induction. Labeled species are as indicated for each metabolite. Bar heights represent means, error bars represent s.d. (n = 6). (C) Intracellular putrescine and GABA levels in HCT116-SLC45A4-KO-OE cells with and without AOC1 KO + /− 24 h Dox induction. Bar heights represent means, error bars represent s.d. (n = 3). P values (Welch’s t test): putrescine uninduced vs Dox parental cells, 2.34E-03; putrescine uninduced vs Dox AOC1 KO cells, 0.0183; GABA uninduced vs Dox parental cells, 8.73E-04; GABA uninduced vs Dox AOC1 KO cells, 6.83E-03. (D) Intracellular GABA levels in HCT116-SLC45A4-KO-OE cells cultured in regular FBS-containing media, media with dialyzed FBS (dFBS), media with horse serum (HS), or serum-free media (SF) +/− 9 h Dox induction. Bar heights represent means, error bars represent s.d. (n = 3). P values (Welch’s t test): FBS uninduced vs Dox, 1.23E-05; dFBS uninduced vs Dox, 0.0192; HS uninduced vs Dox, 0.0671; SF uninduced vs Dox, 1.37E-03. (E) Intracellular putrescine and GABA levels in HCT116-SLC45A4-KO-OE cells with and without DAO inhibition by aminoguanidine (AMG) +/− 9 h Dox induction. Bar heights represent means, error bars represent s.d. (n = 3). Purple arrows show the proposed pathway leading to increased intracellular GABA accumulation in SLC45A4 overexpression cells: SLC45A4 mediates export of putrescine into the extracellular space, where it is then acted upon by serum-derived DAO activity to generate ABAL for GABA production. P values (Welch’s t test): putrescine uninduced vs Dox without AMG, 2.74E-04; putrescine uninduced vs Dox with AMG, 4.99E-03; GABA uninduced vs Dox without AMG, 8.50E-06; GABA uninduced vs Dox with AMG, 0.505. (F) Putrescine quantification in SEC eluates of SLC45A4 proteoliposomes vs control liposomes over different uptake durations. Data points represent means, error bars represent s.d. (n = 3). P values (Welch’s t test) for SLC45A4 proteoliposomes vs control liposomes comparisons: t = 0, 0.932; t = 2, 0.0610; t = 5, 0.588; t = 10, 0.0363; t = 20, 0.0371. Where presented, asterisks (*) and n.s. on significance bars indicate P < 0.05 and P ≥ 0.05, respectively. (CE) Metabolite peak areas were normalized to internal standard compound peak area and further normalized to cellular protein content as described in “Methods”.
Figure 4
Figure 4. Similarity clustering of metabolomic profiles reveals known and novel SLC functional relationships.
(A) Dendrogram of hierarchical clustering based on the Euclidean distance matrix of normalized metabolic profiles of 381 cell lines (metabolomics data set of 378 SLC cell lines and 3 GFP cell lines). (B) Differential metabolite abundance analysis upon +/− doxycycline (Dox) induction of HEK293-SLC22A6-WT-OE, HEK293-SLC22A11-WT-OE and HEK293-SLC22A13-WT-OE cell lines. (C) Differential metabolite abundance analysis upon +/− Dox induction of HEK293-SLC10A1-WT-OE, HEK293-SLC10A2-WT-OE and HEK293-SLCO1B1-WT-OE cell lines. (D) Differential metabolite abundance analysis upon +/− Dox induction of HEK293-SLC7A2-WT-OE and HEK293-SLC7A3-WT-OE cell lines. P values were adjusted using the Benjamini–Hochberg correction. The dashed line indicates Padj. <0.05.
Figure 5
Figure 5. Similarity clustering of transcriptomic profiles identifies differential metabolic impacts of SLC functional groups.
(A) Dendrogram of hierarchical clustering based on the Euclidean distance matrix of standard-normalized transcriptional profiles of 450 analyses (transcriptomics data set of 441 SLC cell lines and 3 GFP cell lines; for 5 SLCs, two analyses with different induction times). The outer ring displays mean log2 fold change of metabolic genes in each of 9 top-level Reactome pathways. (B) Overview of coherence between transcriptomics clusters, metabolomics clusters, SLC families, and SLC structural folds. Coherence was quantified by calculating normalized variation of information (NVI) between different groupings, where a smaller NVI indicates higher coherence. (C) Heatmap showing doxycycline (Dox) vs uninduced average log2 fold changes in each cluster, for 25 most differentially expressed genes in cluster 17 compared to other clusters. Cluster numbers are indicated on x axis. (D) Heatmap of Dox vs uninduced log2 fold changes of known substrates of cluster 17 members as well as substrates of SLCs and metabolic enzymes regulated by cluster 17. (E) Illustration of osmolyte uptake and transcriptional response to balance intracellular osmolyte concentrations and decrease osmotic pressure.
Figure 6
Figure 6. Multi-omics-based identification of an SLC cluster with effects on cellular N- and O-linked glycosylation.
(A) Transcriptomics clusters 6 and 7 (left) and metabolomics cluster 5 (right) showing common SLCs between clusters from the two different data modalities. Upper right: Transcriptomic clusters 6 and 7 (thereafter referred to as combined “glycosylation-related cluster”) with significantly enriched functional properties (Fisher’s test P < 0.2) and heatmap of normalized enrichment scores from gene set enrichment analysis (GSEA) on log2 expression fold changes (+Dox/−Dox) of metabolic genes. Only GO terms significant (Padj. <0.05) from the mean log2 fold change profile are shown. Lower left: Heatmap of metabolomics data showing normalized doxycycline (Dox) vs uninduced log2 fold changes (+Dox/−Dox) for SLCs in glycosylation-related cluster. Only metabolites with 15 highest and lowest average log2 fold changes are shown. (B) Schematic representation of the hexosamine and sialic acid biosynthetic pathway that produces nucleotide sugar substrates for glycosyltransferase reactions in the Golgi. (C) Dox-induced vs uninduced glycopeptide abundance log2 fold changes for 6 most abundant glycan compositions across MFSD5-WT-OE samples. Each data point represents a glycopeptide abundance comparison between +/− Dox samples (n = 3). Individual glycopeptides are plotted as discrete points and color-coded by significance. Bottom: stacked barplot indicating fraction of total glycopeptide signal contributed by each glycan composition, showing that these six compositions account for over 50% of the total glycopeptide signal. (D) Cell surface Vicia Villosa Lectin (VVL) staining of +/− Dox cells following primary staining with biotinylated lectin and secondary staining with streptavidin-Alexa Flour 647. Each violin plot represents flow cytometry measurements of at least 30,000 cells pooled from three replicate wells, and horizontal bisecting lines indicate population geometric means. Effect sizes (Cohen’s d) between uninduced and Dox-induced populations of each cell line are indicated by annotated brackets as follows: *d > 0.5; **d > 1; ***d > 2. The Cohen’s d values are: MFSD5, 1.922; SLC35D3, 0.325; SLC35E4, −0.0246. (E) Intracellular GNL staining of +/− Dox cells following permeabilization, primary staining with biotinylated lectin and secondary staining with streptavidin-Alexa Flour 647. Each violin plot represents flow cytometry measurements of at least 30,000 cells pooled from 3 replicate wells, and horizontal bisecting lines indicate population geometric means. Effect sizes (Cohen’s d) between uninduced and Dox-induced populations of each cell line are indicated by annotated brackets as follows: *d > 0.5; **d > 1; ***d > 2. The Cohen’s d values are: MFSD5, 1.197; SLC35D3, 0.115; SLC35E4, 0.306. (F) Anti-Tn antibody staining of MFSD5 +/− Dox cells following primary staining with 5F4 and secondary staining with anti-mouse IgM Alexa Fluor 568. Each violin plot represents flow cytometry measurements of at least 30,000 cells pooled from 3 replicate wells, and horizontal bisecting lines indicate population geometric means. The bracket annotated with ** denotes an effect size (Cohen’s d) >1; the value for MFSD5 is 1.234. (G) Schematic illustration of effects on N- and O-linked glycosylation by overexpression of MFSD5 as validated by lectin staining.
Figure EV1
Figure EV1. Comprehensive multi-omic coverage of the SLC superfamily.
(A) Heatmap illustrating coverage of 447 SLCs across five cancer cell lines considered for KO and KO-OE (HCT 116, LS180, 1321N1, SK-MEL-28, Huh-7) as well as Jump-In™ T-REx™ HEK293. Tpm > 1 was used as threshold for expression. (B) Number of SLCs with targeted metabolomics and transcriptomics data sets and respective parental cell lines included in this study. (C) Coverage of transcriptomics data sets in this study compared to the SLC superfamily (the RESOLUTE list of 447 SLCs). The coverage is given both in absolute numbers per family (top) and percentage of members per family (bottom). (D) Coverage of targeted metabolomics data sets in this study compared to the SLC superfamily (the RESOLUTE list of 447 SLCs). The coverage is given both in absolute numbers per family (top) and percentage of members per family (bottom). (E) Principal component analysis of 378 targeted metabolomics differential analyses. Differential analysis was performed between +Dox/−Dox samples. Data points are colored according to the parental cell lines. Cell line models and number of analyses per cell line are given in brackets. (F) Comparison of the average log2 fold change and frequency of significant changes (Padj. <0.05) for each metabolite across all differential analyses performed (378 SLCs). Metabolite data points are shaded according to the frequency of detection above the calibration minimum (0–1). (G) Profiled SLCs by targeted metabolomics and divided according to the substrate class of their annotated substrates. Colored bars indicate proportion of SLCs with significant changes upon differential analysis of metabolite abundance +/− doxycycline (Dox) induction, while gray bars indicate proportion of SLCs without significant metabolite changes. (H) Frequency of significant changes involving annotated substrates and metabolic conversions compared to frequency of all significant changes. All pairs of SLCs and targeted metabolites were grouped by a potential match of the SLC’s annotated substrates to the targeted metabolite. The frequency of significant change was calculated per group and was found to be significantly higher for the 308 cases where a targeted metabolite could be directly matched to an annotated substrate for the overexpressed SLC. A smaller but also significant effect was found for the 2318 cases where a targeted metabolite could be matched via metabolic conversion to an annotated substrate for the overexpressed SLC (both Fisher’s exact tests; error bars are the 95% confidence region of the perturbation frequency as calculated from the Fisher’s test odds ratio estimate).
Figure EV2
Figure EV2. Overview of SLC-metabolite pairs by category and per metabolite.
(A) Visualization of all significant SLC-metabolite pairs (Padj. <0.05) in a per-metabolite view with metabolites on the y axis and log2 fold change +/−doxycycline (Dox) for each SLC-metabolite pair on the x axis for the combined metabolomics data sets. Colors indicate the SLC-metabolite pair category (‘annotated substrate’, ‘metabolic conversion’, ‘novel (non-orphan SLCs)’, ‘novel (orphan SLCs)’.
Figure EV3
Figure EV3. SLC45A4 mediates GABA production via putrescine export and oxidation.
(A) Representative immunofluorescence images of HCT116-SLC45A4-KO-OE cells +/− 24 h doxycycline (Dox) induction. Red and blue channels show HA-tagged SLC45A4 and DAPI nuclear counterstain, respectively. (B) Intracellular GABA levels in HCT 116 Renilla KO cells transduced with Dox-inducible SLC6A1 overexpression construct and HCT116-SLC45A4-KO-OE cells, following +/− 24 h Dox induction in OptiMEM media +dFBS and switch to OptiMEM +dFBS +100 µM GABA for the indicated durations. Data points represent means, error bars represent s.d. (n = 3). (C) Intracellular sucrose levels in HCT116-SLC45A4-KO-OE cells following +/− 24 h Dox induction and switch to media supplemented with 1 mM sucrose for the indicated durations. Data points represent means, error bars represent s.d. (n = 3). (D) Schematic representation of glutamic acid conversion to GABA, and labeled and unlabeled abundances of intracellular glutamic acid vs GABA in HCT116-SLC45A4-KO-OE cells +/− 24 h Dox induction. Carbon atoms potentially derived from glutamic acid (and hence labeled by 13C-glutamic acid) are marked by small green dots. Labeled species are as indicated for each metabolite. Bar heights represent means, error bars represent s.d. (n = 6). (E) Intracellular putrescine and GABA levels in HCT116-SLC45A4-KO-OE cells with and without ODC1 inhibition by 1 mM difluoromethylornithine (DFMO) +/− 9 h Dox induction. Bar heights represent means, error bars represent s.d. (n = 3). P values (Welch’s t test): putrescine uninduced control vs DFMO, 1.50E-06; putrescine Dox control vs DFMO, 3.14E-05; GABA Dox control vs DFMO, 1.37E-04. (F) Intracellular putrescine levels in HCT116-SLC45A4-KO-OE cells cultured in regular FBS-containing media, media with dialyzed FBS (dFBS), media with horse serum (HS), or serum-free media (SF) +/− 9 h Dox induction. Bar heights represent means, error bars represent s.d. (n = 3). P values (Welch’s t test): FBS uninduced vs Dox, 8.96E-03; dFBS uninduced vs Dox, 8.27E-03; HS uninduced vs Dox, 2.60E-03; SF uninduced vs Dox, 2.07E-04. (G) Intracellular GABA levels in HCT116-SLC45A4-KO-OE cells cultured in regular FBS-containing media vs horse serum (HS)-containing media, without (left) or with (right) porcine diamine oxidase (DAO) supplementation +/− 9 h Dox induction. Bar heights represent means, error bars represent s.d. (n = 3). P values (Welch’s t test): FBS Dox vs HS Dox without DAO supplementation, 1.67E-05; FBS Dox vs HS Dox with DAO supplementation, 0.988. (H) Schematic of cell-free putrescine uptake assay. Glycine is encapsulated within liposomes inserted with SLC45A4 protein or protein-free control liposomes as an internal marker of liposome abundance. Liposomes are resuspended in assay buffer containing PIPES as an external marker of buffer carryover. Following addition of 100 µM putrescine and incubation for defined time points, liposome suspensions are filtered through Sephadex G-50 size exclusion chromatography (SEC) spin columns, which traps assay buffer components while allowing liposomes to flow through. The liposome-enriched eluates are then analyzed by LC–MS. (I) Putrescine/glycine and putrescine/PIPES peak ratios in SEC eluates of SLC45A4 proteoliposomes vs control liposomes over different uptake durations. Data points represent means, error bars represent s.d. (n = 3). P values (Welch’s t test) of putrescine/glycine, SLC45A4 proteoliposomes vs control liposomes: t = 0, 0.907; t = 2, 0.119; t = 5, 0.583; t = 10, 0.0381; t = 20, 0.00960. P values (Welch’s t test) of putrescine/PIPES, SLC45A4 proteoliposomes vs control liposomes: t = 0, 0.711; t = 2, 0.0556; t = 5, 0.669; t = 10, 0.110; t = 20, 0.0391. Where presented, asterisks (*) and n.s. on significance bars indicate P < 0.05 and P ≥ 0.05, respectively. For panels (B, C, E, F and G), metabolite peak areas were normalized to internal standard compound peak area and further normalized to cellular protein content as described in “Methods”.
Figure EV4
Figure EV4. Analyses of clustering results identify predominant metabolite changes in metabolomic clusters and reveals enriched functional properties in transcriptomic clusters.
(A) Mean silhouette width across all metabolomic clusters at different cluster numbers (k = 2–100). The dashed line indicates the chosen k = 48. (B) Mean silhouette width across all transcriptomic clusters at different cluster numbers (k = 2–100). The dashed line indicates the chosen k = 60. (C) Heatmap of all clusters and metabolites based on the respective averaged log2 fold changes per cluster. Cluster numbers are indicated on x axis. Metabolites are indicated on y axis. (D) Transcriptomic clusters with significant SLC functional feature enrichment (Fisher’s test P < 0.2). (E) Contributions of individual clusters to normalized variation of information and mutual information between metabolomics and transcriptomics clustering. Cluster size and discreteness (as quantified by silhouette width) are additionally indicated by size and color, respectively.
Figure EV5
Figure EV5. SLC cluster alters both N-and O-linked glycosylation signatures.
(A) GO terms significantly enriched (Padj. <0.05) by gene set enrichment analysis (GSEA) on most abundant glycoproteins detected in the data set. Abundance of each glycoprotein were calculated as sum of signal intensities of corresponding glycopeptides across 18 samples (3 replicates each of 3 cell lines – MFSD5 WT-OE, TMEM241 WT-OE, SLC17A9 WT-OE – and 2 conditions – Dox-induced and uninduced). (B) Principal components analysis performed on normalized glycopeptide abundances of 18 glycoproteomics samples, whereby to account for possible differences in protein amount, each glycopeptide was normalized to the total abundance of the corresponding protein. (C) Dox-induced vs uninduced glycopeptide abundance log2 fold changes for 7 most abundant glycan compositions across 18 samples. Individual glycopeptides are plotted as discrete points and color-coded by significance. Bottom: stacked barplot indicating fraction of total glycopeptide signal contributed by each glycan composition, showing that these 7 compositions account for over 50% of the total glycopeptide signal. (D) Stacked barplot indicating number of glycopeptides attributed to each glycan composition, showing that ~40.6% (4845 out of 11,938) identified glycopeptides belong to the 7 most abundant glycan compositions. (E) Representative immunofluorescence images of MFSD5 WT-OE uninduced and doxycycline (Dox)-induced cells showing individual and merged channels for Galanthus Nivalis Lectin (GNL), LAMP1 and M6P staining with DAPI nuclear counterstain. (F) Cell surface Vicia Villosa Lectin (VVL) staining of +/− Dox cells for an extended panel of cell lines overlapping between transcriptomic and metabolomic clusters. Each violin plot represents flow cytometry measurements of at least 30,000 cells pooled from 3 replicate wells, and horizontal bisecting lines indicate population geometric means. Effect sizes (Cohen’s d) between uninduced and Dox-induced populations of each cell line are indicated by annotated brackets as follows: *d > 0.5; **d > 1; ***d > 2. The Cohen’s d values are: MFSD14B, 1.036; MFSD5, 1.095; SLC10A7, 0.645; SLC16A13, 0.469; SLC17A9, 1.022; SLC30A8, 0.781; SLC35A1, 0.22; SLC35B1, -0.141; SLC35B4, 1.622; SLC37A4, 1.466; SLC47A2, -0.068; SLC4A1, 0.316; SLC7A11, 0.113; TMEM241, 0.856; SLC35D3, 0.122; SLC35E4, 0.312. (G) intracellular GNL staining of +/− Dox cells for an extended panel of cell lines overlapping between transcriptomic and metabolomic clusters. Each violin plot represents flow cytometry measurements of at least 30,000 cells pooled from 3 replicate wells, and horizontal bisecting lines indicate population geometric means. Effect sizes (Cohen’s d) between uninduced and Dox-induced populations of each cell line are indicated by annotated brackets as follows: *d > 0.5; **d > 1; ***d > 2. The Cohen’s d values are: MFSD14B, 2.106; MFSD5, 2.437; SLC10A7, 1.001; SLC16A13, 1.287; SLC17A9, 2.19; SLC30A8, 0.915; SLC35A1, 0.614; SLC35B1, 1.464; SLC35B4, 2.244; SLC37A4, 3.125; SLC47A2, 0.436; SLC4A1, 0.331; SLC7A11, 0.75; TMEM241, 1.336; SLC35D3, 0.386; SLC35E4, −0.025. (H) Flow cytometry histograms comparing cell surface VVL staining of SLC30A8 and SLC47A2 WT-OE +/− Dox cells. Dashed boxes indicate +Dox cell populations with increased VVL staining. (I) Flow cytometry histograms comparing cell surface VVL staining of MFSD5, SLC30A8 wild-type, and SLC30A8 D110N-D224N (transport-deficient mutant) +/− Dox cells. Dashed boxes indicate +Dox cell populations with increased VVL staining, which is absent in the transport-deficient mutant. (J) Principal components analysis of gene expression log2 fold change profiles of SLC30A8 D110N-D224N along with the 450 SLCs used in transcriptomic clustering.

References

    1. Agrawal S, Kumar S, Sehgal R, George S, Gupta R, Poddar S, Jha A, Pathak S (2019) El-MAVEN: a fast, robust, and user-friendly mass spectrometry data processing engine for metabolomics. Methods Mol Biol 1978:301–321 - PubMed
    1. Alam S, Doherty E, Ortega-Prieto P, Arizanova J, Fets L (2023) Membrane transporters in cell physiology, cancer metabolism and drug response. Dis Model Mech 16:dmm050404 - PMC - PubMed
    1. Azzollini L, Prete DD, Wolf G, Klimek C, Saggioro M, Ricci F, Christodoulaki E, Wiedmer T, Ingles-Prieto A, Superti-Furga G et al (2024) Development of a live cell assay for the zinc transporter ZnT8. SLAS Discov 29:100166 - PubMed
    1. Baker SA, Rutter J (2023) Metabolites as signalling molecules. Nat Rev Mol Cell Biol 24:355–374 - PubMed
    1. Bar-Peled L, Kory N (2022) Principles and functions of metabolic compartmentalization. Nat Metab 4:1232–1244 - PMC - PubMed

Substances

LinkOut - more resources