. 2025 Jun;21(6):531-559.
doi: 10.1038/s44320-025-00105-5. Epub 2025 May 12.

The genetic interaction map of the human solute carrier superfamily

Affiliations

The genetic interaction map of the human solute carrier superfamily

Gernot Wolf et al. Mol Syst Biol. 2025 Jun.

Abstract

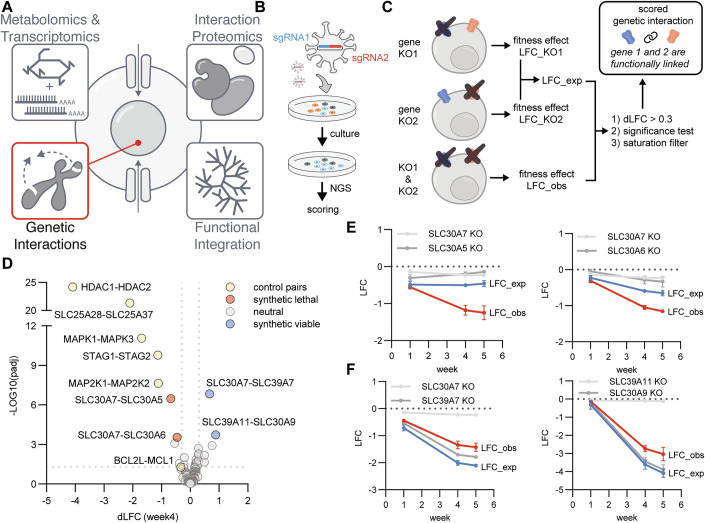
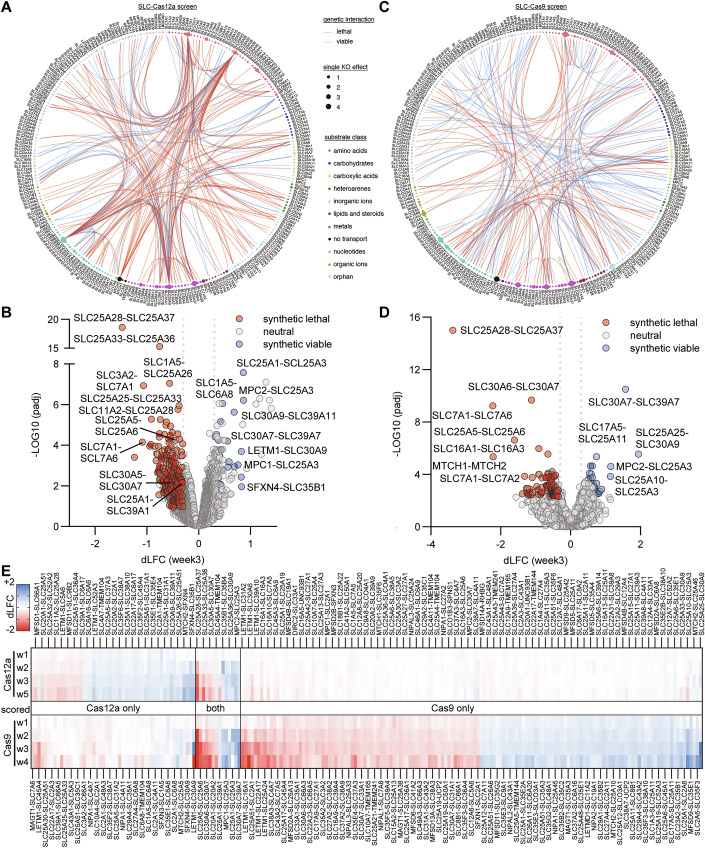
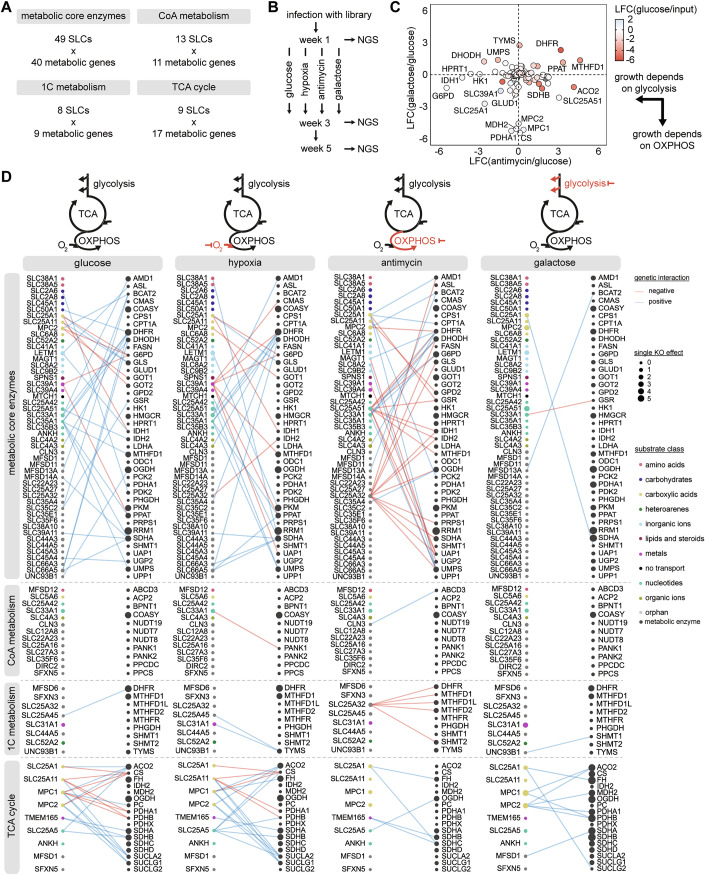
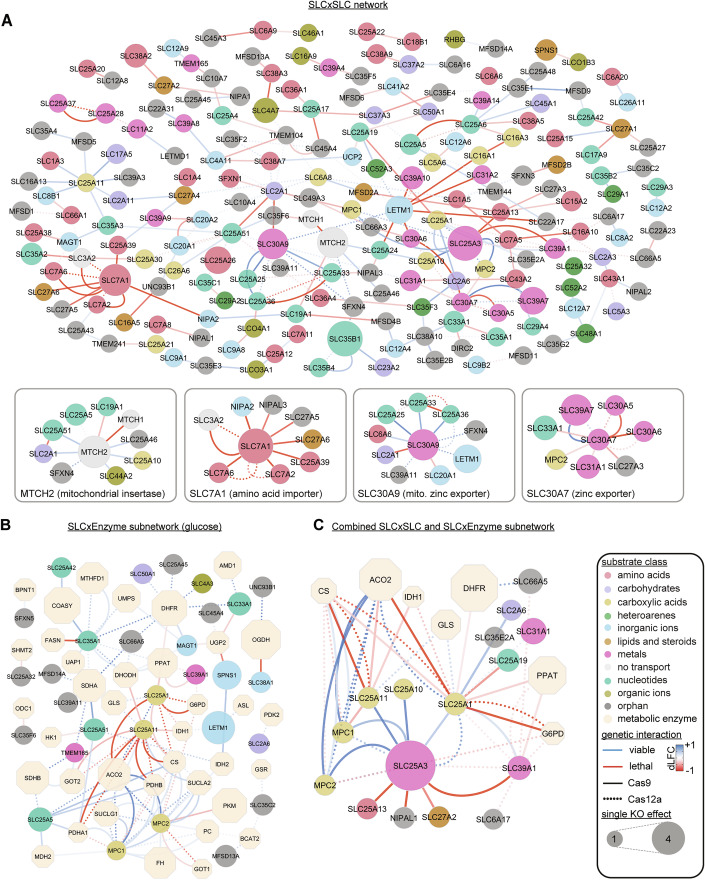
Solute carriers (SLCs), the largest superfamily of transporter proteins in humans with about 450 members, control the movement of molecules across membranes. A typical human cell expresses over 200 different SLCs, yet their collective influence on cell phenotypes is not well understood due to overlapping substrate specificities and expression patterns. To address this, we performed systematic pairwise gene double knockouts using CRISPR-Cas12a and -Cas9 in human colon carcinoma cells. A total of 1,088,605 guide combinations were used to interrogate 35,421 SLC-SLC and SLC-enzyme double knockout combinations across multiple growth conditions, uncovering 1236 genetic interactions with a growth phenotype. Further exploration of an interaction between the mitochondrial citrate/malate exchanger SLC25A1 and the zinc transporter SLC39A1 revealed an unexpected role for SLC39A1 in metabolic reprogramming and anti-apoptotic signaling. This full-scale genetic interaction map of human SLC transporters is the backbone for understanding the intricate functional network of SLCs in cellular systems and generates hypotheses for pharmacological target exploitation in cancer and other diseases. The results are available at https://re-solute.eu/resources/dashboards/genomics/ .

Keywords: CRISPR Screens; Functional Genomics; Genetic Interactions; Metabolism; Solute Carrier Transporters.


Conflict of interest statement

Disclosure and competing interests statement. GS-F is co-founder and owns shares of Solgate GmbH, an SLC-focused company. EG is the CSO of Solgate GmbH.

Figures

Figure 1
Figure 1. Workflow for genetic interaction mapping of SLC transporters and results of benchmark screen targeting 21 metal SLC transporters plus controls (Cas12a-Metal-SLCxSLC).
(A) Overview representation of SLC superfamily-wide data set covered within this RESOLUTE paper collection. (B) Workflow of this genetic interactions study. HCT 116 cells expressing enCas12a or Cas9 were transduced with a lentiviral combinatorial sgRNA library, selected with puromycin, and cultured for up to five weeks. Cells were harvested at multiple time points, followed by library amplification and Illumina sequencing. (C) Abundances of sgRNA combinations at time points were normalized to input, deriving log2 fold changes (LFC) and significance scores (padj) for three replicates. The difference dLFC was derived from LFC_exp, that is the sum of LFCs of single knockouts, and LFC_obs, the experimentally observed LFC. Interactions were scored as genetic interaction if all three replicates tested significant (padj < 0.1), and if |dLFC| > 0.3. Moreover, a saturation filter is applied to minimize false-positive synthetic viable interactions. For example, the SLC39A7-SLC30A9 interaction, showing a positive dLFC but smaller LFC_obs than both single KOs, is filtered out (Fig. EV1A). (D) The metalSLC library screen recovered all control gene pairs (yellow) and identified synthetic lethal (red) and viable (blue) interactions, four weeks post-transduction. Data shown as mean of three independent replicates. Statistical significance determined using Student’s paired t-Tests with a two-tailed distribution. P values were adjusted using the two-stage linear step-up procedure of Benjamini, Krieger and Yekutieli. (E) Change of LFC values over time for synthetic lethal interactions (LFC_obs < LFC_exp). Mean ± SD of three replicates. (F) Change of LFC values over time for synthetic viable interactions (LFC_obs > LFC_exp). Mean ± SD of three replicates.
Figure 2
Figure 2. Genetic Interactions among SLC transporters in HCT 116 cells.
(A) An overview of 228 genetic interactions among the 258 SLC transporters expressed in HCT 116 cells, identified through a combinatorial CRIPSR-Cas12a double knockout screen of 33,153 SLC-SLC pairs (SLC-Cas12a). The 258 SLCs are ordered by substrate class. The round circles describe single KO effect sizes. Genetic interactions are shown as connecting bands between SLCs. (B) Volcano plot of the 228 interactions in (A), showing the magnitude dLFC and significance −log10(padj) of the interactions. Interactions were only scored as significant if all three replicates scored independently as significant (padj < 0.1). Student’s paired t-Tests with a two-tailed distribution. P values were adjusted using the two-stage linear step-up procedure of Benjamini, Krieger, and Yekutieli. (C) Same as (A) but using an orthogonal CRISPR-Cas9 double KO system (SLC-Cas9), which identified 169 genetic interactions. (D) Same as (B), both for the SLC-Cas9 screen in (C). As the Cas9 screen was only performed in two replicates, they were combined before testing significance once with more stringent cutoff (padj < 0.005). Student’s paired t-Tests with a two-tailed distribution. P values were adjusted using the two-stage linear step-up procedure of Benjamini, Krieger, and Yekutieli. (E) Overlap between the SLC-Cas12a and the SLC-Cas9 data sets, resulting in 208 scored genetic interactions, after exclusion of interactions involving six frequently scoring SLCs that were essential as single KO in both screens based on a LFC(single KO) < −2. The upper band shows the Cas12a dLFC values across timepoints, and the Cas9 values at the bottom.
Figure 3
Figure 3. Genetic interactions of select SLC transporters with metabolic enzymes (Cas12a-SLCxEnzyme) under different growth conditions.
(A) Using the Cas12a system, four sublibraries were designed to cover interactions between SLCs and enzymes involved in specific metabolic pathways. (B) To uncover synthetic lethality or viability between SLCs and metabolic enzymes under different conditions, cells were cultured in standard high-glucose media, hypoxia (1% O2), presence of antimycin (50 nM), or media with glucose mostly replaced by galactose (80% → 90% → 80% galactose). Cells were harvested at multiple time points, and dLFC values were derived and genetic interactions scored based on week 3 compared to input plasmid DNA. (C) Overview of single KO LFCs in standard high-glucose medium (glucose/input; blue-red circle color) compared to antimycin (antimycin/glucose, x-axis) or galactose (galactose/glucose, y-axis). (D) Overview of genetic interactions from the four tested sublibraries under the four growth conditions. Circle size encodes the single KO effects which are colored according to substrate class. Blue connections are synthetic viable and red connections are synthetic lethal interactions.
Figure 4
Figure 4. Combined network views of genetic interaction maps.
(A) Network fusion of the Cas12a-SLCxSLC and Cas9-SLCxSLC screens showing 238 genetic interactions (edges) among 197 SLCs (nodes). For clarity, Cas12a interactions (padj < 0.1) involving six essential SLC were removed in the complete view, resulting in 69 edges. These are depicted together with 169 Cas9 edges, derived from the more conservative padj <0.005 cutoff. In contrast, the zoomed-in boxed views contains all unfiltered Cas12a (padj < 0.1) and Cas9 (padj < 0.01) interactions, highlighting subnetworks with functional enrichments, such as amino acid importers and zinc transporters. Different cutoffs were chosen solely to provide a manageable number of interactions for static illustration purposes. The full network is better viewed at www.re-solute.eu/resources/dashboards/genomics/network/ where interactive features (zooming, panning, filtering) facilitate easier navigation through this genetic interaction map. (B) Subnetwork selection of the combined Cas12a-SLCxEnzyme and Cas9-SLCxEnzyme genetic interactions in standard high-glucose medium. (C) Subnetwork selection of the combined genetic network, demonstrating strong interactions among mitochondrial carboxylate transporters, TCA cycle enzymes, and carbohydrate transporters. Shown are all SLCxSLC and SLCxEnzyme interactions involving SLC25A3, SLC25A1, and SLC39A1.
Figure 5
Figure 5. Integrative analysis of other RESOLUTE data on SLC39A1.
(A) Targeted metabolomics of HCT116-SLC39A1-KO-OE cells after doxycycline-induced re-expression of SLC39A1. Mean of four replicates. Significance was determined using two-way ANOVA and p values were adjusted using the Benjamini-Hochberg procedure. (B) Transcriptomics of HCT116-SLC39A1-KO-OE cells after doxycycline-induced re-expression of SLC39A1 and compared to HCT116-SLC39A1-KO. (C) EnrichR MSigDB gene set enrichment analysis of transcriptomics for HCT116-SLC39A1-KO, -KO-OE, and combined. (D) Immunofluorescence images of HEK293-SLC39A1-WTOE cells stained for mitochondria (left image, red, Mitotracker Orange CMTMRos) or Golgi (right image, red, anti-Giantin), nuclei (blue, Hoechst 33342), and SLC39A1 (green, anti-HA). Scale bar 5 μM. (E) AP-MS interaction proteomics data with SLC39A1-pulldown. Solid lines indicate protein-protein interactions (PPIs) with their weight describing the interaction probability score. Dashed lines are supplemented PPIs from the BioGrid database.
Figure EV1
Figure EV1. Workflow for genetic interaction mapping of SLC transporters and benchmark screen targeting 21 metal SLC transporters plus controls (Cas12a-Metal-SLCxSLC).
(A) Example of an interaction filtered out by the saturation filter, SLC39A7-SLC30A9, because LFC_obs < (SLC30A9 KO and SLC39A7). Mean ± SD of three replicates. (B) Change of LFC values over time for synthetic lethal positive control pairs. Mean ± SD of three replicates. (C) Clustered Pearson Correlation Coefficient (PCC) matrix of raw sgRNA read counts for Cas12a-Metal-SLCxSLC replicates at different time points. (D) dLFC values (week 4 vs week 3) for the 210 interactions (without controls) that were part of both the Cas12a-Metal-SLCxSLC benchmark screen and the SLC superfamily-wide Cas12a-SLCxSLC screen, showing highly correlated values.
Figure EV2
Figure EV2. Genetic Interactions among SLC transporters in HCT 116 cells.
(A) Number of genetic interactions per SLC in the Cas12a-SLCxSLC screen. (B) Number of genetic interactions per SLC in the Cas9-SLCxSLC screen. (C) Comparison of single KO effects between the Cas12a-SLCxSLC and Cas9-SLCxSLC screen. (D) Comparison of the effect of sgRNA orientation on single KO LFCs for the Cas12a-SLCxSLC and Cas9-SLCxSLC screen. (E) Comparison of the effect of sgRNA orientation on double KO effects for the Cas12a-SLCxSLC and Cas9-SLCxSLC screen. (F) Comparison of the observed double KO effect at week3 (LFC_obs (week3)) and the expected double KO effect from the sum of both single KO effects (LFC_exp (week3)). Yellow: control pairs, blue: scored synthetic viable interactions, red: scored synthetic lethal interactions. Interactions with the six most essential SLCs were not colored. (G) Overview of 170 interactions involving six frequently scoring SLCs that were essential as single KO in both screens based on a LFC (single KO) < −2. 158 of these interactions were identified in the Cas12a-SLCxSLC screen, while only four were found in both screens.
Figure EV3
Figure EV3. Growth rates, single knockout effects and dynamics of genetic interactions for the SLCxEnzyme screens.
(A) Growth rates of HCT116-Cas12a and HCT116-Cas9 cells following library transduction. Mean ± SD of three replicates. (B) Comparison of single KO effects in hypoxia versus glucose conditions. (C) Heatmap of dLFC values over time for the 54 SLC-SLC pairs additionally included in the SLCxEnzyme library. Stars indicate significance (padj < 0.1 in all three replicates). (D) Heatmap of dLFC values over time for SLC25A32 and SLC25A51 interactions. Displayed are all interactions that were significant for either SLC25A32 or SLC25A51. Stars indicate significance (padj < 0.1 in all three replicates).
Figure EV4
Figure EV4. Comparison of SLCxEnzyme screens using CRISPR-Cas9 and CRISPR-Cas12a systems.
(A) Orthogonal CRISPR-Cas9 screen testing the same gene pairs as shown in Fig. 3D but only in two growth conditions. (B) Side-by-side time course dLFC values genetic interactions that were detected in either the Cas12a-SLCxEnzyme, the Cas9-SLCxEnzyme or both screens. (C) Some interactions are buffering in both Cas12a and Cas9 but in opposite directions, likely due to clonal differences between the HCT116-Cas12a and -Cas9 clones used (e.g., MPC1-MPC2 and MPC1-PDHA). This results in the same genetic interaction classification (lethal vs viable) while exhibiting opposite growth phenotypes in the Cas12a- vs the Cas9- clone. A few interactions disagreed in classification, e.g., SLC25A1-ACO2. Mean ± SD of three replicates.
Figure EV5
Figure EV5. Genetic interactions and transcriptomic changes of SLC39A1 and SLC25A1.
(A) Single KO effects of SLC25A1 and SLC39A1 across different growth conditions in the Cas12a-SLCxEnzyme screen. Mean ± SD of three replicates. (B) Single KO effects of SLC25A1 and SLC39A1 across different growth conditions in the Cas9-SLCxEnzyme screen. Mean ± SD of three replicates. (C) Transcriptomics changes in HCT116-SLC39A1-KO-OE cells after doxycycline-induced expression compared against GFP-OE control, for exclusion of effects caused by doxycycline incubation. (D) Gene ontology enrichment of the protein-protein interaction network shown in Fig. 5D. Significance was determined using Fisher’s exact test and p values were adjusted for multiple testing using the Benjamini-Hochberg method.

References

    1. Beijersbergen RL, Wessels LFA, Bernards R (2017) Synthetic lethality in cancer therapeutics. Annu Rev Cancer Biol 1:141–161
    1. Bellay J, Atluri G, Sing TL, Toufighi K, Costanzo M, Ribeiro PSM, Pandey G, Baller J, VanderSluis B, Michaut M et al (2011) Putting genetic interactions in context through a global modular decomposition. Genome Res 21:1375–1387 - PMC - PubMed
    1. Bennett JA, Mastrangelo MA, Ture SK, Smith CO, Loelius SG, Berg RA, Shi X, Burke RM, Spinelli SL, Cameron SJ et al (2020) The choline transporter Slc44a2 controls platelet activation and thrombosis by regulating mitochondrial function. Nat Commun 11:3479 - PMC - PubMed
    1. Billmann M, Ward HN, Aregger M, Costanzo M, Andrews BJ, Boone C, Moffat J, Myers CL (2023) Reproducibility metrics for context-specific CRISPR screens. Cell Syst 14:418–422.e2 - PMC - PubMed
    1. Blankenberg D, Gordon A, Von Kuster G, Coraor N, Taylor J, Nekrutenko A, Galaxy Team (2010) Manipulation of FASTQ data with Galaxy. Bioinformatics 26:1783–1785 - PMC - PubMed

MeSH terms

Substances

LinkOut - more resources