. 2025 May 13;25(1):692.
doi: 10.1186/s12879-025-11078-z.

Utilizing Nanopore direct RNA sequencing of blood from patients with sepsis for discovery of co- and post-transcriptional disease biomarkers

Collaborators, Affiliations

Utilizing Nanopore direct RNA sequencing of blood from patients with sepsis for discovery of co- and post-transcriptional disease biomarkers

Jingni He et al. BMC Infect Dis. .

Abstract

Background: RNA sequencing of whole blood has been increasingly employed to find transcriptomic signatures of disease states. These studies traditionally utilize short-read sequencing of cDNA, missing important aspects of RNA expression such as differential isoform abundance and poly(A) tail length variation.

Methods: We used Oxford Nanopore Technologies sequencing to sequence native mRNA extracted from whole blood from 12 patients with definite bacterial and viral sepsis and compared with results from matching Illumina short-read cDNA sequencing data. Additionally, we explored poly(A) tail length variation, novel transcript identification, and differential transcript usage.

Results: The correlation of gene count data between Illumina cDNA- and Nanopore RNA-sequencing strongly depended on the choice of analysis pipeline; NanoCount for Nanopore and Kallisto for Illumina data yielded the highest mean Pearson's correlation of 0.927 at the gene level and 0.736 at the transcript isoform level. We identified 2 genes with differential polyadenylation, 9 genes with differential expression and 4 genes with differential transcript usage between bacterial and viral infection. Gene ontology gene set enrichment analysis of poly(A) tail length revealed enrichment of long tails in mRNA of genes involved in signaling and short tails in oxidoreductase molecular functions. Additionally, we detected 240 non-artifactual novel transcript isoforms.

Conclusions: Nanopore RNA- and Illumina cDNA-gene counts are strongly correlated, indicating that both platforms are suitable for discovery and validation of gene count biomarkers. Nanopore direct RNA-seq provides additional advantages by uncovering additional post- and co-transcriptional biomarkers, such as poly(A) tail length variation and transcript isoform usage.

Keywords: Differential transcript usage; Direct RNA-sequencing; Disease biomarkers; Long-read sequencing; Novel isoform detection; Oxford Nanopore Technologies; Polyadenylation.


Conflict of interest statement

Declarations. Ethics approval and consent to participate: The Children’s Health Queensland Hospital and Health Service Human Research Ethics Committee; Queensland, Australia. approved the study on June 9, 2017 (HREC/17/QRCH/85). Written informed consent or delayed consent was obtained for all participants from their parents/carers. The study adhered to the WMA Declaration of Helsinki – Ethical Principles for Medical Research Involving Human Participants. Consent for publication: Not applicable. Competing interests: The authors declare no competing interests.

Figures

Fig. 1
Fig. 1
Gene-to-gene comparison with direct RNA-seq and Illumina cDNA-seq using different pipelines. A Pearson correlations between Nanopore RNA-seq and Illumina RNA-seq for all samples using different quantification tools, including NanoCount, IsoQuant, HTSeq, Bambu, and Kallisto. The order of the keys on the X-axis is ONT_Illumina, for example, HTSeq_Kallisto represents HTSeq for ONT correlated with Kallisto for Illunima. B JSD (Jensen–Shannon Divergence) between Nanopore RNA-seq and Illumina cDNA-seq for all samples using different RNA-seq quantification tools, including NanoCount, IsoQuant, HTSeq, Bambu, and Kallisto. C The heatmap of Pearson correlations on coding genes across all 12 samples using NanoCount for Nanopore and Kallisto for Illumina RNA-seq
Fig. 2
Fig. 2
Poly(A) length distribution and Gene Set Enrichment Analysis (GSEA) using genes ranked by poly(A) tail lengths. A Poly(A) length distribution in mitochondrial transcripts. B Poly(A) length distribution in nuclear transcripts. C-E Ridgeplots from the clusterProfiler package with the X-axis indicating the poly(A) lengths and Y-axis indicating the GO term or KEGG pathway. The distribution is the distribution of poly(A) length of those genes that enriched in the corresponding GO enrichment analysis C molecular function D cellular component and E KEGG pathway, and the colour indicates the significance, with adjusted P-value < 0.05 deemed as significant (the full list of significant pathways can be viewed in Supplementary Tables 2–4). The mitochondrial transcripts are excluded and numbers on the plots indicate the number of genes relevant to the GO term/pathway
Fig. 3
Fig. 3
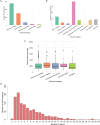
Characterization of novel isoforms identified by IsoQuant. A Structural category distribution for detected novel isoforms. The structural category for an isoform indicates its relation to the closest annotated transcript. B Structural subcategory distribution for detected novel isoforms. C The length distribution of transcripts, stratified by the relation to the annotated transcripts (represented by the assigned structural category). The center line represents the median; hinges represent first and third quartiles; whiskers the most extreme values within 1.5 interquartile range from the box. D The exon number distribution for identified isoforms
Fig. 4
Fig. 4
Differential expression and polyadenylation differences between bacterial vs viral infection. A Volcano plot of viral vs bacterial differential expression from Nanopore direct RNA-seq datasets. Red dots indicate differentially expressed genes (DEGs) using adjusted P-value < 0.05 and |log2FC| ≥ 1 as cutoffs. B Volcano plot of differential polyadenylation results from linear mixed-effects regression (lmer). Red dots indicate DPGs using adjusted P-value < 0.05 and |log2FC| ≥ 0.5 as cutoffs. C-D Raincloud plots showing read-level polyadenylation estimates for top significantly differentially polyadenylated genes for C TPM4 (adjusted P-value = 0.00053), D PIP4K2A (adjusted P-value = 0.019). Each point corresponds to a single read
Fig. 5
Fig. 5
Differential transcript usage occurs between bacterial and viral samples. A-D Differential estimated proportions of transcripts of genes for A) SOD2 (ENSG00000112096.19), B RPS21 (ENSG00000171858.18), C CD36 (ENSG00000135218.19), and D RPL37 (ENSG00000145592.14), with adjusted P-values < 0.05. Asterisks indicate transcripts which meet the adjusted P-value threshold of < 0.05

Similar articles

References

    1. Robinson MD, Oshlack A. A scaling normalization method for differential expression analysis of RNA-seq data. Genome Biol. 2010;11(3): R25. - PMC - PubMed
    1. Wang Z, Gerstein M, Snyder M. RNA-Seq: a revolutionary tool for transcriptomics. Nat Rev Genet. 2009;10(1):57–63. - PMC - PubMed
    1. Marguerat S, Bahler J. RNA-seq: from technology to biology. Cell Mol Life Sci. 2010;67(4):569–79. - PMC - PubMed
    1. Kukurba KR, Montgomery SB. RNA sequencing and analysis. Cold Spring Harb Protoc. 2015;2015(11):951–69. - PMC - PubMed
    1. Lowe R, Shirley N, Bleackley M, Dolan S, Shafee T. Transcriptomics technologies. PLoS Comput Biol. 2017;13(5): e1005457. - PMC - PubMed

LinkOut - more resources