

Explainable predictive models of short stature and exploration of related environmental growth factors: a case-control study
- PMID: 40355909
- PMCID: PMC12067680
- DOI: 10.1186/s12902-025-01936-x
Explainable predictive models of short stature and exploration of related environmental growth factors: a case-control study
Abstract
Background: Short stature is a prevalent pediatric endocrine disorder for which early detection and prediction are pivotal for improving treatment outcomes. However, existing diagnostic criteria often lack the necessary sensitivity and specificity because of the complex etiology of the disorder. Hence, this study aims to employ machine learning techniques to develop an interpretable predictive model for normal-variant short stature and to explore how growth environments influence its development.
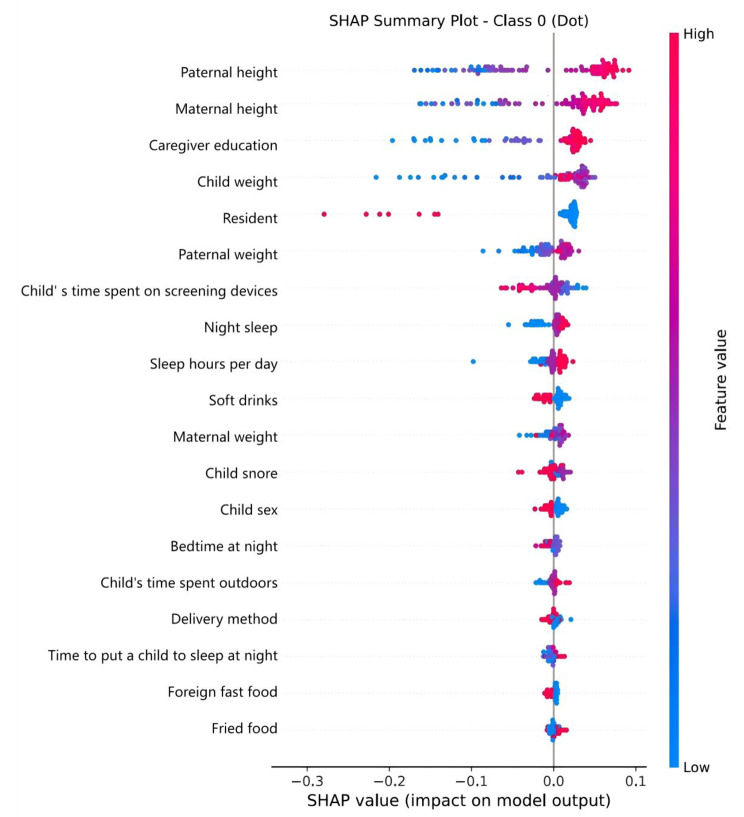
Methods: We conducted a case‒control study including 100 patients with normal-variant short stature who were age-matched with 200 normal controls from the Endocrinology Department of Nanjing Children's Hospital from April to September 2021. Parental surveys were conducted to gather information on the children involved. We assessed 33 readily accessible medical characteristics and utilized conditional logistic regression to explore how growth environments influence the onset of normal-variant short stature. Additionally, we evaluated the performance of the nine machine learning algorithms to determine the optimal model. The Shapley additive explanation (SHAP) method was subsequently employed to prioritize factor importance and refine the final model.
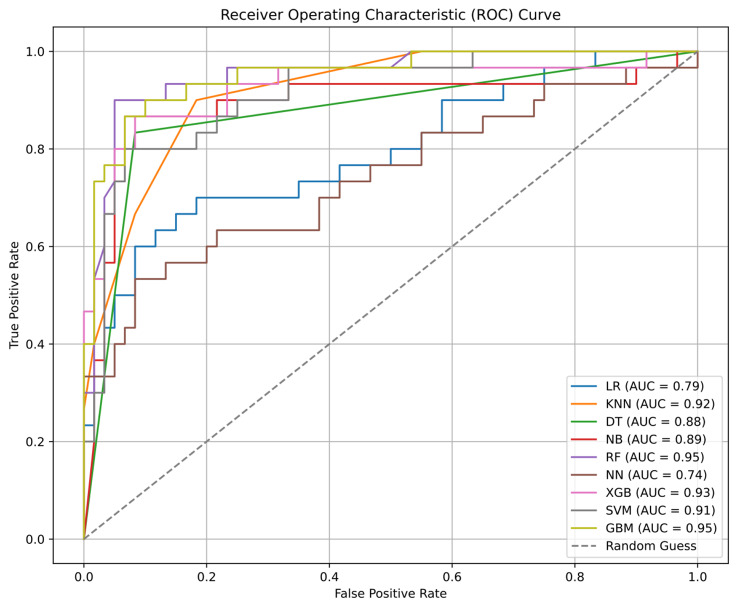
Results: In the multivariate logistic regression analysis, children's weight (OR = 0.92, 95% CI: 0.86, 0.99), maternal height (OR = 0.79, 95% CI: 0.72, 0.87), paternal height (OR = 0.83, 95% CI: 0.75, 0.91), sufficient nighttime sleep duration (OR = 0.48, 95% CI: 0.26, 0.89), and outdoor activity time exceeding three hours (OR = 0.02, 95% CI: 0.00, 0.66) were identified as protective factors for normal-variant short stature. This study revealed that parental height, caregiver education, and children's weight significantly influenced the prediction of normal-variant short stature risk, and both the random forest model and gradient boosting machine model exhibited the best discriminatory ability among the 9 machine learning models.
Conclusions: This study revealed a close correlation between environmental growth factors and the occurrence of normal-variant short stature, particularly anthropometric characteristics. The random forest model and gradient boosting machine model performed exceptionally well, demonstrating their potential for clinical applications. These findings provide theoretical support for clinical identification and preventive measures for short stature.
Keywords: Growth environment; Machine learning; Predictive model; SHAP; Short stature.
© 2025. The Author(s).
Conflict of interest statement
Declarations. Ethics approval and consent to participate: Informed consent for participation was obtained from all participants in the study, and the research received approval from the Institutional Review Board of Nanjing Children’s Hospital. Consent for publication: Not applicable. Competing interests: The authors declare no competing interests. Clinical trial number: Not applicable. Footnotes: Not applicable.
Figures
Similar articles
-
Interpretable machine learning for allergic rhinitis prediction among preschool children in Urumqi, China.Sci Rep. 2024 Sep 27;14(1):22281. doi: 10.1038/s41598-024-73733-w. Sci Rep. 2024. PMID: 39333659 Free PMC article.
-
[Survey on the influential factors of stunting among children under seven years of age in nine cities of China].Zhonghua Er Ke Za Zhi. 2021 Sep 2;59(9):743-751. doi: 10.3760/cma.j.cn112140-20210225-00157. Zhonghua Er Ke Za Zhi. 2021. PMID: 34645214 Chinese.
-
Identifying determinants of malnutrition in under-five children in Bangladesh: insights from the BDHS-2022 cross-sectional study.Sci Rep. 2025 Apr 24;15(1):14336. doi: 10.1038/s41598-025-99288-y. Sci Rep. 2025. PMID: 40274916 Free PMC article.
-
Evaluation and management of a child with short stature.Minerva Pediatr. 2020 Dec;72(6):452-461. doi: 10.23736/S0026-4946.20.05980-0. Epub 2020 Jul 20. Minerva Pediatr. 2020. PMID: 32686926 Review.
-
Evaluating the child with short stature.Pediatr Clin North Am. 1987 Aug;34(4):825-49. doi: 10.1016/s0031-3955(16)36289-7. Pediatr Clin North Am. 1987. PMID: 3302894 Review.
References
-
- Rani D et al. Short Stature, in StatPearls. 2024, StatPearls Publishing Copyright © 2024, StatPearls Publishing LLC.: Treasure Island (FL).
-
- Ranabothu S, Kaskel FJ. Validation of automated Greulich-Pyle bone age determination in children with chronic renal failure? Pediatr Nephrol. 2015;30(7):1051–2. - PubMed
-
- Hoover-Fong J, et al. Blood pressure in adults with short stature skeletal dysplasias. Am J Med Genet A. 2020;182(1):150–61. - PubMed
MeSH terms
Grants and funding
LinkOut - more resources
Full Text Sources
Medical
Miscellaneous
