. 2025 May 12;26(1):100.
doi: 10.1186/s40360-025-00907-1.

Melatonin enhances everolimus efficacy in breast cancer by suppressing mTOR pathway activation and promoting apoptosis and mitochondrial function

Affiliations

Melatonin enhances everolimus efficacy in breast cancer by suppressing mTOR pathway activation and promoting apoptosis and mitochondrial function

Şeyma Demirkesen et al. BMC Pharmacol Toxicol. .

Abstract

Background: Everolimus is used in the treatment of breast cancer by targeting the PI3K/AKT/mTOR pathway, particularly during anti-hormonal therapy. The efficacy of everolimus is limited due to a feedback loop that supresses mTOR while simultaneously enhancing Akt activation in endocrine-resistant breast cancer. Melatonin (N-acetyl-5-methoxytryptamine) regulates mitochondrial activity, cell death, and autophagy due to its strong free radical scavenging, antioxidant, and anti-inflammatory characteristics. Melatonin, a naturally occurring oncostatic agent, slows tumor growth in a range of malignancies, including breast cancer. Due to its ability to protect healthy cells from oxidative stress and inflammation, along with its anti-cancer properties, melatonin has the potential to serve asan effective adjuvant in breast cancer therapy. It also inhibits the phosphorylation of mTOR and Akt, two essential pathways implicated in breast cancer growth, which may aid in overcoming resistance to targeted treatments like everolimus. The combination effects of melatonin and everolimus on hormone receptor-positive breast cancer remains unexplored. This study examined the effectiveness of melatonin when combined with everolimus for the treatment of hormone receptor-positive breast cancer.

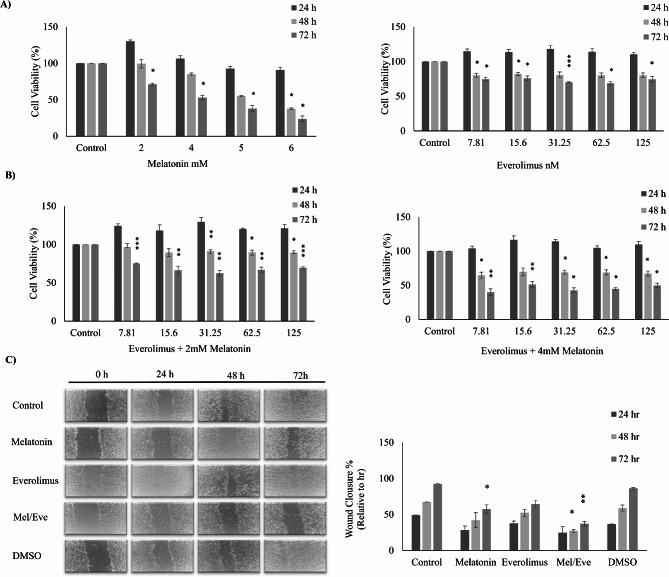
Methods: To investigate the effects of melatonin and everolimus combination, we divided MCF-7 cells into four experimental groups: the control, Melatonin (3 mM), Everolimus (30 nM), and a combination of Melatonin and Everolimus (3 mM + 30 nM). Cell viability, apoptosis, autophagy activation, and mitochondrial function were evaluated using established techniques.

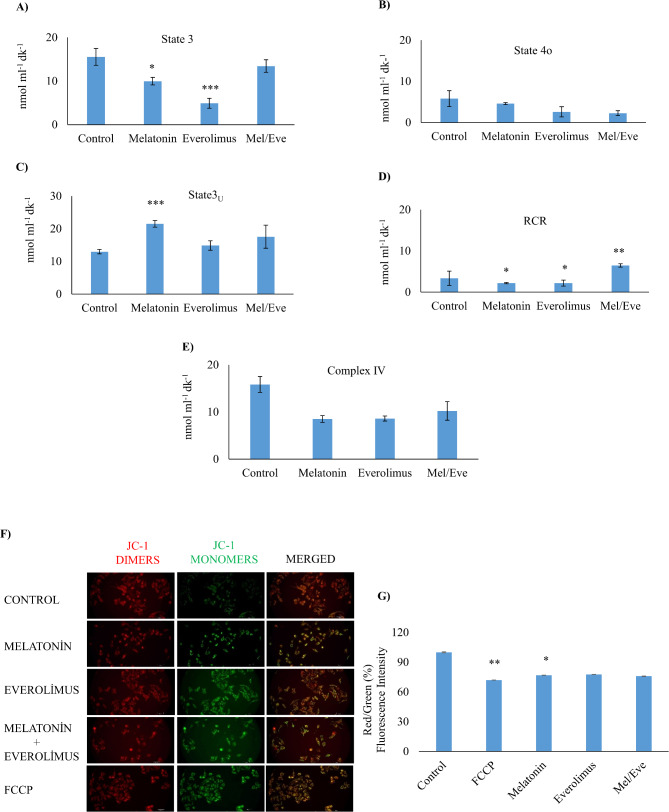
Results: Based on the cell viability test, the combination of 30 nM everolimus and 3 mM melatonin inhibited phosphorylation of 4E-BP1 and p70S6K, which are downstream effectors of the mTOR pathway, and reduced cell growth. In addition, co-administration of melatonin and everolimus increased apoptosis and led to Sub-G1 phase accumulation. LC3 protein expression and LC3 puncta analysis demonstrated autophagic activity. In terms of mitochondrial function, co-administration of melatonin with everolimus did not cause proton leakage or mitochondrial uncoupling, but did restore everolimus-induced respiratory inhibition.

Conclusions: In conclusion, melatonin is thought to improve the effectiveness of everolimus by inhibiting mTOR downstream effectors, enhancing apoptosis, activating autophagy, improving mitochondrial respiration, and reducing MCF-7 growth.

Keywords: Apoptosis; Autophagy; Everolimus; Melatonin; Mitochondrial respiration; mTOR.


Conflict of interest statement

Declarations. Ethical approval: The author of this article declares that the materials and methods used in this study do not require ethical committee permission and/or legal-special permissions. Consent to participate: Not applicable. Consent for publication: All authors give their consent for the publication of the data/manuscript. Competing interests: The authors declare no competing interests.

Figures

Fig. 1
Fig. 1
Melatonin and everolimus combined therapy decreases MCF-7 proliferation. (A) MCF-7 cells were treated over 24, 48, 72 h with melatonin (2, 4, 5, 6 mM), everolimus (7.81, 15.6, 31.25, 62.5, 125 nM), and cell viability was assessed. (B) Cell viability in MCF-7 cells was investigated by combining 4 mM and 2 mM melatonin with varying dosages of everolimus for 24, 48, and 72 h. Normalized results for cell viability assays were represented as a percentage of the control. The data come from three separate trials. (C) Cell scratch assays were performed at 0, 24, 48, and 72 h in the treatments containing the control, melatonin (3 mM), everolimus (30 nM), and the combination of melatonin and everolimus. DMSO serves as a negative control. The amount of gap closing caused by the cells was measured and displayed as bar graphs. (Three separate tests were conducted). The bars represent mean ± SEM. *p < 0.05, **p < 0.005, ***p < 0.0005
Fig. 2
Fig. 2
MEL/EVE suppresses breast cancer cell proliferation via mTOR signaling pathways. (A) The mTOR pathway protein expression levels were evaluated after 72 h of treatment with melatonin, everolimus, and the MEL/EVE combination on MCF-7 cells. (B) Protein band quantitative analyses were performed and displayed as bar graphs. (At least three separate tests were carried out). The bars represent mean ± SEM. *p < 0.05, **p < 0.005, ***p < 0.0005
Fig. 3
Fig. 3
MEL/EVE therapies cause apoptosis and the accumulation of sub G1 cells in HR+, HER2- breast cancer cells. A The amount of apoptosis was measured using annexin V-FITC labeling to detect apoptotic cells in comparison to untreated cells (control), followed by flow cytometry analysis. Bar graphs depict the apoptosis rate of each group.B Flow cytometry was used to examine the cell cycle distribution of 72-hour melatonin, everolimus, and MEL/EVE-treated MCF-7 cells. Bar graphs depict the cell cycle distribution rate of each group. (Three independent experiments were performed). The bars represent mean ± SEM. *p < 0.05, **p < 0.005, ***p < 0.0005
Fig. 4
Fig. 4
Melatonin and everolimus co-treatment enhanced autophagy activation in MCF-7 cells. (A) Melatonin, everolimus, and MEL/EVE were administered to MCF-7 cells in the absence or presence of the lysosomal inhibitor hydroxychloroquine (HCQ, 10 M, 40 min), and the levels of p62, LC3-I, and LC3-II protein expression were measured. As a loading control, β-actin was employed. Protein band quantitative studies were carried out and displayed as bar graphs. (Three separate tests were carried out). ImageJ software was used to calculate band intensity ratios for the p62/Actin and LC3-II/LC3-I ratios. (B) Representative immunofluorescence images showing autophagosomal dot formation in MCF-7 cells labeled with LC3 was seen and quantified in the absence or presence of the lysosomal inhibitor HCQ, (10 M, 40 min). (At least four separate tests were carried out). The inset in the lower left corner represents a magnified view of a selected region from the main image, highlighting the structural details of LC3 puncta. The bars represent mean ± SEM. *p < 0.05, **p < 0.005
Fig. 5
Fig. 5
Respiration rates in digitonin-permeabilized MCF-7 cells. MCF-7 cells supplied with succinate (10 mM) in the presence of 0.2 mM ADP (state 3) A, 5 µM oligomycin A (state 4o) B, 100 mM FCCP (State 3u) C and RCR calculation (state 3/state 4) D were examined by Hansatech Oxygraph. E OCR in digitonin‐permeabilized MCF-7 cells with TMPD/ascorbate (0.2 mM/10 mM) was calculated Hansatech Oxygraph. (At least six independent experiments were performed). F Fluorescence pictures of cells labeled with JC-1 following treatment with the drugs in use (green damaged mitochondria, red healthy mitochondria). G. The amount of fluorescence intensity was measured with ımage J software and shown as bar graphs (At least ten independent experiments were performed). The bars represent mean ± SEM. *p < 0.05, **p < 0.005. OCR, oxygen consumption rate, RCR, respiratory control ratio; TMPD, N, N, N’, N’‐tetramethyl‐p‐phenylenediamine

References

    1. Howlader N, Cronin KA, Kurian AW, Andridge R. Differences in breast cancer survival by molecular subtypes in the united States. Cancer Epidemiol Biomarkers Prev. 2018;27(6):619–26. - PubMed
    1. Faivre S, Kroemer G, Raymond E. Current development of mTOR inhibitors as anticancer agents. Nat Rev Drug Discov. 2006;5(8):671–88. - PubMed
    1. Hay N. The Akt-mTOR Tango and its relevance to cancer. Cancer Cell. 2005;8(3):179–83. - PubMed
    1. Yardley DA, Noguchi S, Pritchard KI, Burris HA 3rd, Baselga J, Gnant M, et al. Everolimus plus exemestane in postmenopausal patients with HR(+) breast cancer: BOLERO-2 final progression-free survival analysis. Adv Ther. 2013;30(10):870–84. - PMC - PubMed
    1. Escames G, Leon J, Macias M, Khaldy H, Acuna-Castroviejo D. Melatonin counteracts lipopolysaccharide-induced expression and activity of mitochondrial nitric oxide synthase in rats. FASEB J. 2003;17(8):932–4. - PubMed

MeSH terms

LinkOut - more resources