. 2025 May 12;7(1):45.
doi: 10.1186/s42523-025-00413-z.

Interactions between time on diet, antibiotic treatment, and liver abscess development on the fecal microbiome of beef cattle

Affiliations

Interactions between time on diet, antibiotic treatment, and liver abscess development on the fecal microbiome of beef cattle

Germán Plata et al. Anim Microbiome. .

Abstract

Background: Liver abscesses caused by polymicrobial infections of the liver are a widespread problem in feedlot cattle production. There are currently no effective methods for the early detection of liver abscesses or to predict antibiotic efficacy for their control. Although gene expression and microbiome differences have been reported in the rumen of abscessed and normal animals, liver abscess biomarkers using less invasive tools can facilitate managing of the disease in the field.

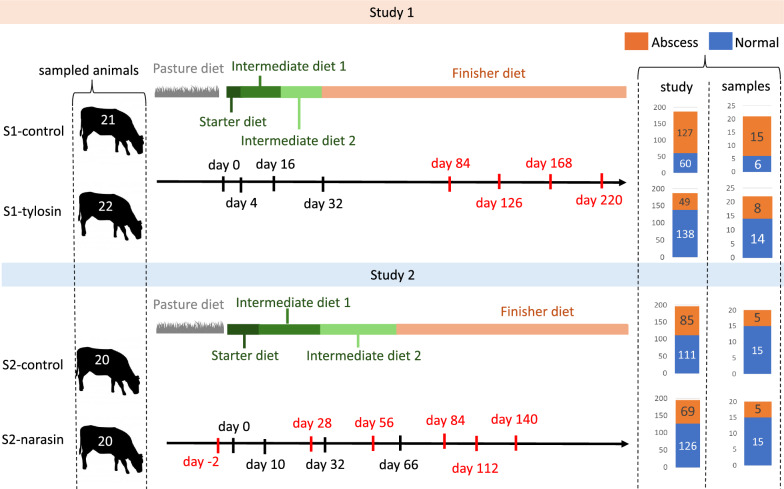
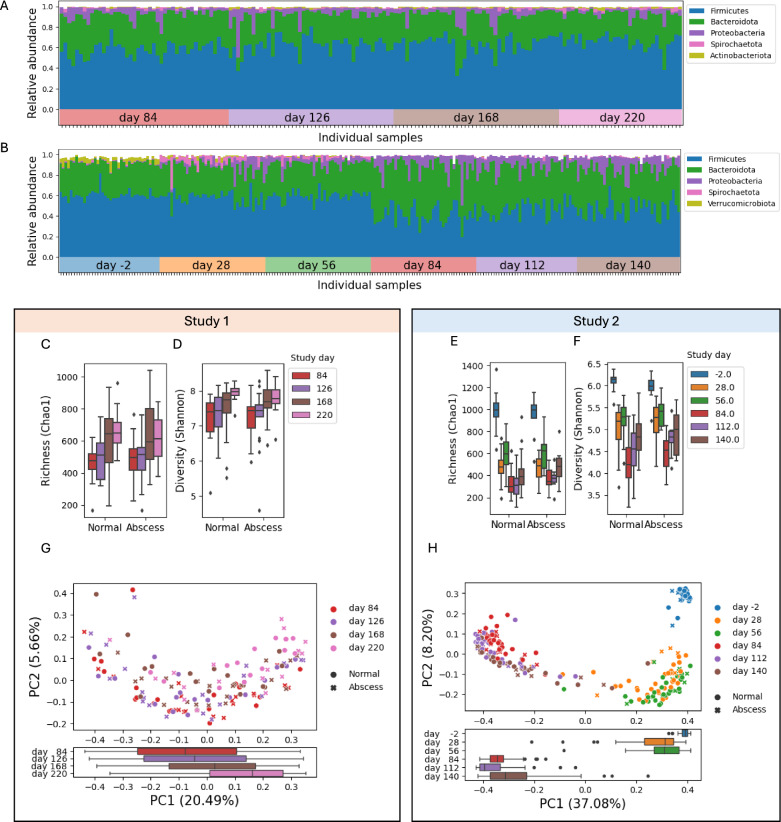
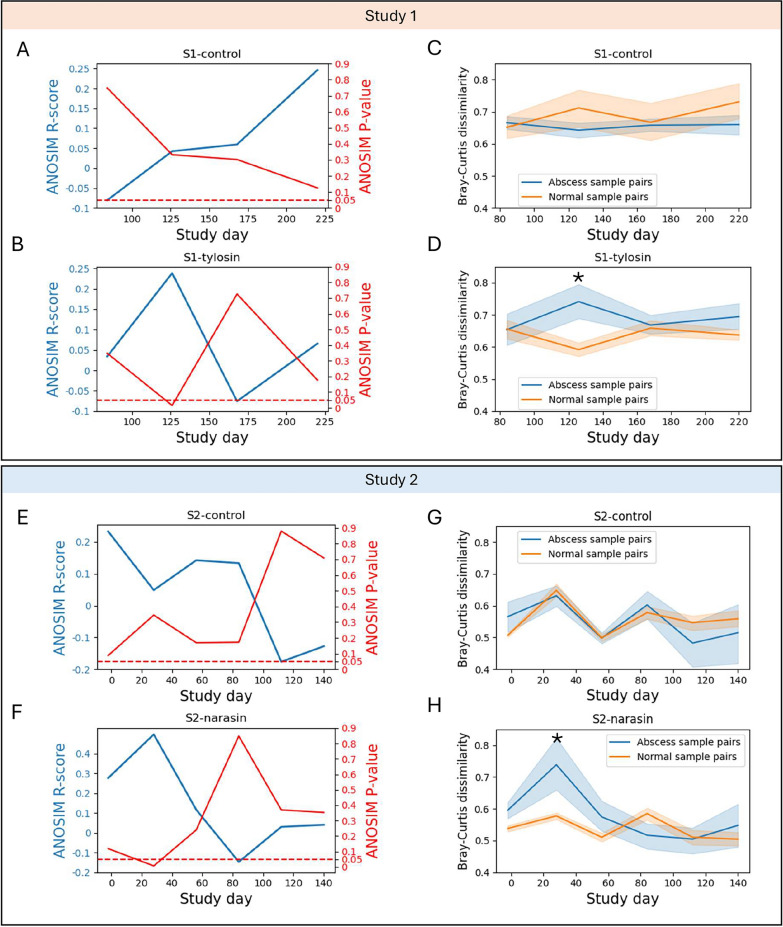
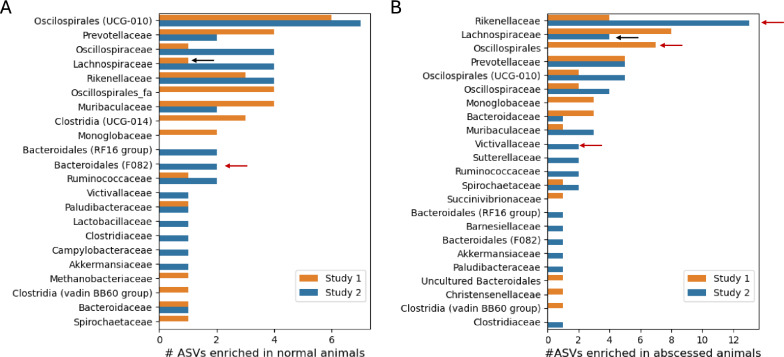
Results: Here we report the results of two studies measuring the fecal microbiome composition of steers that did or did not develop liver abscesses, with or without antibiotic treatment, along a 7-month feeding period on a high-concentrate diet. Our results indicate a limited impact of liver abscesses or tylosin on fecal microbiome composition, with time on diet explaining most variance in the fecal microbiome. Interestingly, in both studies, antibiotic treatment led to larger differences in the variability of the fecal microbiomes between abscessed and normal animals compared to controls. These differences were limited to specific sampling times in each of the two studies. Although multiple amplicon sequence variants with differential abundances according to liver abscess state were identified, there was no overlap between the two studies.

Conclusions: Our results suggest that the fecal abundance of individual microorganisms may not be a robust predictor of liver abscess susceptibility across sampling times or diet regimes. Fecal biomarkers of liver abscess susceptibility might be developed with a focus on other aspects of the hindgut microbiome, especially for animals receiving preventive antibiotics.

Keywords: Antibiotic treatment; Beef cattle; Fecal microbiome; High-energy diets; Liver abscess; Microbial biomarkers.


Conflict of interest statement

Declarations. Competing interests: All authors were Elanco employees when the study was completed. Elanco sells products containing the antibiotics used as treatments in this study. GP, NTB and DS are employees and own profit interest in BiomEdit, LLC.

Figures

Fig. 1
Fig. 1
Treatments and collected samples for study 1 and study 2. Overview of diet schedules, treatments, and numbers of sampled animals in two clinical studies. The black arrows represent time. Black markers indicate the days in which diets were changed; red markers show days fecal samples were collected. The bar plots on the right show, for each treatment in each study, the number of animals diagnosed with liver abscesses at the time of necropsy, as well as the number of animals from which fecal samples were collected according to their liver abscess status
Fig. 2
Fig. 2
Composition of the fecal microbiome of steers in study 1 and study 2. A Relative abundances of major phyla of bacteria detected in samples passing quality thresholds in study 1. Each bar represents an individual sample. Samples are grouped according to the time of sample collection. B Like A but for study 2. C, D the Chao1 and Shannon alpha diversity indexes for ASVs in samples from normal or abscessed steers at different study days from study 1. Boxes represent the interquartile range, and whiskers extend to minimum and maximum values, points outside 1.5 times the interquartile range are plotted individually. E, F Like C, D but for study 2. G The first two principal coordinates calculated on the Bray–Curtis dissimilarity matrix of the relative abundances of ASVs in samples from study 1. Colors represent different fecal sample collection times and symbols indicate abscess diagnosis of corresponding animals. Numbers in parentheses indicate the variance explained by the corresponding principal coordinate. The boxplot shows the distribution of samples collected at different time points on the first principal coordinate. H Like G but for study 2
Fig. 3
Fig. 3
Comparison of the fecal microbiomes of abscessed and normal steers. A the ANOSIM R scores (blue line, left y-axis) for the comparison between samples from normal and abscessed animals from the S1-control treatment at different timepoints. The red line and right y-axis show the corresponding p-values. The dashed line indicates an ANOSIM p-value of 0.05. B, E and F Like A but for animals from the S1-tylosin, S2-control and S2-narasin treatments. C The average Bray–Curtis dissimilarity between all pairwise comparisons between samples from the S1-control treatment as a function of time on diet. Colors indicate samples from abscessed or normal steers. The bands around each line indicate the 95% confidence interval for the mean. D, G and H Like C but for samples from the S1-tylosin, S2-control and S2-narasin treatments. * in panels D and H indicate a p-value < 0.05 for PERMDISP tests between abscess and normal beta-diversity values at the indicated timepoints
Fig. 4
Fig. 4
Taxonomic classification of ASVs associated with liver abscesses. A Number of ASVs per bacterial family with higher relative abundances in normal animals than abscessed animals. B Number of ASVs per bacterial family with higher relative abundances in abscessed animals than normal animals. In both panels colors indicate results for two different studies. Red arrows indicate taxonomic families with a significant enrichment of differentially abundant ASVs (Fisher’s exact test p-value < 0.05). Black arrows indicate families significantly underrepresented among differentially abundant ASVs

Similar articles

Cited by

References

    1. Petri RM, Schwaiger T, Penner GB, Beauchemin KA, Forster RJ, McKinnon JJ, McAllister TA. Characterization of the core rumen microbiome in cattle during transition from forage to concentrate as well as during and after an acidotic challenge. PLoS ONE. 2013;8(12): e83424. - PMC - PubMed
    1. Plaizier JC, Danesh Mesgaran M, Derakhshani H, Golder H, Khafipour E, Kleen JL, Lean I, Loor J, Penner G, Zebeli Q. Review: enhancing gastrointestinal health in dairy cows. Animal. 2018;12(s2):s399–418. - PubMed
    1. Nagaraja TG, Lechtenberg KF. Liver abscesses in feedlot cattle. Vet Clin N Am Food Anim Pract. 2007;23(2):351–69, ix. - PubMed
    1. Brink DR, Lowry SR, Stock RA, Parrott JC. Severity of liver abscesses and efficiency of feed utilization of feedlot cattle. J Anim Sci. 1990;68(5):1201–7. - PubMed
    1. Brown TR, Lawrence TE. Association of liver abnormalities with carcass grading performance and value. J Anim Sci. 2010;88(12):4037–43. - PubMed

LinkOut - more resources