. 2025 Nov;77(11):1560-1572.
doi: 10.1002/art.43219. Epub 2025 Jul 2.

Differences in Dynamics of Specific Antinuclear Antibodies and Their Susceptibility to B Cell-Targeting Treatment in Patients With Systemic Lupus Erythematosus

Affiliations

Differences in Dynamics of Specific Antinuclear Antibodies and Their Susceptibility to B Cell-Targeting Treatment in Patients With Systemic Lupus Erythematosus

Hugo J van Dooren et al. Arthritis Rheumatol. 2025 Nov.

Abstract

Objective: The presence of antinuclear antibodies (ANAs) is characteristic for systemic lupus erythematosus (SLE). Antibody dynamics over time are thought to reflect the cellular source of ANAs and their therapeutic targetability. Anti-double-stranded DNA (anti-dsDNA) is the most prevalent and well-studied of all ANAs, and fluctuations in anti-dsDNA serum levels are associated with disease activity. Antibody dynamics of other ANAs, such as antibodies targeting RNA-binding proteins (RBPs), are often considered more stable compared to anti-dsDNA. However, anti-RBPs may be heterogeneous in nature, and their fluctuation has not been extensively analyzed. Therefore, we aimed to study the dynamics of the different ANAs and their susceptibility to B cell-targeting treatments in patients with SLE.

Methods: Seroconversion of specific ANAs was analyzed using electronic health records from patients with SLE. Titers of specific ANAs and anti-varicella zoster virus (VZV) were determined in serum samples from a longitudinal cohort of patients with SLE and serum from patients with SLE treated with rituximab and belimumab.

Results: Anti-Smith (anti-Sm) and anti-RNP, similar to anti-dsDNA titers, seroconverted more frequently compared to anti-SS-A/SS-B. Furthermore, anti-Sm/RNP and anti-dsDNA titers, but not anti-SS-A/SS-B titers, fluctuated significantly compared to stable anti-VZV controls. Likewise, reductions in anti-dsDNA and anti-Sm/RNP titers after B cell-depleting treatment were comparable in magnitude. However, only anti-dsDNA titer reductions associated with clinical outcomes.

Conclusion: Together, these results show that anti-Sm/RNP and anti-dsDNA, in contrast to anti-SS-A/SS-B, frequently fluctuate and their levels can decrease following B cell-targeted treatments. Thus, distinct ANAs have variable kinetics, potentially reflecting their derivation from different B cell differentiation pathways.


Figures

Figure 1
Figure 1
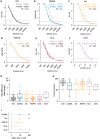
Ranges of specific ANA levels over time. Examples of individual patient trajectories for (A) anti‐dsDNA and (B) anti‐Sm levels. The resulting range is subsequently depicted as a dark‐colored bar when negative seroconversion does not occur, and as a light‐colored bar when seroconversion occurs. (C–H) Ranges of ANA levels for all patients with anti‐dsDNA, anti‐Sm, anti‐U1RNP, anti‐RNP70, anti–SS‐A, and anti–SS‐B. The x‐axis represents patients, ordered by descending maximum measurement values, whereas the y‐axis indicates autoantibody levels. Dashed lines denote the positivity cutoff value. Measurement limits are in place for all ANA except anti‐dsDNA. Negatives seroconversion occurs progressively less frequently from anti‐dsDNA to anti‐SS‐B. ANA, antinuclear antibody; anti‐dsDNA, anti–double‐stranded DNA; anti‐Sm, anti‐Smith.
Figure 2
Figure 2
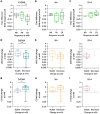
Anti‐dsDNA and anti‐Sm exhibit different titer dynamics compared to anti‐VZV. (A–F) Representative examples of fold titer changes for anti‐VZV, anti‐dsDNA, anti‐Sm, anti‐RNP70, anti–SS‐A, and anti–SS‐B. (G and H) Summary of titer changes and titer decreases depicted as absolute fold change (G) or percentage decrease from baseline (H). Panel H only includes patients with a decrease in titer. (I) Frequencies of ≥2‐fold titer changes of specific ANAs compared to VZV were visualized using Forest plots with 95% confidence intervals of the odds ratios compared to VZV. Each dot indicates an individual patient (G and H), and the boxplot represents the median and quartiles. P values were calculated using Kruskal‐Wallis with Benjamini Hochberg's post hoc test (E and F) or Fisher's exact tests (G). *P ≤ 0.05, **P ≤ 0.01. ANA, antinuclear antibody; anti‐dsDNA, anti–double‐stranded DNA; anti‐Sm, anti‐Smith; VZV, varicella zoster virus. Color figure can be viewed in the online issue, which is available at http://onlinelibrary.wiley.com/doi/10.1002/art.43219/abstract.
Figure 3
Figure 3
Effect of B cell–targeting therapies on specific ANA titers after 24 and 48 weeks of treatment. (A–F) Representative examples of fold titer changes for anti‐VZV, anti‐dsDNA, anti‐Sm, anti‐RNP70, anti–SS‐A, and anti–SS‐B. (G and I) Summarized results of fold titer changes of patients from all three treatment arms. Each dot indicates an individual, and the boxplots represent the median and quartiles. (H and J) Frequencies of ≥2‐fold titer decreases of specific ANAs compared to VZV were visualized using Forest plots with 95% confidence intervals of the odds ratios compared to VZV. P values were calculated using Kruskal‐Wallis test with Benjamini Hochberg's post hoc test (E and G). *P ≤ 0.05, **P ≤ 0.01, ***P ≤ 0.001, ****P ≤ 0.0001. ANA, antinuclear antibody; anti‐dsDNA, anti–double‐stranded DNA; anti‐Sm, anti‐Smith; FC, fold change; VZV, varicella zoster virus. Color figure can be viewed in the online issue, which is available at http://onlinelibrary.wiley.com/doi/10.1002/art.43219/abstract.
Figure 4
Figure 4
Association between clinical outcomes and titer dynamics in response to B cell–targeted therapies. (A–D) Changes in anti‐dsDNA and anti‐Sm titers in patients treated with B cell–targeted therapies after 24 and 48 weeks of treatment, stratified by responder status. Anti‐dsDNA titer reductions are progressively greater in patients with better renal responses, with the most pronounced effects observed after 48 weeks. (E–G) Relationship between C3 concentration changes and autoantibody responses after 24 (E–G) and 48 (H–J) weeks of treatment. Larger (at least two‐fold) decreases in anti‐dsDNA titers are significantly associated with improvement of C3 concentrations. Conversely, anti‐dsDNA titers decrease more significantly in patients whose C3 concentrations normalize. Dots indicate individual patients, and boxplots represent medians and quartiles. P values were calculated using the Mann‐Whitney U‐test or mixed‐effects analysis. *P ≤ 0.05, **P ≤ 0.01, ***P ≤ 0.001. ANA, antinuclear antibody; anti‐dsDNA, anti–double‐stranded DNA; anti‐Sm, anti‐Smith; CR, complete response; NR, nonresponse; PR, partial response. Color figure can be viewed in the online issue, which is available at http://onlinelibrary.wiley.com/doi/10.1002/art.43219/abstract.
Figure 5
Figure 5
Association of titer changes at 24 weeks of B cell–targeted treatment with clinical responses at week 48. Titer changes of specific ANAs (dsDNA, Sm, and SS‐A) at week 24 and their associations with renal responder status (A–C), UPCR fold changes (D–F), and C3 fold changes (G–I) at week 48. A titer was considered “stable” if it decreased less then two‐fold compared to baseline. Each dot indicates an individual, and the boxplots represent the median and quartiles. P values were calculated using the Mann‐Whitney U‐test (A–E). *P ≤ 0.05, **P ≤ 0.01. ANA, antinuclear antibody; anti‐dsDNA, anti–double‐stranded DNA; anti‐Sm, anti‐Smith; CR, complete response; NR, nonresponse; PR, partial response; w24, week 24; UPCR, urine protein creatinine ratio. Color figure can be viewed in the online issue, which is available at http://onlinelibrary.wiley.com/doi/10.1002/art.43219/abstract.

References

    1. Weitzman RJ, Walker SE. Relation of titred peripheral pattern ANA to anti‐DNA and disease activity in systemic lupus erythematosus. Ann Rheum Dis 1977;36(1):44–49. - PMC - PubMed
    1. Bombardier C, Gladman DD, Urowitz MB, et al; The Committee on Prognosis Studies in SLE. A disease activity index for lupus patients. Arthritis Rheum 1992;35(6):630–640. - PubMed
    1. Cappione A III, Anolik JH, Pugh‐Bernard A, et al. Germinal center exclusion of autoreactive B cells is defective in human systemic lupus erythematosus. J Clin Invest 2005;115(11):3205–3216. - PMC - PubMed
    1. Tipton CM, Fucile CF, Darce J, et al. Diversity, cellular origin and autoreactivity of antibody‐secreting cell population expansions in acute systemic lupus erythematosus. Nat Immunol 2015;16(7):755–765. - PMC - PubMed
    1. Brown GJ, Cañete PF, Wang H, et al. TLR7 gain‐of‐function genetic variation causes human lupus. Nature 2022;605(7909):349–356. - PMC - PubMed

MeSH terms