Review
. 2025 Jun 23;31(35):e202404765.
doi: 10.1002/chem.202404765. Epub 2025 May 26.

Chirality in Transition Metal Dichalcogenide Nanostructures

Affiliations
Review

Chirality in Transition Metal Dichalcogenide Nanostructures

Lorenzo Branzi et al. Chemistry. .

Abstract

The fascinating properties introduced by the breaking of mirror symmetry have recently motivated a rising interest in chirality in nanomaterials. In particular, transition metal (TM) dichalcogenides (TMDs) are a wide group of technologically relevant 2D layered materials where recent efforts in the introduction of chirality have shown promising results, attracting great attention for future studies and potential applications. This review article is focused on the development of chirality in TM dichalcogenide nanostructures, dealing with the synthetic strategies that have been adopted to produce chiral TMDs both via solution-phase and vapor-phase syntheses along with the characterization of their chiroptical properties. A broad range of examples, including a variety of nanostructures such as 0D quantum dots (QDs), 1D nanotubes, 2D flakes, and more complex 3D nanostructures as well as different origins of chirality are considered. Critical analysis of potential pitfalls in the assessment of the materials' chirality are discussed. A broad range of exciting properties and applications associated with the materials' chirality, including: nanomedicine, enantioselective catalysis, spin-dependent electrocatalysis, spintronics, and nonlinear optics, are also presented in the review.

Keywords: chirality; molybdenum disulfide; nanostructures; nanotechnology; transition metal dichalcogenides.


Conflict of interest statement

The authors declare no conflict of interest.

Figures

Figure 1
Figure 1
Types of chirality in inorganic nanostructures. a) Enantiomorphs of tellurium exhibiting structural chirality, b) ligand‐induced chirality using cysteine as chiral ligand, c) asymmetric tetrahedra showcasing morphological chirality, and d) chiral helical assemblies of nanoparticles.
Figure 2
Figure 2
Absorption a) and CD b) spectra of cysteine‐functionalized CdSe QDs of sizes 2.6–5.3 nm, showcasing characteristic derivative signal shape at exciton band. c) Schematic depicting calculation of energy splitting (ΔEi) from absorption and CD data. Adapted with permission from Ben‐Moshe et al.[ 33 ]
Figure 3
Figure 3
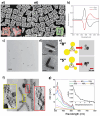
a) Scanning electron microscope (SEM) images of b) L‐ and c) D‐cysteine‐functionalized Au NPs. Insets indicate tilting of vertices with respect to cubic outline (dotted line) and vertices (red dots) as viewed along [100] (ai, left) and [111] (ai, right) directions. b) CD spectra of L‐ and D‐cysteine‐functionalized plasmonic Au NPs. Examples of chiral nanoassemblies. c) TEM images of chiral Au NR dimers on DNA origami (scale bar: 200 nm). d) Enlarged TEM images of chiral Au NR dimers from different angles (scale bars: 20 nm). e) Schematics and TEM images of chiral nanopyramids formed from Au NPs linked by DNA. f) TEM images of nanohelical assemblies of CsPbBr3 NCs on helical silica nanoribbons and g) simulated effect on CD spectra of CsPbBr3 NCs of random removal of NCs. Inset: evolution of g‐factor of increased interparticle distance through removal of 30% of NCs. Au NPs. Figure a,b) are adapted with permission from Lee et al.,[ 12 ] c,d) adapted with permission from Zhou et al.,[ 41 ] e) adapted with permission from Mastroianni et al.,[ 42 ] and f,g) adapted with permission from Liu et al.[ 43 ]
Figure 4
Figure 4
a) Schematic of TM coordination environments and resulting d‐orbital energy splitting diagrams b) schematic of layer stacking in TMD crystals of 1T, 2H, and 3R phases (COD 1 010 993, ICSD 254 956, and ICSD 38 401, respectively), c) band structure of 1T and 2H phases of TMD materials d) schematic of top‐down and bottom‐up approaches used for producing TMD nanostructures. Figure c adapted with permission from Zhao et al.[ 64 ]
Figure 5
Figure 5
Synthetic scheme of the typical strategies adopted for the production of chiral inorganic nanomaterials via solution‐phase approach, multi‐step method (ai), and single‐step method (aii). b) TEM micrograph of MoS2 flakes produced in the presence of L‐cysteine. c) Scanning TEM micrograph of MoS2 flakes produced in the presence of D‐penicillamine. Simulated (d) and experimental (e) CD spectra of chiral MoS2 flakes produced by exfoliation in the presence of penicillamine (left) and cysteine (right). TEM micrograph of MoS2 (f) and WS2 (g) QDs. CD spectra of MoS2 (h) and WS2 (i) QDs functionalized by cysteine (left) and penicillamine (right). (b–e) Adapted with permission from Purcell‐Milton et al.,[ 117 ] copyright 2018 American Chemical Society (f–i) adapted with permission from Zhang et al.[ 118 ] copiright 2018 American Chemical Society.
Figure 6
Figure 6
a) TEM micrograph of MoS2 QDs functionalized with L‐penicillamine and size distribution histogram (inset). b) CD spectra of MoS2 QDs before and after functionalization with L‐ and D‐penicillamine. c,d) Investigation of the angiogenic activity of chiral MoS2 QDs using scratched HUVECs treated at different times. Figure adapted with the permission of Liang et al.[ 121 ]
Figure 7
Figure 7
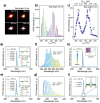
TEM micrograph (a) and CD spectra (b) of chiral MoSe2 QDs produced in the presence of penicillamine. Analysis of the chiral MoSe2 QDs response to hydrogen peroxide addition in different concentrations using CD (c) and PL (d). TEM (e) micrograph of chiral WSe2 QDs obtained by functionalization with L‐cysteine. f) CD spectra of chiral WSe2 QDs functionalized by cysteine. g) Effect of the incubation time in HeLa cells on the CD spectra of WSe2 QDs functionalized by L‐cysteine and (h) CD spectra of the reaction of chiral WSe2 QDs with glutathione in different concentrations. (a‐d) Adapted with permission from Cao et al.,[ 125 ] and (e‐g) adapted with permission from Yang et al.[ 126 ]
Figure 8
Figure 8
SEM (a) and TEM (b) characterization of hybrid chiral MoS2 produced in the presence of R‐MBA (ai, bi) and rac‐MBA (aii, bii). c) CD spectra of the hybrid chiral MoS2. d) Investigation of the chirality‐induced spin selectivity of hybrid chiral MoS2 produced in the presence of R, S, and Rac‐MBA using spin‐polarized c‐AFM. TEM micrographs of TMDs superlattices before (ei) and after (eii) the MBA intercalation. TEM micrograph (f) and CD spectra (g) of chiral MoS2/CoS2 heterostructure. (a‐d) Adapted from Bian et al.,[ 119 ] (e) adapted with permission from Qian et al.[ 114 ] and (f,g) adapted with permission from Zhang et al.[ 120 ]
Figure 9
Figure 9
SEM micrographs of chiral MoS2 nanosheets produced in the presence of L (a,b) and D (c) ‐tartaric acid. CD (d) spectra of chiral MoS2 nanosheets produced in the presence of L (blue) and D (red) ‐tartaric acid. e) Investigation of the effect of the reaction condition on the chirality of MoS2 nanosheets. Effect of the thermal annealing at different temperatures on crystal structure and CD spectra of MoS2 produced in the presence of L (solid line) and D (dashed line) ‐tartaric acid. (a‐e) Adapted from Branzi et al.[ 123 ] and (f,g) adapted from Branzi et al.[ 124 ]
Figure 10
Figure 10
a) Atomistic model of the structure of few layer spiral MoSe2 flake. b) scheme representing spiral flakes characterized by different chirality and number of arms. c) Optical microscopy image of L‐(Left) and R (right) spiral MoSe2 flakes. d) SEM and AFM images of WSe2 nanoplates showing the presence of flakes with different morphologies. e) AFM images of flakes with different morphologies, T (di), TT (dii) and H (diii). e,f) AFM images of WS2 supertwisted spirals with different twist angles. a‐c) Adapted with permission from Wang et al.,[ 173 ] (d, e) adapted from Shearer et al.,[ 180 ] (f,g) adapted with permission from Tong et al.[ 178 ]
Figure 11
Figure 11
ai, aii) AFM images of MoS2 spirals showing different chirality. b) comparison of the SHG output of multilayer, single‐layer and spiral MoS2. (c) AFM characterization of a spiral WSe2 flake. Comparison of the electrical conductivity of MoS2 spiral (d) and multilayer MoS2 produced by exfoliation (di) using c‐AFM. (a, b) Adapted with permission from Zhang et al.,[ 171 ] copyright 2014 American Chemical Society (c) adapted with permission from Chen et al.,[ 179 ] copyright 2014 American Chemical Society and (d) adapted with permission from Ly et al.[ 172 ]
Figure 12
Figure 12
Investigation of the SHG properties of chiral TMDs nanospirals. a) CCD images of an R‐spiral of MoSe2 illuminated using different wavelengths (740, 780, 820, and 680 nm). b) SHG signal and SHG intensity (c) under a broad range of the excitation wavelengths (700 – 1080 nm) of R‐spiral of MoSe2. NLO response of spiral MoTe2, SHG (d), and THG (e) output under different excitation power and SHG (f) and THG (g) intensity output under different excitation wavelengths. SHG output of spiral MoTe2 observed at different heights (h) and comparison with monolayer MoS2 and MoTe2 specimens (i). (a‐c) Reproduced with permission of Wang et al.,[ 173 ] and (d‐i) are reproduced with permission of Ouyang et al.[ 174 ]
Figure 13
Figure 13
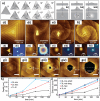
a) Simulated supertwisted spirals with increasing twist angle. b) Effect of the substrate surface on the formation of supertwisted spirals: flat spiral (bi), fastened supertwisted spiral (bii), and unfastened supertwisted spiral (biii). AFM (ci‐fi and cii‐fii) and optical microscopy (ciii‐fiii) images of different examples of WS2 supertwisted spirals with various twist angles. AFM characterization of the morphological evolution of a two‐layer WSe2 hexagonal spiral during etching with hydrogen peroxide: before etching (gi), 20 minutes (gii), 40 minutes (giii), 80 minutes (giv), and 120 minutes (gv), scale bars = 500 nm for all the images. Evolution of the hole depth (h) and distance between the center of the hole to its edge (i) observed at different etching times. (a‐f) adapted with permission from Zhao et al.[ 176 ] and (g‐i) adapted with the permission from Zhao et al.[ 177 ]
Figure 14
Figure 14
a) schematic of right‐handed and left‐handed carbon NTs assembled from graphene sheets rolled up along (8,4) and (4,8) vectors. b) CD spectra of single‐enantiomer single‐walled carbon NTs of varying chiral indices and c) corresponding UV‐Vis‐NIR spectra of single‐walled carbon NT dispersion. (a) adapted with permission from Yang et al.[ 189 ], (b,c) adapted with permission from Ao et al.[ 193 ]
Figure 15
Figure 15
Growth mechanism of WS2 NTs on W18O49 nanowhiskers. NT is shown as midsection model in panels a–h. Reproduced with permission from Kundrát et al.[ 196 ]
Figure 16
Figure 16
a) HR‐TEM of single‐walled MoS2 NTs growth on BNNTs showing different chiral angles, scale bar 5 nm. aii) The corresponding FFT analysis revealing the chiral angles of 0.0°, 15.7°, and 30°. aiii) structural model of MoS2 NTs with zigzag, chiral and armchair structures. b) Distribution of the chirality for MoS2 single‐walled NTs growth on BNNTs. c) characterization of other TMD NTs produced by template growth on BNNTs: High‐angle annular dark‐field scanning TEM (HAAD STEM) scale bars = 5 nm, electron energy loss spectroscopy (EELS), and energy dispersive spectroscopy (EDS) mapping. Adapted with permission from Nakanishi et al.[ 202 ]

References

    1. Ma W., Xu L., De Moura A. F., Wu X., Kuang H., Xu C., Kotov N. A., Chem. Rev. 2017, 117, 8041. - PubMed
    1. Lu J., Xue Y., Kotov N. A., Isr. J. Chem. 2021, 61, 851.
    1. Cao H., Yang E., Kim Y., Zhao Y., Ma W., Adv. Sci. 2024, 11, 2306979. - PMC - PubMed
    1. Wang F., Yue X., Ding Q., Lin H., Xu C., Li S., Nanoscale 2023, 15, 2541. - PubMed
    1. Yasukawa T., Suzuki A., Miyamura H., Nishino K., Kobayashi S., J. Am. Chem. Soc. 2015, 137, 6616. - PubMed

LinkOut - more resources