. 2025 Apr 28:16:1531705.
doi: 10.3389/fneur.2025.1531705. eCollection 2025.

Task demands influence search strategy selection in otoconia-deficient mice

Affiliations

Task demands influence search strategy selection in otoconia-deficient mice

Ryan M Yoder et al. Front Neurol. .

Erratum in

Abstract

Introduction: The vestibular system plays a crucial role in visual and non-visual navigation. Our recent study found that signals from the otolith organs are necessary for mice's use of distal visual cues to guide navigation to an invisible goal. Somewhat surprisingly, however, performance was not significantly impaired on some spatial tasks (e.g., Barnes maze reference memory task), questioning the role of otolith signals in visual navigation.

Methods: We report the results of several additional tests of reference memory performance and search strategy use on two versions of the Barnes maze, in an attempt to establish further understanding of the otolithic contribution to visual navigation.

Results: On a small Barnes maze, control mice preferentially used the efficient "spatial" search strategy by the last (8th) day of training, whereas otoconia-deficient tilted mice failed to show this preference. On the subsequent probe trial, both groups showed a preference for the former goal location, suggesting otolith signals are not necessary for the use of distal cues to triangulate the animal's position, relative to distal cues. On a large Barnes maze, both control and tilted mice used a spatial search strategy most frequently by the last (4th) day of training and showed a preference for the former goal location on the subsequent probe trial.

Discussion: Overall, these results suggest that otolith dysfunction in mice is associated with subtle navigational deficits that became apparent on the small maze but that were less apparent on the large maze. It is possible that these navigational differences resulted from the greater distance between start and goal locations of the large maze, relative to the small maze. Alternatively, the large maze's greater distance between the goal and potential alternatives may have facilitated more accurate place recognition.

Keywords: Barnes maze; otolith organs; reference memory; self-movement; spatial.


Conflict of interest statement

The authors declare that the research was conducted in the absence of any commercial or financial relationships that could be construed as a potential conflict of interest.

Figures
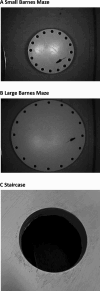
Figure 1
Figure 1
Small and large Barnes mazes. Mice were tested on a small Barnes maze (A; 69 cm diameter) and large Barnes maze (B; 120 cm diameter) in the same physical location, but on different days. (C) Close-up view of the staircase leading into the escape box.
Figure 2
Figure 2
Example search paths, running speed, and first hole deviation on the small Barnes maze. (A,B) Example search paths from one control and one tilted mouse, for training days and the probe trial. (C) Running speed during the initial phase of the task was similar between groups, although this comparison approached significance. Running speed increased across days for both groups, and the interaction was significant. (D) Deviation between the goal and first hole visit is shown for each day of training. Hole deviation decreased significantly across trials, but the group and interaction effects were not significant. Mean ± SEM.
Figure 3
Figure 3
Performance on the small Barnes maze. Control and tilted mice showed significant group differences in latency to reach the goal (A), distance to goal (B), and error rates (C) but showed similar performance improvements across days. (D) On the subsequent probe trial, time spent in the former goal quadrant was significantly greater than expected by chance (45 s; dotted line). Groups did not differ in time spent within any quadrant. Mean ± SEM.
Figure 4
Figure 4
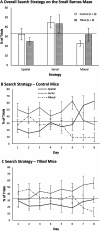
Search strategy on the small Barnes maze. (A) The serial strategy was most common across all training trials for control and tilted mice. (B,C) Control mice increased the use of a spatial strategy across training trials, and tilted mice increased the use of a serial strategy. On the last 2 days of training, control mice used a spatial strategy more often than expected by chance, whereas tilted mice used a serial strategy more often than expected by chance. Dotted line indicates chance expectation (33%). Mean ± SEM.
Figure 5
Figure 5
Example search paths, initial running speed, and first hole deviation on the large Barnes maze. (A,B) Example search paths from one control and one tilted mouse, across all training days and the probe trial. (C) Running speed during the initial phase of the task was similar between groups but increased across days for both groups, and the interaction was significant. (D) Absolute deviation between the goal and first hole visited is shown for each day of training. Deviation scores decreased significantly across trials, but group and interaction effects were not significant. Mean ± SEM.
Figure 6
Figure 6
Performance on the large Barnes maze. Control and tilted mice showed similar latency to reach the goal (A), distance to goal (B), and error rates (C), and performance improved at similar rates across days. (D) On the subsequent probe trial, time spent in the former goal quadrant was significantly greater than expected by chance (45 s; dotted line). Time spent in any quadrant was similar between groups. Mean ± SEM.
Figure 7
Figure 7
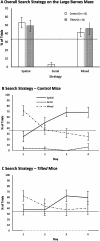
Search strategy on the large Barnes maze. (A) The spatial strategy was most common overall, but both groups used the mixed strategy nearly as often; the serial strategy was rarely used. (B,C) Both groups used the mixed strategy more than expected by chance at the beginning of training but then favored the efficient spatial strategy during the last 2 days. Dotted line indicates chance expectation (33%). Mean ± SEM.

References

    1. Benhamou S, Sauvé J-P, Bovet P. Spatial memory in large scale movements: efficiency and limitation of the egocentric coding process. J Theor Biol. (1990) 145:1–12. doi: 10.1016/S0022-5193(05)80531-4 - DOI
    1. Etienne AS, Joris-Lambert S, Maurer R, Reverdin B, Sitbon S. Optimizing distal landmarks: horizontal versus vertical structures and relation to background. Behav Brain Res. (1995) 68:103–16. doi: 10.1016/0166-4328(94)00165-C, PMID: - DOI - PubMed
    1. Gallistel CR. Representations in animal cognition: an introduction. Cognition. (1990) 37:1–22. doi: 10.1016/0010-0277(90)90016-D, PMID: - DOI - PubMed
    1. Mittelstaedt ML, Mittelstaedt H. Homing by path integration in a mammal. Naturwissenschaften. (1980) 67:566–7. doi: 10.1007/BF00450672 - DOI
    1. Goodridge JP, Taube JS. Preferential use of the landmark navigational system by head direction cells in rats. Behav Neurosci. (1995) 109:49–61. doi: 10.1037/0735-7044.109.1.49, PMID: - DOI - PubMed

LinkOut - more resources