Isolation of Murine Pancreatic Stellate Cells and the Establishment of a New ex-vivo Activation Model
- PMID: 40357130
- PMCID: PMC12067667
- DOI: 10.2147/CEG.S507384
Isolation of Murine Pancreatic Stellate Cells and the Establishment of a New ex-vivo Activation Model
Abstract
Background: Pancreatic stellate cells (PSCs) are critical in the development of pancreatic fibrosis. In vitro, cell attachment itself can promote cell activation. Currently, there is a lack of methods for isolating activated PSCs that are unaffected by cell attachment. This study aims to identify effective methods for isolating quiescent and activated murine PSCs (mPSCs) and to evaluate the potential of caerulein in inducing mPSC activation in an ex vivo model.
Methods: Pancreatic tissue from mice was digested with collagenase P (1.17 U/mL), Pronase (0.5 mg/mL), and DNase I (0.01 mg/mL). Quiescent and activated mPSCs were isolated using a Nycodenz gradient. Immunostaining for α-smooth muscle actin (α-SMA), Desmin, glial fibrillary acidic protein (GFAP), vimentin, CK19, and CD68 was performed to confirm cell purity. Real-time quantitative PCR (RT-PCR) and RNA sequencing assessed the activation phenotype following caerulein treatment.
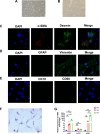
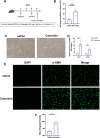
Results: Quiescent and activated mPSCs were successfully isolated using the Nycodenz gradient, with cells exhibiting typical stellate morphology and positive staining for α-SMA, Desmin and vimentin. Oil Red O staining confirmed lipid droplets in quiescent mPSCs. In the caerulein-treated group, mPSC activation was significantly greater than in the saline-treated control group. RT-PCR revealed progressive upregulation of acta2 (**p<0.01, d4 compared to d2, ## p<0.01,d7 compared to d4,**p<0.01,d7 compared to d2), col1a (**p<0.01, d4 compared to d2,**p<0.01,d7 compared to d2), and actg2 (**p<0.01, d4 compared to d2, ## p<0.01,d7 compared to d4, **p<0.01,d7 compared to d2) mRNA levels at 2, 4, and 7 days post-adhesion. Fibroblast markers were also upregulated, and KEGG and GO enrichment analyses identified key pathways involved in ECM-receptor interactions, cell cycle regulation, PI3K-Akt signaling, and extracellular matrix remodeling.
Conclusion: The Nycodenz gradient efficiently isolates quiescent mPSCs, and short-term caerulein treatment effectively activates mPSCs ex vivo, providing a valuable model for studying mPSC activation and related signaling pathways.
Keywords: chronic pancreatitis; pancreatic fibrosis; pancreatic stellate cells.
© 2025 Wang et al.
Conflict of interest statement
The authors report no conflicts of interest in this work.
Figures


Similar articles
-
Inhibitory Smads suppress pancreatic stellate cell activation through negative feedback in chronic pancreatitis.Ann Transl Med. 2021 Mar;9(5):384. doi: 10.21037/atm-20-4282. Ann Transl Med. 2021. PMID: 33842605 Free PMC article.
-
Isolation of quiescent human pancreatic stellate cells: a promising in vitro tool for studies of human pancreatic stellate cell biology.Pancreatology. 2010;10(4):434-43. doi: 10.1159/000260900. Epub 2010 Aug 20. Pancreatology. 2010. PMID: 20733342
-
Antifibrogenic effects of vitamin D derivatives on mouse pancreatic stellate cells.World J Gastroenterol. 2018 Jan 14;24(2):170-178. doi: 10.3748/wjg.v24.i2.170. World J Gastroenterol. 2018. PMID: 29375203 Free PMC article.
-
Signal transduction in pancreatic stellate cells.J Gastroenterol. 2009;44(4):249-60. doi: 10.1007/s00535-009-0013-2. Epub 2009 Mar 7. J Gastroenterol. 2009. PMID: 19271115 Review.
-
Pancreatic stellate cell: Pandora's box for pancreatic disease biology.World J Gastroenterol. 2017 Jan 21;23(3):382-405. doi: 10.3748/wjg.v23.i3.382. World J Gastroenterol. 2017. PMID: 28210075 Free PMC article. Review.
Cited by
-
Bone Marrow Mesenchymal Stem Cells Can Prevent Pancreatic Fibrosis in Mice with Chronic Pancreatitis by Inhibiting the Activation of Pancreatic Stellate Cells.J Inflamm Res. 2025 Aug 14;18:11041-11053. doi: 10.2147/JIR.S534110. eCollection 2025. J Inflamm Res. 2025. PMID: 40831517 Free PMC article.
References
LinkOut - more resources
Full Text Sources
Miscellaneous

