. 2025 Apr 28;14(9):644.
doi: 10.3390/cells14090644.

Nardostachys jatamansi Extract and Nardosinone Exert Neuroprotective Effects by Suppressing Glucose Metabolic Reprogramming and Modulating T Cell Infiltration

Affiliations

Nardostachys jatamansi Extract and Nardosinone Exert Neuroprotective Effects by Suppressing Glucose Metabolic Reprogramming and Modulating T Cell Infiltration

Congyan Duan et al. Cells. .

Abstract

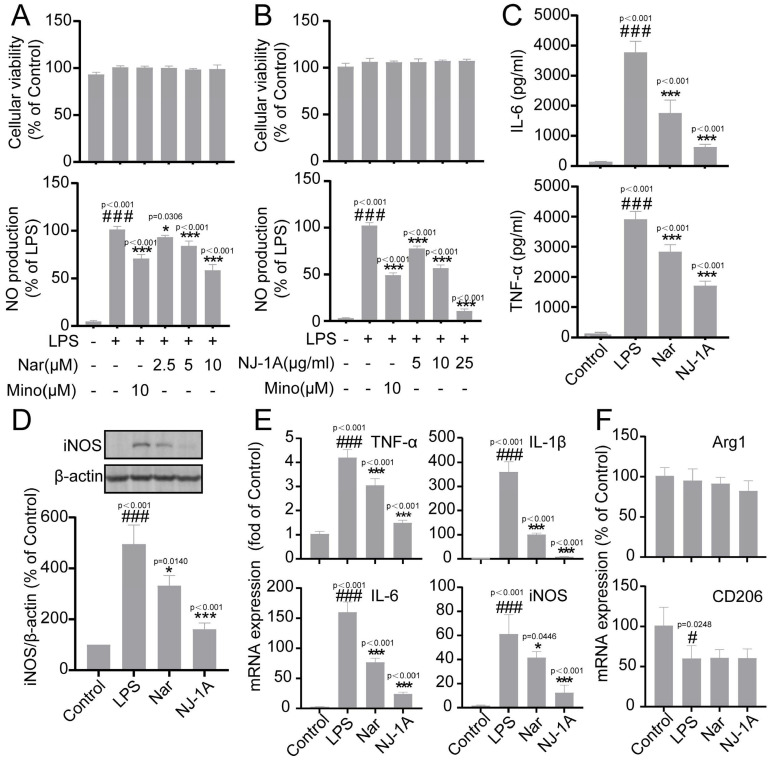
Background: Nardostachys jatamansi DC. (Gansong), a widely utilized herb in traditional Chinese medicine, has been historically employed in the management of various neuropsychiatric disorders. Nardosinone (Nar), a sesquiterpenoid compound, has been identified as one of the principal bioactive constituents of N. jatamansi. This study investigated the effects of ethyl acetate extract (NJ-1A) from N. jatamansi and its active constituent nardosinone on neuroinflammatory mediator release, glucose metabolic reprogramming, and T cell migration using both in vitro and in vivo experimental models.

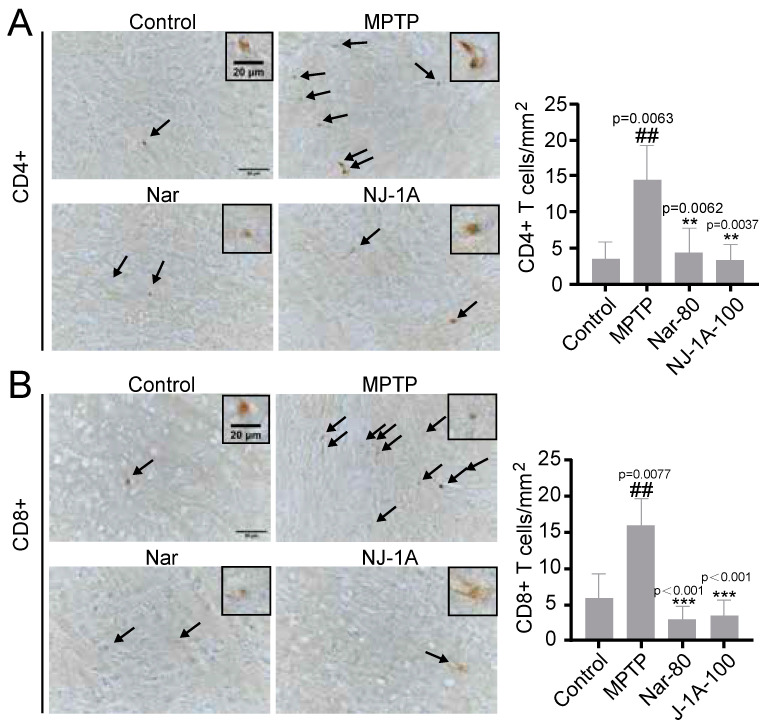
Methods: Lipopolysaccharide(LPS)-induced BV-2 microglial cells and a 1-methyl-4-phenyl-1,2,3,6-tetrahydropyridine/probenecid (MPTP/p)-induced male C57BL/6N mouse chronic model of Parkinson's disease were applied.

Results: Both NJ-1A and Nar could significantly suppress LPS-induced production of M1 pro-inflammatory factors or markers in microglia and could inhibit the glycolytic process and promote oxidative phosphorylation via the AKT/mTOR signaling pathway. Furthermore, they exhibited the capacity to attenuate chemokine release from activated microglia, consequently reducing T cell migration. In vivo experiments revealed that NJ-1A and Nar effectively inhibited microglial activation, diminished T cell infiltration, and mitigated the loss of tyrosine hydroxylase (TH)-positive dopaminergic neurons in the substantia nigra of MPTP-induced mice.

Conclusions: NJ-1A and nardosinone exert neuroprotective effects through the modulation of microglial polarization states, regulation of metabolic reprogramming, and suppression of T cell infiltration.

Keywords: Nardostachys jatamansi; Parkinson’s disease; T cell infiltration; metabolic reprogramming; microglia; nardosinone; neuroinflammation.


Conflict of interest statement

The authors declare no conflicts of interest.

Figures

Figure 1
Figure 1
Nar is the main component of NJ-1A. Analysis by high-performance liquid chromatography (HPLC) reveals that Nar is the predominant component of NJ-1A, accounting for approximately 10.2% based on the relative peak area. The chromatographic method and the other compounds identified in NJ-1A are shown in File S1.
Figure 2
Figure 2
NJ-1A and Nar can inhibit the production of pro-inflammatory factors in microglia induced by LPS. (AC) NJ-1A and Nar can inhibit the production of NO, IL-6, and TNF-α in LPS-induced BV-2 cells without affecting cell viability, n = 5; (D) NJ-1A and Nar can inhibit the expression of iNOS protein, n = 3; (E,F) NJ-1A and Nar can inhibit the mRNA expression of pro-inflammatory factors but do not inhibit the mRNA expression of anti-inflammatory cytokines, n = 4. Data represent the mean ± SD; vs. Control, # p < 0.05, ### p < 0.001; vs. LPS, * p < 0.05, *** p < 0.001. NJ-1A: Ethyl acetate extract of N. jatamansi, Nar: nardosinone, LPS: Lipopolysaccharide, MINO: Minocycline.
Figure 3
Figure 3
NJ-1A and Nar can inhibit the generation of ROS in BV-2 cells induced by LPS. (A,B) After BV-2 cells were stimulated with LPS for 24 h, the content of ROS inside the cells was detected by flow cytometry, n = 4. (C) Fluorescence microscopic images of BV-2 cells treated with LPS and/or NJ-1A and Nar after incubation with DCFH probe for 24 h. Data represent the mean ± SD; vs. Control, # p < 0.05; vs. LPS, ** p < 0.01, *** p < 0.001.
Figure 4
Figure 4
NJ-1A and Nar can inhibit the phosphorylation levels of IκB-α and NF-κB p65 in BV-2 cells after LPS stimulation. (A,B) The results of Western blot showed that NJ-1A and Nar could inhibit the phosphorylation of IκB-α and NF-κB p65, n = 4. (C) The results of fluorescence microscopy of the cells showed that NJ-1A and Nar could inhibit the phosphorylation of NF-κB p65. Data represent the mean ± SD; vs. Control, ### p < 0.001; vs. LPS, * p < 0.05, ** p < 0.01, *** p < 0.001.
Figure 5
Figure 5
NJ-1A and Nar can reverse the glucose metabolic reprogramming of LPS-induced BV-2 cells. (A,C) NJ-1A and Nar can inhibit the increase of ECAR in BV-2 cells, n = 5, (B,D) and can reverse the decrease of OCR in BV-2 cells, n = 4. (E) NJ-1A and Nar inhibited the mRNA expression of key glycolytic enzymes, n = 4. Data represent the mean ± SD; vs. Control, # p < 0.05, ## p < 0.01; vs. LPS, * p < 0.05, ** p < 0.01, *** p < 0.001.
Figure 6
Figure 6
NJ-1A and Nar can inhibit the production of chemokines and the migration of T lymphocyte line CTLL-2. (A) The results of the chemokine protein chip showed that NJ-1A and Nar could inhibit the secretion of several chemokines. (B) NJ-1A and Nar inhibited the mRNA expression of CXCL10, CCL2, CCL12, and CCL5 chemokines, n = 4. (C) Schematic diagram of the Transwell experiment. (D) The results of flow cytometry showed that NJ-1A and Nar could inhibit the migration of CTLL-2 cells, n = 3. (E) RT-PCR results showed that CTLL-2 cells expressed CXCR3 and CCR5. Data represent the mean ± SD; vs. Control, # p < 0.05, ## p < 0.01, ### p < 0.001; vs. LPS, * p < 0.05, ** p < 0.01, *** p < 0.001.
Figure 7
Figure 7
NJ-1A and Nar could inhibit the expression of MHCII in BV-2 cells induced by LPS, n = 4. Data represent the mean ± SD; vs. Control, ### p < 0.001; vs. LPS, ** p < 0.01.
Figure 8
Figure 8
NJ-1A and Nar inhibit the secretion of chemokines and inflammatory factors in activated BV-2 cells through the AKT/mTOR signaling pathway. (AC) NJ-1A and Nar inhibited the phosphorylation of AKT and mTOR, n = 3. (D,E) The mTOR agonist MHY1485 abolished the inhibitory effects of NJ-1A and Nar on NO, CCL5, and CXCL10, n = 5. (F) The mTOR agonist MHY1485 eliminated the effect of NJ-1A and Nar on the phosphorylation of mTOR, n = 3. Data represent the mean ± SD; vs. Control, # p < 0.05, ## p < 0.01, ### p < 0.001; vs. LPS, * p < 0.05, ** p < 0.01, *** p < 0.001, & p < 0.05, && p < 0.01, &&& p < 0.001.
Figure 9
Figure 9
NJ-1A and Nar can ameliorate the damage of dopaminergic neurons in the MPTP-induced mouse model of Parkinson’s disease. (A) In vivo experimental flow chart. (B) The weight gain of mice at the end of the experiment, n = 10. (C,D) Western blot results showed that NJ-1A and Nar can reverse the reduction of TH expression in the ventral midbrain of the mouse model of Parkinson’s disease, n = 4. (EG) Immunohistochemistry results showed that NJ-1A and Nar can reverse the reduction of TH-positive cells in the substantia nigra and striatum of the mouse model of Parkinson’s disease, n = 4. (40x magnification) (H) The rotarod test. Data represent the mean ± SD; vs. Control, ## p < 0.01, ### p < 0.001; vs. MPTP, * p < 0.05, ** p < 0.01.
Figure 10
Figure 10
NJ-1A and Nar can inhibit the activation of microglia in the brains of mice in models of Parkinson’s disease induced by MPTP. (AC) Western blot results showed that NJ-1A and Nar can inhibit the expression of activated microglial markers IBA-1, iNOS, and MHCII in the ventral midbrain, n = 4; (D,E) Immunofluorescence results demonstrated that NJ-1A and Nar can suppress the expression of the activated microglial marker Iba1 in the substantia nigra and striatum, n = 4. Data represent the mean ± SD; vs. Control, # p < 0.05, ## p < 0.01, ### p < 0.001; vs. MPTP, * p < 0.05, ** p < 0.01. Scale bar, 100 μm.
Figure 11
Figure 11
NJ-1A and Nar can reduce the number of CD4+ T (A) and CD8+ T (B) cells in the substantia nigra, n = 4. The black arrows indicate the positive cells, and the frames indicate the magnified positive cells. Data represent the mean ± SD; vs. Control, ## p < 0.01; vs. MPTP, ** p < 0.01, *** p < 0.001.

Similar articles

References

    1. Merighi S., Nigro M., Travagli A., Gessi S. Microglia and Alzheimer’s Disease. Int. J. Mol. Sci. 2022;23:12990. doi: 10.3390/ijms232112990. - DOI - PMC - PubMed
    1. Guo S., Wang H., Yin Y. Microglia Polarization from M1 to M2 in Neurodegenerative Diseases. Front. Aging Neurosci. 2022;14:815347. doi: 10.3389/fnagi.2022.815347. - DOI - PMC - PubMed
    1. Mehla K., Singh P.K. Metabolic Regulation of Macrophage Polarization in Cancer. Trends Cancer. 2019;5:822–834. doi: 10.1016/j.trecan.2019.10.007. - DOI - PMC - PubMed
    1. Yang S., Qin C., Hu Z.W., Zhou L.Q., Yu H.H., Chen M., Bosco D.B., Wang W., Wu L.J., Tian D.S. Microglia reprogram metabolic profiles for phenotype and function changes in central nervous system. Neurobiol. Dis. 2021;152:105290. doi: 10.1016/j.nbd.2021.105290. - DOI - PubMed
    1. Takeda H., Yamaguchi T., Yano H., Tanaka J. Microglial metabolic disturbances and neuroinflammation in cerebral infarction. J. Pharmacol. Sci. 2021;145:130–139. doi: 10.1016/j.jphs.2020.11.007. - DOI - PubMed

Publication types

LinkOut - more resources