. 2025 Apr 28;14(9):645.
doi: 10.3390/cells14090645.

ATIP1 Is a Suppressor of Cardiac Hypertrophy and Modulates AT2-Dependent Signaling in Cardiac Myocytes

Affiliations

ATIP1 Is a Suppressor of Cardiac Hypertrophy and Modulates AT2-Dependent Signaling in Cardiac Myocytes

Tobias Fischer et al. Cells. .

Abstract

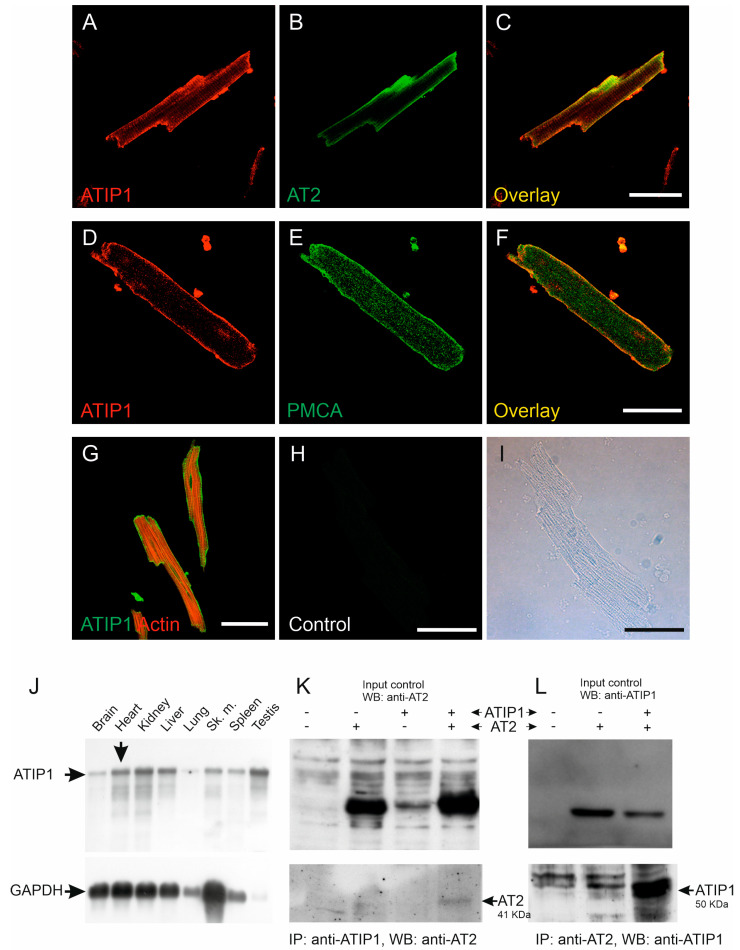
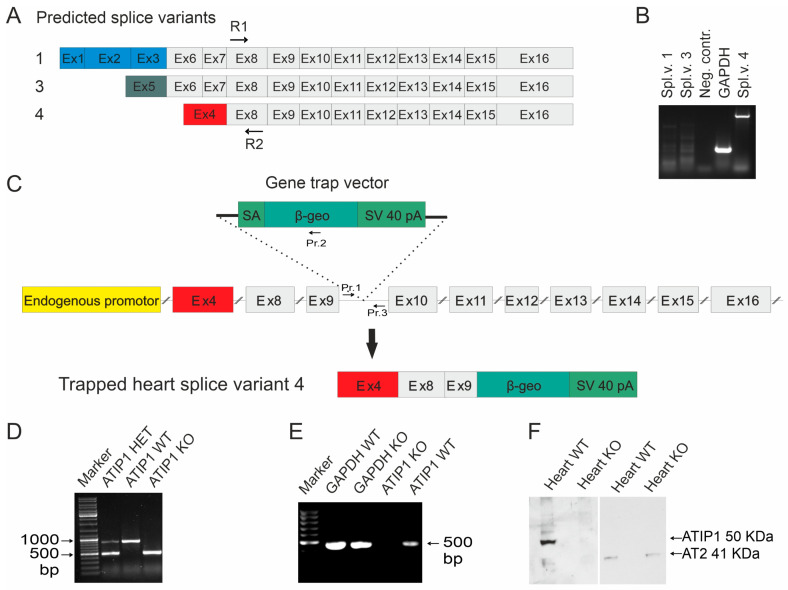
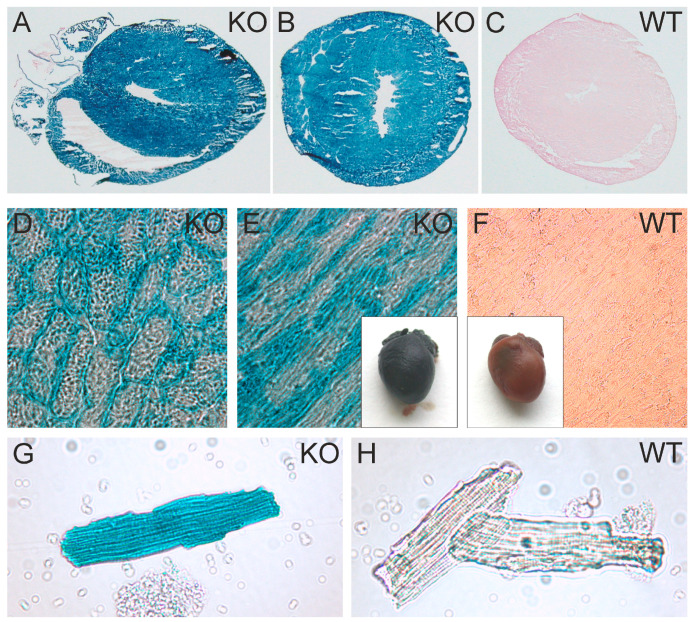
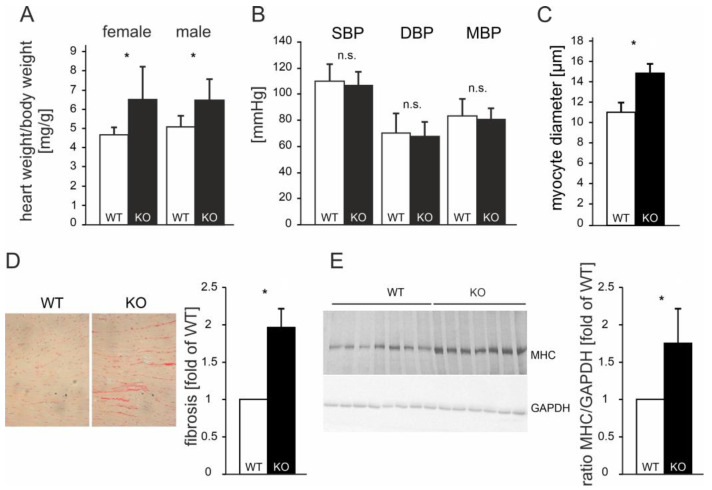
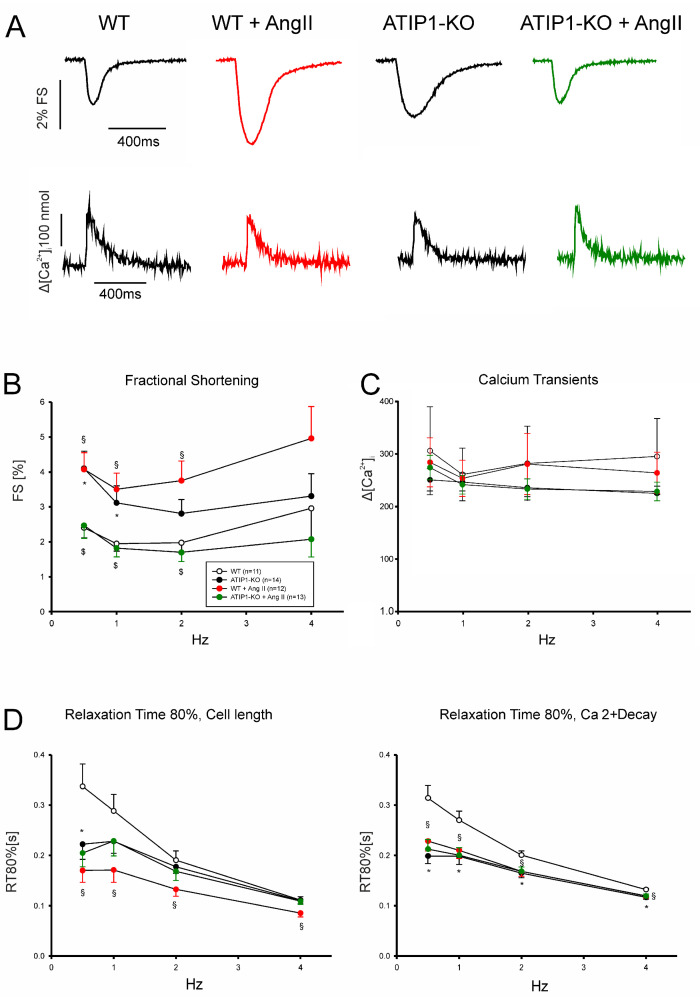
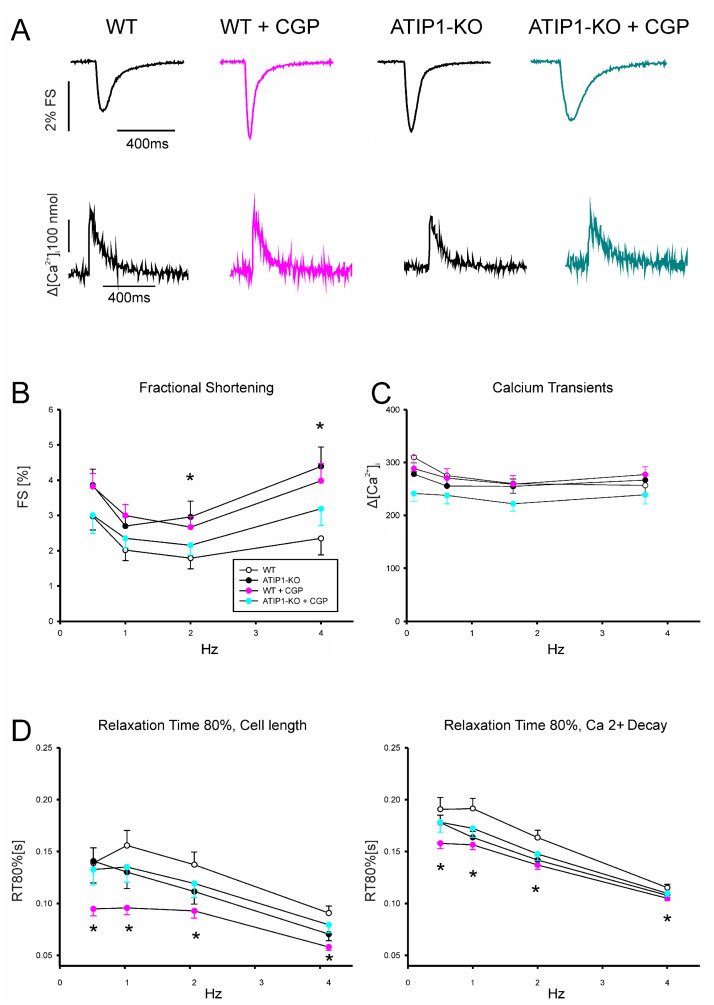
So far, the molecular functions of the angiotensin-type-2 receptor (AT2) interacting protein (ATIP1) have remained unclear, although expression studies have revealed high levels of ATIP1 in the heart. To unravel its physiological function, we investigated ATIP1-KO mice. They develop a spontaneous cardiac hypertrophy with a significantly increased heart/bodyweight ratio, enlarged cardiomyocyte diameters, and augmented myocardial fibrosis. Hemodynamic measurements revealed an increased ejection fraction (EF) in untreated ATIP1-KO mice, and reduced end-systolic and end-diastolic volumes (ESV and EDV), which, in sum, reflect a compensated concentric cardiac hypertrophy. Importantly, no significant differences in blood pressure (BP) were observed. Chronic angiotensin II (AngII) infusion resulted in increases in BP and EF in ATIP1-KO and WT mice. Reductions in ESV and EDV occurred in both ATIP1-KO and WT but to a lesser extent in ATIP1-KOs. Isolated cardiomyocytes exhibited a significantly increased contractility in ATIP1-KO and accelerated Ca2+ decay. AngII treatment resulted in increased fractional shortening in WT but decreased shortening in ATIP1-KO, accompanied by accelerated cell relaxation in WT but absent effects on relaxation in ATIP1-KO cells. The AT2 agonist CGP42112A increased shortening in WT cardiomyocytes but, again, did not affect shortening in ATIP1-KO cells. Relaxation was accelerated by CGP42112A in WT but was unaffected in ATIP1-KO cells. We show that ATIP1 deficiency results in spontaneous cardiac hypertrophy in vivo and that ATIP1 is a downstream signal in the AT2 pathway regulating cell contractility. We hypothesize that the latter effect is because of a disinhibition of the AT1 pathway by impaired AT2 signaling.

Keywords: ATIP1; MTUS1; angiotensin-type-2 receptor; cardiac hypertrophy; knockout mice.


Conflict of interest statement

The authors declare no conflicts of interest.

Figures

Figure 1
Figure 1
Expression and localization of ATIP1 in the heart. Localization of ATIP1 at the plasma membrane of isolated cardiomyocytes (AF), supported by co-localization with AT2 (B,C) and the plasma membrane’s Ca2+ ATPase, PMCA (E,F) and not with actin (G). (H,I) Antibody controls; bars: 50 μm. (J) Expression of ATIP1 in different tissues, detected using northern blotting (BALB/c male mouse, mRNA). In addition to the observed expression in the heart, ATIP1 transcripts were also detected in other tissues, e.g., the kidneys, liver, and testes. (K,L) Lysates of HEK293 cells, which were single- and double-transfected with ATIP1 and AT2 expression constructs, were immunoprecipitated (IP) with antibodies against ATIP1 (K) or AT2 (L), and the precipitated material was analyzed using western blotting (WB) with antibodies against AT2 (K) and ATIP1 (L).
Figure 2
Figure 2
Gene disruption. (A) Predicted ATIP1 splice variants and the cloning of heart-specific murine splice variant 4 by RACE-PCR with gene-specific primers R1 and R2 located within common exon 8. Additionally, RT-PCRs for full-length splice variants detected only splice variant 4 but neither variant 1 nor variant 3 in the heart (B). (C) Insertion of the gene trap vector into the Atip1 gene. The gene trap vector was integrated after the third exon of heart-specific splice variant 4. It contains a splice acceptor (SA), a reporter gene (β-geo), and an SV40 polyadenylation signal. The insertion of the gene trap vector results in artificially spliced fusion transcripts of upstream exons and the β-geo reporter gene (C). The primers (Pr. 1, Pr. 2, and Pr. 3) used for genotyping are shown in (C). Genotyping by PCR using primers 1 and 2 for the KO PCR and primers 1 and 3 for the WT PCR. PCR products are 500 bp for KO and 900 bp for WT alleles, respectively (D). (E) RT-PCR with heart RNA of KO and WT mice verified the knockout at the RNA level. (F) Western blots revealed a complete loss of ATIP1 in the hearts of the ATIP1-KO animals, whereas the AT2 expression remained unchanged.
Figure 3
Figure 3
ATIP1 gene promoter activity in the heart and in isolated cardiomyocytes. Intensive X-Gal staining in ATIP1-KO hearts (E), cross (B,D) and longitudinal (A,E) cryosections, and in isolated cardiomyocytes (G) compared to those in WT (C,F,H), which were indicative of strong ATIP1 gene promoter activity in cardiomyocytes.
Figure 4
Figure 4
Cardiac hypertrophy in ATIP1-KO mice was not caused by hypertension. The ATIP1-knockout mice spontaneously developed cardiac hypertrophy, as reflected by a significantly increased heart-to-bodyweight ratio from 4.7 mg/g in WT mice to 6.4 mg/g in KO animals (n = 20, * p < 0.005, (A)) in the presence of an unchanged systemic blood pressure (n = 25, n.s., (B)). The hypertrophy was characterized by enlarged diameters of cardiac myocytes, as estimated using quantitative morphometry of PAS-stained left ventricular myocardial sections (n = 100 cells in each group, in sections of 12 mice in each group, * p = 2.6 × 10⁻⁵, (C)). (D) Relative myocardial fibrosis assessed using picrosirius red staining for collagen was also significantly increased in KO animals, as compared to WT controls (n = 12 mice in each group, * p = 0.028). (E) Exemplary myosin-heavy-chain (MHC) expression in KO mice as compared to WT controls (left panel) and the quantification of the MHC-to-GAPDH ratio (right panel, n = 12 mice of each genotype, * p < 0.05); n.s., not significant.
Figure 5
Figure 5
Functional measurements of isolated ventricular cardiomyocytes. (A) Exemplary original recordings of fractional cell shortening (upper panels) and Ca2+ transient (lower panels) measurements under basal conditions (at 1 Hz) and after treatment with AngII. (B) The force–frequency relationship of fractional shortening. Cells from ATIP1-KO (n = 14), WT (n = 11), and ATIP1-KO treated with AngII (n = 13) and WT plus AngII (n = 12) mice; §: p < 0.05 for WT vs. WT + AngII; $: p < 0.05 for ATIP1-KO vs. ATIP1-KO + AngII; and (C) Ca2+ transient amplitude. (D) Relaxation is measured as the cell length relaxation to 80% of the resting cell length and Ca2+ decline; §: p < 0.05 for WT vs. WT + AngII; *: p < 0.05 WT + AngII vs. KO + AngII.
Figure 6
Figure 6
(A) Original recordings of fractional cell shortening (upper panels) and Ca2+ transient (lower panels) measurements under basal conditions and after treatment with AT2 agonist CGP. (B) The force–frequency relationship for fractional shortening. Cells from ATIP1-KO (n = 9), WT (n = 7), ATIP1-KO treated with CGP (n = 8), and WT plus CGP (n = 7) mice and (C) Ca2+ transient amplitude. (D) Relaxation is measured as the cell length relaxation to 80% of the resting cell length and Ca2+ decline; * p < 0.05 for WT vs. WT + CGP.
Figure 7
Figure 7
(A) Exemplary western blots showing no differences in phospho-ERK or ERK expressions in the hearts of untreated (basal) KO mice as compared to those in the hearts of untreated WT mice. (B) Western blots using heart lysates of untreated WT and KO mice. P-PLB, anti-phopho-phospholamban; PLB, phospholamban; CaMKII, Ca2+/calmodulin-dependent protein kinase II; P-Tn I, phospho-troponin I; Tn I, troponin I. Statistically significant differences were detected for the ratio of P-PLB/PLB (* p < 0.05; n = 24 mice in each group), all the other ratios were not changed between WT and KO basal mice as compared to GAPDH (n = 12 mice in each group). (C) Exemplary western blots showing ATIP1 expressions in WT heart lysates, either untreated or after chronic AngII administration in relation to GAPDH. The quantification of further blots revealed a decrease in ATIP1 expression to about 20% of the levels expressed in untreated WT mice (n = 12 mice in each group, * p < 0.05). (D) Western blot analysis revealed a significant increase in ERK phosphorylation in the hearts of ATIP1-KO animals after two weeks of chronic AngII infusion (n = 12 mice in each group, * p < 0.05). (E) Relative protein expressions of SERCA2a, PLB, voltage-gated Ca2+ channel (Cav1.2), and CaMKII. All the signals were normalized to cardiac alpha-actin, WT expression levels were set at a value of “1”, and KO signals are shown in relation to the WT value (n = 12 mice in each group, * p < 0.05).

Similar articles

References

    1. de Gasparo M., Catt K.J., Inagami T., Wright J.W., Unger T. International union of pharmacology. Xxiii. The angiotensin ii receptors. Pharmacol. Rev. 2000;52:415–472. - PubMed
    1. Kaschina E., Unger T. Angiotensin at1/at2 receptors: Regulation, signalling and function. Blood Press. 2003;12:70–88. doi: 10.1080/08037050310001057. - DOI - PubMed
    1. Lindberg H., Nielsen D., Jensen B.V., Eriksen J., Skovsgaard T. Angiotensin converting enzyme inhibitors for cancer treatment? Acta Oncol. 2004;43:142–152. - PubMed
    1. Levy B.I. Can angiotensin ii type 2 receptors have deleterious effects in cardiovascular disease? Implications for therapeutic blockade of the renin-angiotensin system. Circulation. 2004;109:8–13. doi: 10.1161/01.CIR.0000096609.73772.C5. - DOI - PubMed
    1. Widdop R.E., Jones E.S., Hannan R.E., Gaspari T.A. Angiotensin at2 receptors: Cardiovascular hope or hype? Br. J. Pharmacol. 2003;140:809–824. doi: 10.1038/sj.bjp.0705448. - DOI - PMC - PubMed

Publication types

LinkOut - more resources