. 2025 Apr 28;14(9):646.
doi: 10.3390/cells14090646.

Isolation and Characterization of Mouse Choroidal Melanocytes and Their Proinflammatory Characteristics

Affiliations

Isolation and Characterization of Mouse Choroidal Melanocytes and Their Proinflammatory Characteristics

Yong-Seok Song et al. Cells. .

Abstract

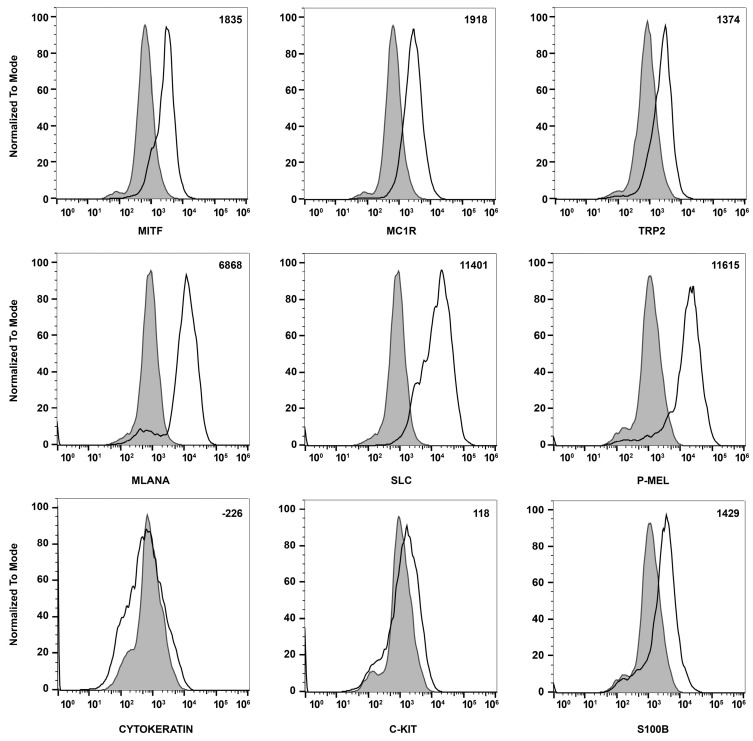
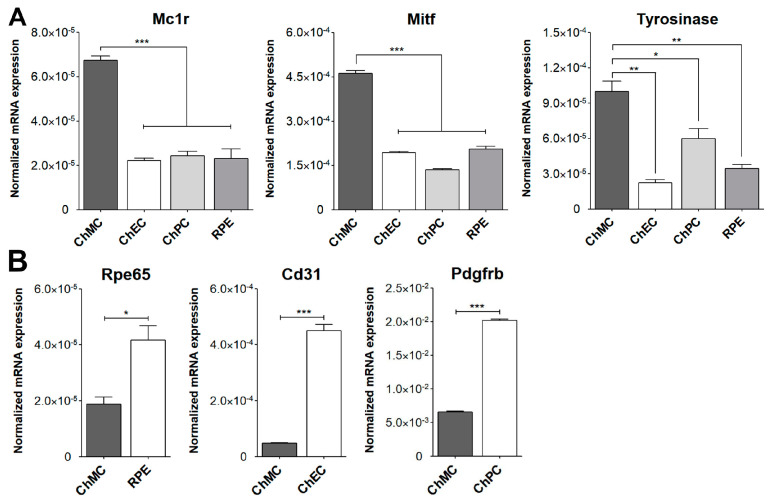
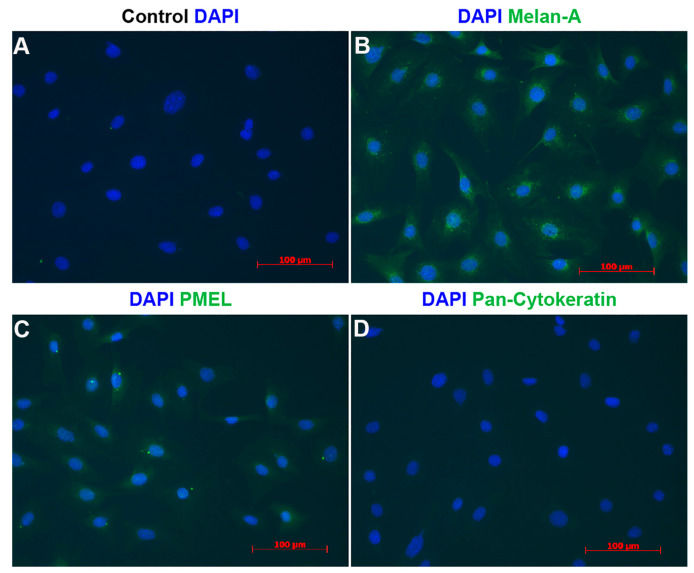
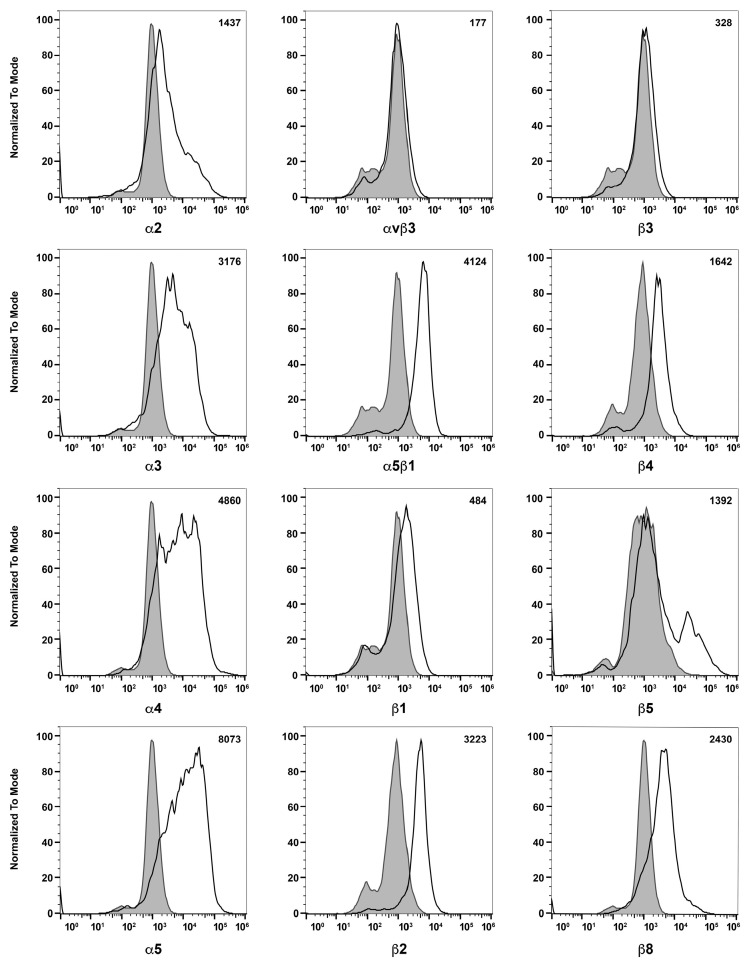
Melanocytes are a major cellular component of the choroid which aids in the maintenance of choroidal integrity and vision. Unfortunately, our knowledge regarding the cell autonomous melanocyte function, in preserving choroidal health and the ocular pathologies associated with choroidal dysfunction, remain largely unknown. The ability to culture melanocytes has advanced our knowledge regarding the origin and function of these cells in choroidal homeostasis and vision. However, the culture of murine choroid melanocytes has not been previously reported. Here, we describe a method for the isolation of melanocytes from the mouse choroid, as well as the delineation of many of their cellular characteristics, including the expression of various cell-specific markers, cell adhesion molecules, melanogenic capacity, and inflammatory responses to various extracellular stressors. Unraveling the molecular mechanisms that regulate melanocyte functions will advance our understanding of their role in choroidal homeostasis and how alterations in these functions impact ocular diseases that compromise vision.

Keywords: VEGF receptors; age-related macular degeneration; c-Kit; cell adhesion molecules; choroid; inflammation; integrins; stem cell factor.


Conflict of interest statement

The authors declare no conflicts of interest.

Figures

Figure 1
Figure 1
Morphology and melanization of mouse choroidal melanocytes in culture. Choroidal melanocytes from Immortomice were cultured on uncoated plates. The cells, which have a morphology like melanocytes from previous studies, were photographed shortly after isolation (P0) and after each passage up to the third passage (P1, P2, and P3, respectively) in digital format using a Nikon microscope using a 4× or 10× objective (final magnification: top panels ×40, bottom panels ×100). The number of cells containing melanin decreases with each successive passage, as has been previously observed by others culturing melanocytes.
Figure 2
Figure 2
Morphological comparison of mouse choroidal melanocytes (ChMCs), choroidal endothelial cells (ChECs), and retinal pigmented epithelium (RPE) cells in culture. Actively growing early-passage (P7) cultures of ChMC, ChEC, and RPE cells were photographed using a Nikon phase microscope in digital format using a 4× or 10× objective (final magnification: top panels ×40, bottom panels ×100). ChMC had longer, spindly processes in comparison to the other two cell types.
Figure 3
Figure 3
Expression of melanocyte markers in ChMC. Mouse ChMC were examined for expression of Mitf, Mc1r, Trp2, Mlana, Slc, P-Mel, Pan Cytokeratin (RPE marker), c-Kit, and S100β using flow cytometry. The shaded areas show staining in the absence of primary antibody (secondary control), and the unshaded peaks show staining with primary antibody. The difference between the geometric means of primary antibody-stained cells and secondary antibody-stained control cells can be found in the top right corner of each graph. These experiments were performed at least 2 times with 3 different isolations of ChMC with similar results.
Figure 4
Figure 4
Expression of ChMC, ChEC, ChPC, and RPE cell-specific markers. RNA was prepared from various cell types, and the expression level of desired markers were assessed using RT-qPCR. (A) Expression of melanocyte markers and (B) expression of other cell-specific markers including Rpe65 (RPE cells), Cd31 (ChEC), and Pdgfrb (ChPC). Please note the specific expression of melanocyte markers in ChMC, while the expression of other cell type markers was negligible in ChMC. These experiments were repeated with three isolations of each cell type with similar results. (*** p < 0.001, ** p < 0.01, and * p < 0.05; n = 3; (A) one-way ANOVA with Tukey’s multiple-comparison test, (B) two-tailed t-test).
Figure 5
Figure 5
Indirect immunofluorescence staining of melanocytes. Cells were prepared and stained using DAPI (A), Melan-A (B), Pmel (C), and pan-Cytokeratin (D) antibodies as detailed in Section 2. DAPI was used to stain nuclei of the cells. Scale bars = 100 μm. Please note specific staining of the majority of cells with Melan-A (B) and Pmel (C), and lack of staining for pan-Cytokeratin (D). This experiment was repeated with 3 isolations of ChMC with similar results.
Figure 6
Figure 6
Expression of integrins in choroidal melanocytes in culture. The expression of α2, α3, α4, α5, αVβ3, α5β1, β1, β2, β3, β4, β5, and β8 integrins was determined using flow cytometry, as described in Section 2. The shaded areas show staining in the absence of primary antibody (secondary control), and the unshaded areas show staining with primary antibody. The difference between the geometric means of primary antibody-stained cells and secondary antibody control-stained cells can be found in the upper right corner of each graph. These experiments were repeated with two isolations of ChMC with similar results. Please note that α and β integrins were expressed at significant levels with the exception of β3 and αvβ3 integrins.
Figure 7
Figure 7
Expression of other cell adhesion and growth factor receptors. The expressions of VEGF-R1, VEGF-R2, ICAM-1, ICAM-2, and VCAM-1 were determined using flow cytometry, as described in Section 2. The shaded areas show staining in the absence of primary antibody (secondary control), and the unshaded areas show staining with specific primary antibody. The difference between the geometric means of primary antibody-stained cells and secondary antibody control-stained cells can be found in the upper right corner of each graph. These experiments were repeated with two isolations of ChMC with similar results.
Figure 8
Figure 8
Immunostaining of the melanocytes in the choroidoscleral complex. Choroid/RPE wholemounts were prepared from 8-week-old FVB/NJ mice and stained with specific antibodies as detailed in the Section 2. Melanocytes positive for S100β ((B); red) and MITF ((C), cyan or white) were detected in the choroidoscleral complex. A low magnification of wholemount double staining is shown in (A). Higher magnification of double staining is shown in (D). Images were captured using Nikon A1 confocal microscope and processed using NIS-Elements Software. Scale bar = 50 µm. These experiments were repeated with eyes from at least 5 mice with similar results.
Figure 9
Figure 9
Evaluation of ChMC for melanogenesis through activation of Mc1r. ChMC were incubated with Mc1r agonist BMS 470,539 for 72 h. Following incubation, total RNA was prepared and subjected to RT-qPCR analysis using specific primers (Table 1) for melanogenic genes including Mc1r (A), Pmel (B), tyrosinase (C), and Mitf (D) as detailed in Section 2. Please note significant up-regulation of these genes in ChMC incubated with the Mc1r agonist compared with control (vehicle). These experiments were repeated with two isolations of ChMC. (*** p < 0.001; n = 3; two-tailed t-test).
Figure 10
Figure 10
Expression of Stem cell factor (Scf) and its receptor (c-Kit) in ChMC. Total RNA was isolated from actively growing ChMC, as well as ChEC, ChPC, RPE, Microglia, REC (retinal EC), and BMMC (bone-marrow-derived mast cells). (A) The expression of Scf and (B) c-Kit was determined by RT-qPCR analysis using specific primers (Table 1). Please note the significant expression of Scf and lower expression of c-Kit in ChMC compared to the other cell types examined. This experiment was repeated with two different isolations of these cells. We also similarly examined the expression of Cfh (complement factor h; (C)) and Htra1 (high-temperature requirement a1; (D) in these cells. Please note significant expression of Cfh and lower expression of Htra1 in ChMC compared to other cell types examined here.
Figure 11
Figure 11
Inflammatory responses of ChMC to various stressors. (A) Dose response curve for ChMC incubated with various concentrations of NaIO3, Bz-ATP (ATP analog), and NECA (adenosine analog) for 24 h. Cell viability was assessed as detailed in Section 2. The dashed line shows the corresponding 50% viability dose. Please note sensitivity of ChMC to NaIO3 and Bz-ATP and lack thereof with adenosine. (B) Expression of ATP receptor (P2rx7), and adenosine receptors (Adora1, Adora2a, Adora2b, and Adora3) were examined by RT-qPCR using RNA from indicated cell types and specific primers (Table 1). Please note the expression of P2rx7 was lower in ChMC compared to other cell types, with the highest in ChEC. ChMC expressed lower levels of Adora1, Adora2a, and Adora3, but expressed relatively higher levels of Adora2b. Adora1 was the highest in microglia and ChPC. ChEC expressed the highest level of Adora2a, while Adora2b was higher in ChEC and ChPC, and Adora3 was highest in microglia followed by REC. (C) Expression of inflammatory mediators in ChMC incubated with NaIO3 (0, 100, and 500 µM) and Bz-ATP (0, 50, 200, and 500 µM) for 24 and assessed by RT-qPCR analysis using specific primer. Il-1b, Tnf, and Nos2 level only increased with 500 µM Bz-ATP, with NaIO3 having no effect. Il-6, Mcp1, Tgfb1, and Thbs1 levels decreased by both NaIO3 and Bz-ATP. NaIO3 did not increase the expression of any of the examined inflammatory mediators. Both NaIO3 and Bz-ATP reduced Adora2b, but only Bz-ATP stimulated Adora3 expression in ChMC. (D) Expression of inflammatory mediators in ChMC incubated with NECA 100 µM for 24 h. RNA was isolated and used for RT-qPCR analysis of gene expression using specific primers (Table 1). NECA only increased IL-6 expression without a significant effect on the expression of other mediators examined here. Con (Vehicle control). (*** p < 0.001, ** p < 0.01, * p < 0.05; n = 3; (C) one-way ANOVA with Tukey’s multiple-comparison test, (D) two-tailed t-test).
Figure 11
Figure 11
Inflammatory responses of ChMC to various stressors. (A) Dose response curve for ChMC incubated with various concentrations of NaIO3, Bz-ATP (ATP analog), and NECA (adenosine analog) for 24 h. Cell viability was assessed as detailed in Section 2. The dashed line shows the corresponding 50% viability dose. Please note sensitivity of ChMC to NaIO3 and Bz-ATP and lack thereof with adenosine. (B) Expression of ATP receptor (P2rx7), and adenosine receptors (Adora1, Adora2a, Adora2b, and Adora3) were examined by RT-qPCR using RNA from indicated cell types and specific primers (Table 1). Please note the expression of P2rx7 was lower in ChMC compared to other cell types, with the highest in ChEC. ChMC expressed lower levels of Adora1, Adora2a, and Adora3, but expressed relatively higher levels of Adora2b. Adora1 was the highest in microglia and ChPC. ChEC expressed the highest level of Adora2a, while Adora2b was higher in ChEC and ChPC, and Adora3 was highest in microglia followed by REC. (C) Expression of inflammatory mediators in ChMC incubated with NaIO3 (0, 100, and 500 µM) and Bz-ATP (0, 50, 200, and 500 µM) for 24 and assessed by RT-qPCR analysis using specific primer. Il-1b, Tnf, and Nos2 level only increased with 500 µM Bz-ATP, with NaIO3 having no effect. Il-6, Mcp1, Tgfb1, and Thbs1 levels decreased by both NaIO3 and Bz-ATP. NaIO3 did not increase the expression of any of the examined inflammatory mediators. Both NaIO3 and Bz-ATP reduced Adora2b, but only Bz-ATP stimulated Adora3 expression in ChMC. (D) Expression of inflammatory mediators in ChMC incubated with NECA 100 µM for 24 h. RNA was isolated and used for RT-qPCR analysis of gene expression using specific primers (Table 1). NECA only increased IL-6 expression without a significant effect on the expression of other mediators examined here. Con (Vehicle control). (*** p < 0.001, ** p < 0.01, * p < 0.05; n = 3; (C) one-way ANOVA with Tukey’s multiple-comparison test, (D) two-tailed t-test).

Similar articles

References

    1. Shibuya H., Watanabe R., Maeno A., Ichimura K., Tamura M., Wakana S., Shiroishi T., Ohba K., Takeda K., Tomita H., et al. Melanocytes contribute to the vasculature of the choroid. Genes Genet. Syst. 2018;93:51–58. doi: 10.1266/ggs.17-00058. - DOI - PubMed
    1. Adameyko I., Lallemend F., Furlan A., Zinin N., Aranda S., Kitambi S.S., Blanchart A., Favaro R., Nicolis S., Lübke M., et al. Sox2 and mitf cross-regulatory interactions consolidate progenitor and melanocyte lineages in the cranial neural crest. Development. 2012;139:397–410. doi: 10.1242/dev.065581. - DOI - PMC - PubMed
    1. Hu D.N., Savage H.E., Roberts J.E. Uveal melanocytes, ocular pigment epithelium, and müller cells in culture: In vitro toxicology. Int. J. Toxicol. 2002;21:465–472. doi: 10.1080/10915810290169891. - DOI - PubMed
    1. Jehs T., Faber C., Udsen M.S., Jager M.J., Clark S.J., Nissen M.H. Induction of chemokine secretion and monocyte migration by human choroidal melanocytes in response to proinflammatory cytokines. Investig. Ophthalmol. Vis. Sci. 2016;57:6568–6579. doi: 10.1167/iovs.15-18524. - DOI - PubMed
    1. Scott G., Leopardi S. The camp signaling pathway has opposing effects on rac and rho in b16f10 cells: Implications for dendrite formation in melanocytic cells. Pigment Cell Res. 2003;16:139–148. doi: 10.1034/j.1600-0749.2003.00022.x. - DOI - PubMed

Publication types

LinkOut - more resources