. 2025 May 13:13:RP101369.
doi: 10.7554/eLife.101369.

Transcriptional pattern enriched for synaptic signaling is associated with shorter survival of patients with high-grade serous ovarian cancer

Affiliations

Transcriptional pattern enriched for synaptic signaling is associated with shorter survival of patients with high-grade serous ovarian cancer

Arkajyoti Bhattacharya et al. Elife. .

Abstract

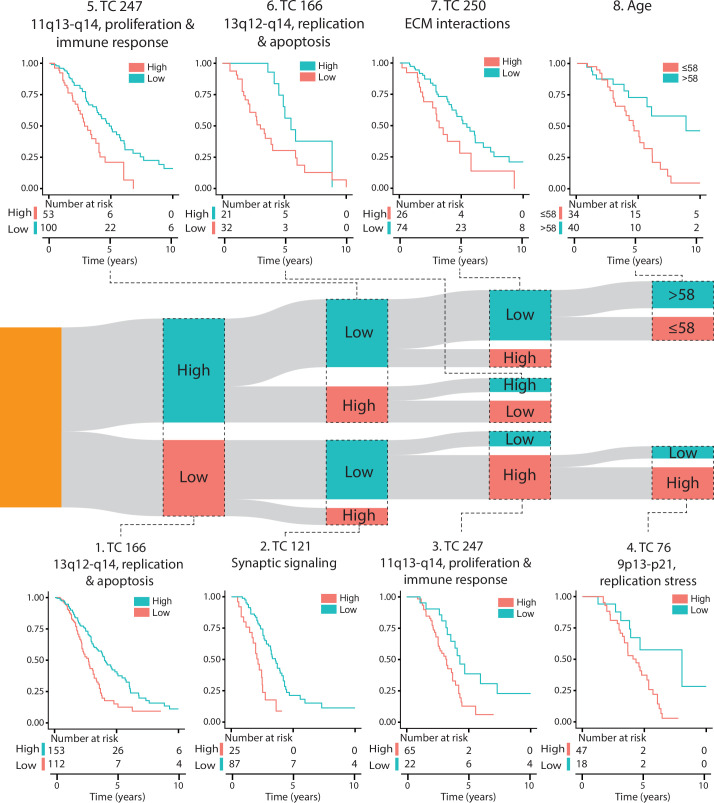
Bulk transcriptomic analyses of high-grade serous ovarian cancer (HGSOC) so far have not uncovered potential drug targets, possibly because subtle, disease-relevant transcriptional patterns are overshadowed by dominant, non-relevant ones. Our aim was to uncover disease-outcome-related patterns in HGSOC transcriptomes that may reveal novel drug targets. Using consensus-independent component analysis, we dissected 678 HGSOC transcriptomes of systemic therapy naïve patients-sourced from public repositories-into statistically independent transcriptional components (TCs). To enhance c-ICA's robustness, we added 447 transcriptomes from non-serous histotypes, low-grade serous, and non-cancerous ovarian tissues. Cox regression and survival tree analysis were performed to determine the association between TC activity and overall survival (OS). Finally, we determined the activity of the OS-associated TCs in 11 publicly available spatially resolved ovarian cancer transcriptomes. We identified 374 TCs, capturing prominent and subtle transcriptional patterns linked to specific biological processes. Six TCs, age, and tumor stage stratified patients with HGSOC receiving platinum-based chemotherapy into ten distinct OS groups. Three TCs were linked to copy-number alterations affecting expression levels of genes involved in replication, apoptosis, proliferation, immune activity, and replication stress. Notably, the TC identifying patients with the shortest OS captured a novel transcriptional pattern linked to synaptic signaling, which was active in tumor regions within all spatially resolved transcriptomes. The association between a synaptic signaling-related TC and OS supports the emerging role of neurons and their axons as cancer hallmark-inducing constituents of the tumor microenvironment. These constituents might offer a novel drug target for patients with HGSOC.

Keywords: cancer biology; decision tree analysis; genetics; genomics; human; independent component analysis; serous ovarian cancer; transcriptomics.


Conflict of interest statement

AB, TS, MP, SL, MJ, AR, PV, RD, Md, Ed, Sd, RF No competing interests declared

Figures

Figure 1.
Figure 1.. Workflow indicates the data acquisition and relations between the methods.
Figure 2.
Figure 2.. Enrichment heatmap of hallmark gene sets in transcriptional components associated with patient overall survival.
Gene Set Enrichment Analysis for 14 transcriptional components (TCs) associated with overall survival (OS) identified through univariate or multivariate survival analyses are presented. Only Hallmark gene sets with significant enrichment (Bonferroni-corrected p-value) for at least one TC are shown. The heatmap displays Z-scores, which indicate the relative enrichment strength, with values truncated at a maximum of 4 for visualization purposes. The gene sets were clustered based on Pearson correlation using the Ward D2 method, providing insights into related biological processes captured by different TCs. In the right column, chromosomal locations of copy number alterations (CNAs) are shown, reflecting the downstream effects on gene expression that each TC captures. This integration of CNA information highlights the biological relevance of each TC and its contribution to gene expression variability and patient outcomes.
Figure 2—figure supplement 1.
Figure 2—figure supplement 1.. Association of OS-related TCs with clinicopathologic parameters.
The association between clinicopathologic parameters and the activity of the OS-associated 14 TCs was determined in the complete set of 1125 samples. Pearson correlation was used to calculate the association of each clinicopathologic parameter with each TC. The TCs were then ranked based on their association with OS. Abbreviations: TC = transcriptional component, OS = overall survival.
Figure 2—figure supplement 2.
Figure 2—figure supplement 2.. Enrichment heatmap for the KEGG gene set collection in OS-related TCs.
Gene set enrichment analysis (GSEA) results of 14 TCs associated with OS in univariate or multivariate survival analysis are presented, including KEGG gene sets that were included in the enrichment for at least one TC that passed the Bonferroni threshold for multiple testing correction. The gene sets were clustered using Pearson correlation and Ward D2, and the heatmap colors were based on Z-scores, truncated at a value of four. The right column shows the chromosomal location of a copy number alteration that the TC captures the downstream effects on gene expression levels. Abbreviations: TC = transcriptional component, OS = overall survival.
Figure 2—figure supplement 3.
Figure 2—figure supplement 3.. Enrichment heatmap for the REACTOME gene set collection in overall survival (OS)-related TCs.
Gene set enrichment analysis (GSEA) results of 14 TCs associated with OS in univariate or multivariate survival analysis are presented, including REACTOME gene sets that were included if the enrichment for at least one TC passed the Bonferroni threshold for multiple testing correction. The gene sets were clustered using Pearson correlation and Ward D2, and the heatmap colors were based on Z-scores, truncated at a value of four. The right column shows the chromosomal location of a copy number alteration that the TC captures the downstream effects on gene expression levels. Abbreviations: TC = transcriptional component.
Figure 3.
Figure 3.. Survival tree analysis of patients with platinum-treated HGSOC defines survival cohorts with distinct clinicopathologic and biological characteristics.
The results of the survival tree analysis of 294 patients with high-grade serous ovarian cancer (HGSOC) treated with platinum-based chemotherapy are presented. The analysis utilized 14 transcriptional components (TCs) associated with overall survival (OS), along with other clinicopathologic factors, including age, tumor stage, grade, and debulking status. The resulting tree identified nine distinct survival cohorts, each represented as a bar in the Sankey diagram, where the bar height corresponds to the number of patients in each cohort. Kaplan-Meier survival curves with accompanying number-at-risk tables are shown for each cohort, with survival data censored at 10 y. The names of the survival cohorts were based on enriched biological processes in the TCs, as determined by the chromosomal location of genes captured by a TC, GSEA, and co-functionality analysis of the top genes. The p-values in the Kaplan-Meier plots were derived from log-rank tests comparing survival distributions between groups. Abbreviations: TC = transcriptional component, ECM = extracellular matrix.
Figure 3—figure supplement 1.
Figure 3—figure supplement 1.. Survival tree analysis of patients with advanced-stage, high-grade serous ovarian cancer (HGSOC) defines survival cohorts with distinct clinicopathologic and biological characteristics.
Survival tree analysis of 265 patients with advanced-stage, platinum-treated HGSOC using 14 OS-associated TCs and other classifiers such as age, tumor stage, grade, and debulking status. The analysis resulted in nine survival cohorts, and the height of the bar in the Sankey diagram represents the number of patients in each cohort. The Kaplan-Meier plots and number-at-risk tables are presented with survival data censored at 10 y. The names of the survival cohorts were based on enriched biological processes in the TCs, as determined by the chromosomal location of genes captured by a TC, gene set enrichment analysis (GSEA), and co-functionality analysis of the top genes. The p-values in each panel show the p-value from the corresponding log-rank test between the two groups. Abbreviations: TC = transcriptional component, ECM = extracellular matrix.
Figure 3—figure supplement 2.
Figure 3—figure supplement 2.. The activity of TC121 in bulk transcriptomes of patients with different subtypes of ovarian cancer.
The boxplots display the activity scores of TC121 in different cancer subtypes, which are ordered based on their corresponding median activity scores.
Figure 3—figure supplement 3.
Figure 3—figure supplement 3.. Three overall survival (OS)-associated TCs capture the transcriptional effect of copy number alterations.
For each OS-related TC, the weight of each gene was plotted on its genomic location. Abbreviations: TC = transcriptional component.
Figure 4.
Figure 4.. Co-functionality network of top 100 absolute weighted genes in TC121.
Co-functionality network for the top 100 genes with the highest absolute weights in TC121 is presented. Genes were clustered based on predicted co-functionality (r>0.7) across datasets, with clusters identified using both Gene Ontology (GO) Biological Processes and Cellular Components databases. One primary cluster, containing more than five genes, exhibited strong enrichment for synaptic signaling in the GO Biological Processes database and for synaptic membranes in the GO Cellular Components database. This highlights the biological specificity of TC121 in regulating gene expression linked to synaptic functions.
Figure 5.
Figure 5.. The activity of TC121 in bulk transcriptomes of Cancer Cell Line Encyclopedia (CCLE), Genomics of Drug Sensitivity in Cancer (GDSC) cell lines, and Gene Expression Omnibus (GEO) and The Cancer Genome Atlas (TCGA) patient-derived samples.
(A) Cross-study TC projection of TC121 on CCLE and GDSC cell lines. The boxplots display the activity scores of TC121 in different tissue types, which are ordered based on their corresponding median activity scores. (B) Cross-study TC projection of TC121 on GEO and TCGA bulk transcriptomes resulted in the activity scores presented in the boxplots. Cancer types were ordered based on corresponding medians of TC121 activity scores. Abbreviations: TC = transcriptional component.
Figure 5—figure supplement 1.
Figure 5—figure supplement 1.. Activity of overall survival (OS)-associated TCs in bulk transcriptomes of Cancer Cell Line Encyclopedia (CCLE) cell lines.
The proportion of samples with outlier activity scores in individual tissue types for each of the 14 OS-associated TCs was obtained using an absolute cut-off value of 0.05. TCs were ordered based on their association with OS. Abbreviations: TC = transcriptional component.
Figure 5—figure supplement 2.
Figure 5—figure supplement 2.. The activity of overall survival (OS)-associated TCs in bulk transcriptomes of Genomics of Drug Sensitivity in Cancer (GDSC) cell lines.
The proportion of samples with outlier activity scores in individual tissue types for each of the 14 OS-associated TCs was obtained using an absolute cut-off value of 0.05. TCs were ordered based on their association with OS. Abbreviations: TC = transcriptional component.
Figure 5—figure supplement 3.
Figure 5—figure supplement 3.. Association heatmap for The Cancer Genome Atlas (TCGA) cluster sets with the activity scores of OS-related TCs.
This heatmap highlights the associations between each cluster set and the TCs, represented by log-transformed p-values from the corresponding Kruskal-Wallis test. A significant association between a TC and a cluster set indicates that at least one cluster within the cluster set exhibited significantly different activity scores for the corresponding TC compared to the other clusters. The heatmap colors were based on log-transformed p-values. Abbreviations: TC = transcriptional component. OS = overall survival.
Figure 6.
Figure 6.. Spatial transcriptomic profiles in ovarian cancer samples.
(A) We employed a permutation-based approach to pinpoint the areas of significant TC activity in spatial transcriptomic profiles. We ran 5000 permutations for each TC-profile combination, yielding a p-value that indicates the extent to which the TC activity in the corresponding profile differs from what would be expected by chance (the null distribution). We then transformed these p-values into logarithmic values and represented them using a heatmap. Heatmaps of activity scores of the TCs are presented in individual rows for the high-grade serous ovarian cancer (HGSOC), serous papillary, and endometrioid adenocarcinoma of ovary samples. The first column represents the stained images of the samples. The second to seventh columns show heatmaps corresponding to the mentioned TCs. (B) The heatmap illustrates the colocalization between two TC activities on spatial transcriptomic profiles from ovarian cancer samples. For each cell, the colocalization scores of the TCs at each of the three spatial transcriptomics samples OC 1, OC 2, and OC 3 are arranged in columns. A colocalization score of 4 between two TCs (red) indicates that the positively (+) and negatively (-) active regions of both TCs are perfectly colocalized. Conversely, a colocalization score of –4 between two TCs (blue) also indicates colocalization. Still, with inverse activity, i.e., the positively active regions of one TC are colocalized with the negatively active regions of the other TC or vice versa. A colocalization score close to 0 between two TCs (white) indicates that the activities of two TCs are spatially separated. The dashed and solid circles in the panel on the right side of the color bar represent two different TCs. Abbreviations: TC = transcriptional component.
Figure 6—figure supplement 1.
Figure 6—figure supplement 1.. Spatial transcriptomic profiles in eight ovarian cancer samples.
(A) We employed a permutation-based approach to pinpoint the areas of significant TC activity in spatial transcriptomic profiles. We ran 5000 permutations for each TC-profile combination, yielding a p-value that indicates the extent to which the TC activity in the corresponding profile differs from what would be expected by chance (the null distribution). We then transformed these p-values into logarithmic values and represented them using a heatmap. Heatmaps of activity scores of the TCs are presented in individual rows for the high-grade serous ovarian cancer (HGSOC) samples. The first column represents the stained images of the samples. The second to seventh columns show heatmaps corresponding to the mentioned TCs. (B) The heatmap illustrates the colocalization between two TC activities on spatial transcriptomic profiles from ovarian cancer samples. For each cell, the colocalization scores of the TCs at each of the eight spatial transcriptomics samples are arranged in columns. A colocalization score of 4 between two TCs (red) indicates that the positively (+) and negatively (-) active regions of both TCs are perfectly colocalized. Conversely, a colocalization score of –4 between two TCs (blue) also indicates colocalization. Still, with inverse activity, i.e., the positively active regions of one TC are colocalized with the negatively active regions of the other TC or vice versa. A colocalization score close to 0 between two TCs (white) indicates that the activities of two TCs are spatially separated. The dashed and solid circles in the panel on the right side of the color bar represent two different TCs. Abbreviations: TC = transcriptional component.
Figure 6—figure supplement 2.
Figure 6—figure supplement 2.. The activity scores of OS-associated TCs in different single-cell types from patients with HGSOC.
Abbreviations: TC = transcriptional component. OS = overall survival. HGSOC = high-grade serous ovarian cancer.

Update of

  • doi: 10.1101/2024.10.21.619015
  • doi: 10.7554/eLife.101369.1
  • doi: 10.7554/eLife.101369.2

References

    1. Allen JK, Armaiz-Pena GN, Nagaraja AS, Sadaoui NC, Ortiz T, Dood R, Ozcan M, Herder DM, Haemmerle M, Gharpure KM, Rupaimoole R, Previs RA, Wu SY, Pradeep S, Xu X, Han HD, Zand B, Dalton HJ, Taylor M, Hu W, Bottsford-Miller J, Moreno-Smith M, Kang Y, Mangala LS, Rodriguez-Aguayo C, Sehgal V, Spaeth EL, Ram PT, Wong STC, Marini FC, Lopez-Berestein G, Cole SW, Lutgendorf SK, De Biasi M, Sood AK. sustained adrenergic signaling promotes intratumoral innervation through bdnf induction. Cancer Research. 2018;78:3233–3242. doi: 10.1158/0008-5472.CAN-16-1701. - DOI - PMC - PubMed
    1. Ardini E, Menichincheri M, Banfi P, Bosotti R, De Ponti C, Pulci R, Ballinari D, Ciomei M, Texido G, Degrassi A, Avanzi N, Amboldi N, Saccardo MB, Casero D, Orsini P, Bandiera T, Mologni L, Anderson D, Wei G, Harris J, Vernier J-M, Li G, Felder E, Donati D, Isacchi A, Pesenti E, Magnaghi P, Galvani A. Entrectinib, a Pan-TRK, ROS1, and ALK inhibitor with activity in multiple molecularly defined cancer indications. Molecular Cancer Therapeutics. 2016;15:628–639. doi: 10.1158/1535-7163.MCT-15-0758. - DOI - PubMed
    1. Balood M, Ahmadi M, Eichwald T, Ahmadi A, Majdoubi A, Roversi K, Roversi K, Lucido CT, Restaino AC, Huang S, Ji L, Huang K-C, Semerena E, Thomas SC, Trevino AE, Merrison H, Parrin A, Doyle B, Vermeer DW, Spanos WC, Williamson CS, Seehus CR, Foster SL, Dai H, Shu CJ, Rangachari M, Thibodeau J, V Del Rincon S, Drapkin R, Rafei M, Ghasemlou N, Vermeer PD, Woolf CJ, Talbot S. Nociceptor neurons affect cancer immunosurveillance. Nature. 2022;611:405–412. doi: 10.1038/s41586-022-05374-w. - DOI - PMC - PubMed
    1. Barr JL, Kruse A, Restaino AC, Tulina N, Stuckelberger S, Vermeer SJ, Williamson CS, Vermeer DW, Madeo M, Stamp J, Bell M, Morgan M, Yoon J-Y, Mitchell MA, Budina A, Omran DK, Schwartz LE, Drapkin R, Vermeer PD. Intra-tumoral nerve-tracing in a novel syngeneic model of high-grade serous ovarian carcinoma. Cells. 2021;10:3491. doi: 10.3390/cells10123491. - DOI - PMC - PubMed
    1. Barretina J, Caponigro G, Stransky N, Venkatesan K, Margolin AA, Kim S, Wilson CJ, Lehár J, Kryukov GV, Sonkin D, Reddy A, Liu M, Murray L, Berger MF, Monahan JE, Morais P, Meltzer J, Korejwa A, Jané-Valbuena J, Mapa FA, Thibault J, Bric-Furlong E, Raman P, Shipway A, Engels IH, Cheng J, Yu GK, Yu J, Aspesi P, Jr, de Silva M, Jagtap K, Jones MD, Wang L, Hatton C, Palescandolo E, Gupta S, Mahan S, Sougnez C, Onofrio RC, Liefeld T, MacConaill L, Winckler W, Reich M, Li N, Mesirov JP, Gabriel SB, Getz G, Ardlie K, Chan V, Myer VE, Weber BL, Porter J, Warmuth M, Finan P, Harris JL, Meyerson M, Golub TR, Morrissey MP, Sellers WR, Schlegel R, Garraway LA. The cancer cell line encyclopedia enables predictive modelling of anticancer drug sensitivity. Nature. 2012;483:603–607. doi: 10.1038/nature11003. - DOI - PMC - PubMed

Associated data

Grants and funding