. 2025 May 13;135(13):e172988.
doi: 10.1172/JCI172988. eCollection 2025 Jul 1.

LAG3 regulates antibody responses in a murine model of kidney transplantation

Affiliations

LAG3 regulates antibody responses in a murine model of kidney transplantation

Michael Nicosia et al. J Clin Invest. .

Abstract

Lymphocyte activation gene 3 (LAG3) is a coinhibitory receptor expressed by various immune cells. Although the immunomodulatory potential of LAG3 is being explored in cancer and autoimmunity, there is no information on its role after organ transplantation. Our study investigated the functions of LAG3 in a mouse model of renal allograft rejection. LAG3-/- recipients rapidly rejected MHC-mismatched renal allografts that were spontaneously accepted by WT recipients, with graft histology characteristic of antibody-mediated rejection. Depletion of recipient B cells but not CD8+ T cells significantly extended kidney allograft survival in LAG3-/- recipients. Treatment of WT recipients with an antagonistic LAG3 antibody enhanced anti-donor immune responses and induced kidney damage associated with chronic rejection. The studies of conditional LAG3-/- recipients and mixed bone marrow chimeras demonstrated that LAG3 expression on either T or B cells is sufficient to regulate anti-donor humoral immunity but not to induce acute allograft rejection. The numbers and proinflammatory functions of graft-infiltrating NK cells were markedly increased in LAG3-/- recipients, suggesting that LAG3 also regulates the effector stage of antibody-mediated rejection. These findings identified LAG3 as a regulator of immune responses to kidney allografts and a potential therapeutic target for antibody-mediated rejection prevention and treatment.

Keywords: Adaptive immunity; Immunology; Transplantation.


Figures

Figure 1
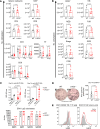
Figure 1. LAG3-deficient mice had expanded lymphocyte subsets and a modest increase in alloreactivity.
Naive nontransplanted B6.WT and B6.LAG3–/– mice were euthanized at 10 weeks of age. (A) Splenic T cell composition: CD4 (CD3+CD4+), CD8 (CD3+CD8+), Tregs (CD3+CD4+Foxp3+), CD4 TEffM (CD3+CD4+CD62LloCD44hi), CD8 TEffM (CD3+CD8+CD62LloCD44hi), TFh (TCRb+CD4+FoxP3-PD-1+CXCR5+), TFreg (TCRb+CD4+FoxP3+PD-1+CXCR5+). (B) Composition of splenic B cell subsets: FoB (B220+IgMintCD21/35int), MZB (B220+IgMhiCD21/35hi), TrB (B220+IgMhiCD21/35lo), Bregs (CD19+CD1dhiCD5+), GCB (B220+GL7+CD38lo), PC (B220-CD138hi). (C) ELISPOT quantification of the frequencies of alloreactive IFN-γ–secreting splenic T cells in naive nontransplanted B6.WT and B6.LAG3–/– mice against BALB/c, C3H, SJL, and DBA stimulator cells. (D) ELISA of serum IgG reactive to allogenic MHC-I and MHC-II molecules. The data represent at least 2 pooled experiments where each symbol represents an individual mouse. Analysis of ELISPOT data utilized 1-way ANOVA with Tukey’s multiple-comparison test, all others used Student’s t tests.
Figure 2
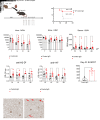
Figure 2. LAG3-deficient recipients acutely reject kidney allografts.
Groups of B6.WT and B6.LAG3–/– mice were transplanted with complete MHC-mismatched C3H kidney allografts (n = 4–5/group). (A) Kidney transplant model. (B) Renal allograft survival. (C) Serum creatinine levels at day 14 after transplant. (D) Renal allografts analyzed at the time of rejection (B6.LAG3–/–) or on day 14 after transplant (B6.WT) by trichrome C and immunoperoxidase staining for CD4, CD8, and complement component C4d. The photographs were taken at 200× original magnification (scale bars: 100 �m) and are representative of 4–5 animals in each group. (E and F) Flow cytometry analysis of graft-infiltrating immune cells: CD3+ (CD45+CD3+), CD4+ (CD45+CD3+CD4+), CD8+ (CD45+CD3+CD8+), Tregs (CD45+, CD3+CD4+FoxP3+), and B220+ (CD45+ B220+) at day 10 after transplant of C3H kidney allografts to B6.WT or B6.LAG3–/– recipients. The data represent 1 of 2 experiments where each symbol represents an individual mouse. Statistical analysis of allograft survival was measured using Mantel-Cox log-rank test. For other analyses, Student’s t tests were performed.
Figure 3
Figure 3. Recipient LAG3 deficiency enhances anti-donor immune responses.
Analyses of donor-reactive immunity in B6.WT and B6.LAG3–/– allograft recipients were performed at day 10 after transplant. (A) The composition of spleen T cell subsets was defined as follows: CD3 — CD3+, CD4 — CD3+CD4+, CD8 — CD3+CD8+, Tregs — CD3+CD4+FoxP3+, CD4 Naive — CD3+CD4+CD62LhiCD44lo, CD4 CM — CD3+CD4+CD62LhiCD44hi, CD4 EffM — CD3+CD4+CD62LloCD44hi, CD8 Naive — CD3+CD8+CD62LhiCD44lo, CD8 CM — CD3+CD8+CD62LhiCD44hi, CD8 EffM — CD3+CD8+CD62LloCD44hi, TFh — TCRb+CD4+FoxP3-PD-1+CXCR5+, and TFreg — TCRb+CD4+FoxP3+PD-1+CXCR5+. (B) The composition of splenic B cell subsets was defined as follows: B220 — B220+, FoB — B220+IgMintCD21/35int, MZB — B220+IgMhiCD21/35hi, TrB — B220+IgMhiCD21/35lo, Bregs — CD19+CD1dhiCD5+, GCB — B220+GL7+CD38lo, PCB — B220 CD138hi. (C) Top: Serum levels of IgG against donor MHC-I (H2-Dk) and MHC-II (I-Ak). Bottom: IgG subclass analysis of serum titers of IgG3, IgG1, IgG2c, and IgG2b from WT and LAG3–/– recipients at day 14 after transplant. The data are pooled from 2–3 experiments, and each symbol represents an individual mouse. (D) The frequencies of donor reactive IFN-γ–secreting splenocytes on day 14 after transplant. (E) Representative histograms of LAG3 expression by CD4+CXCR5+PD-1+ follicular T cells and B220CD138+ plasma cells. Analysis of DSA responses utilized multiple unpaired t tests with Benjamini, Krieger, and Yekutieli false discovery approaches. For all other analyses, Student’s t tests were performed.
Figure 4
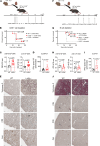
Figure 4. LAG3 blockade enhances de novo alloresponses after kidney transplant, leading to chronic antibody-mediated graft injury.
(A) B6.WT mice treated with anti-LAG3 mAb (clone C9B7W) or control IgG after transplantation of C3H renal allografts. (B) Survival of renal allografts (n = 6–9/group). (C and D) NGAL and KIM1 levels in the urine collected from kidney allograft recipients. (E) Serum blood urea nitrogen (BUN) levels. (F and G) Serum levels of IgG against donor MHC-I (H2-Dk) and MHC-II (I-Ak). (H) The frequencies of donor-reactive IFN-γ–secreting splenocytes on day 42 after transplant. (I) Renal allografts harvested on day 42 after transplant and analyzed by immunoperoxidase staining for complement component C4d. Images were taken at 400× original magnification (scale bars 50 μm) and are representative of 4–5 animals in each group. The data are pooled from 2–3 experiments, and each symbol represents an individual mouse. Statistical analysis of allograft survival was measured using Mantel-Cox log-rank test. For the time-course analysis of kidney injury markers and for DSA, 1-way ANOVA with Tukey’s multiple-comparison test was performed. For ELISPOT analysis, Student’s t tests were performed.
Figure 5
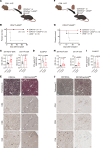
Figure 5. Kidney allograft rejection in LAG3-deficient recipients is dependent on B cells not CD8+ T cells.
(A) B6.WT or B6.LAG3–/– recipients depleted of CD8+ T cells prior to transplantation of C3H renal allografts. (B) Survival of renal allografts (n = 5–6/group). (C) Serum levels of IgG against donor MHC-I (H2-Dk) and MHC-II (I-Ak) in B6.WT and B6.LAG3–/– kidney allograft recipients. (D) The frequencies of donor-reactive IFN-γ–secreting splenocytes on day 14 after transplant. (E) Renal allografts harvested at the time of rejection and analyzed by trichrome C and immunoperoxidase staining for CD4, CD8, and complement component C4d. Images were taken at 200× original magnification (scale bars: 100 μm) and are representative of 4–5 animals in each group. (F) B cells were depleted in B6.WT or B6.LAG3–/– recipients after transplantation of C3H renal allografts. (G) Survival of renal allografts (n = 5–6/group). (H) Serum levels of IgG against donor MHC-I (H2-Dk) and MHC-II (I-Ak). (I) The frequencies of donor-reactive IFN-γ–secreting splenocytes on day 14 after transplant. (J) Renal allografts harvested at the time of rejection and analyzed by trichrome C and immunoperoxidase staining for CD4, CD8, and complement component C4d. Images were taken at 200× original magnification and are representative of 4–5 animals in each group. The data are pooled from 2–3 experiments, and each symbol represents an individual mouse. Statistical analysis of allograft survival was measured using Mantel-Cox log-rank test. For other analyses, Student’s t tests were performed.
Figure 6
Figure 6. Loss of LAG3 expression on either T or B cells is not sufficient to mediate kidney allograft rejection.
(A) B6.CD4-Cre+/– or B6.CD4-Cre+/–LAG3fl/fl recipients were transplanted with C3H renal allografts. (B) Survival of renal allografts (n = 5–7/group). (C) Serum levels of IgG against donor MHC-I (H2-Dk) and MHC-II (I-Ak) in B6.CD4-Cre+/–LAG3fl/fl or B6.CD4-Cre+/– littermate control kidney allograft recipients. (D) The frequencies of donor-reactive IFN-γ–secreting splenocytes on day 14 after transplant. (E) Renal allografts harvested at the time of rejection and analyzed by trichrome C and immunoperoxidase staining for CD4, CD8, and complement component C4d. (F) B6.CD19-Cre+/– or B6.CD19-Cre+/–LAG3fl/fl recipients were transplanted with C3H renal allografts. (G) Survival of renal allografts (n = 7–8/group). (H) Serum levels of IgG against donor MHC-I (H2-Dk) and MHC-II (I-Ak) in B6.CD19-Cre+/– littermate controls or B6.CD19-Cre+/–LAG3fl/fl kidney allograft recipients. (I) The frequencies of donor-reactive IFN-γ–secreting splenocytes on day 14 after transplant. (J) Renal allografts harvested at the time of rejection and analyzed by trichrome C and immunoperoxidase staining for CD4, CD8, and complement component C4d. Images were taken at 200× original magnification (scale bars: 100 μm) and are representative of 4–5 animals in each group. The data are pooled from 2–3 experiments, and each symbol represents an individual mouse. Statistical analysis of allograft survival was measured using Mantel-Cox log-rank test. For other analyses, Student’s t tests were performed.
Figure 7
Figure 7. Recipient LAG3 deficiency results in increased accumulation and effector functions of NK cells in renal allografts.
(A) Quantification of allograft-infiltrating NK cells in WT or LAG3–/– recipients on day 10 after transplant. (B) Representative histogram and (C) quantification of CD107a expression by graft-infiltrating NK cells. (D) Representative contour plots of graft-infiltrating NK cells from WT and LAG3–/– kidney allograft recipient at day 10 after transplant. (E) Quantification of IFN-γ, granzyme B (GZMB), and perforin producing graft-infiltrating NK cells. The gating strategy is shown in Supplemental Figure 13A. The data are pooled from 2 experiments, and each symbol represents an individual mouse. Student’s t tests were performed.
Figure 8
Figure 8. LAG3 regulates antibody responses to both T cell–dependent and T cell–independent antigens.
(A) Serum ELISA for low-affinity NP-specific antibody was performed on sera taken at day 14 after immunization of WT and LAG3–/– mice with NP-KLH. (B) Serum ELISA for high-affinity NP-specific antibody was performed on sera taken at day 14 after immunization of WT and LAG3–/– mice with NP-KLH. (C) Serum ELISA for low-affinity NP-specific antibody was performed on sera taken at day 14 after immunization of WT and LAG3–/– mice with NP-AECM-Ficoll. (D) Serum ELISA for high-affinity NP-specific antibody was performed on sera taken at day 14 after immunization of WT and LAG3–/– mice with NP-AECM-Ficoll. (E) Serum ELISA for low-affinity NP-specific antibody was performed on sera taken at day 14 after immunization of CD19-Cre+/– and CD19-Cre+/–LAG3fl/fl mice with NP-KLH. (F) ELISA for high-affinity NP-specific antibody was performed on sera taken at day 14 after immunization of CD19-Cre+/– and CD19-Cre+/–LAG3fl/fl mice with NP-KLH. (G) ELISA for low-affinity NP-specific antibody was performed on sera taken at day 14 after immunization of CD19-Cre+/– and CD19-Cre+/–LAG3fl/fl mice with NP-AECM-Ficoll. (H) ELISA for high-affinity NP-specific antibody was performed on sera taken at day 14 after immunization of CD19-Cre+/– and CD19-Cre+/–LAG3fl/fl mice with NP-AECM-Ficoll. (I) Heatmaps of MFIs of splenic Tfh staining for IL-4, IL-21, IL-6, and granzyme B (GZMB) from WT or LAG3–/– mice on day 10 after immunization with NP-KLH. (J) Heatmaps of MFIs of splenic Treg and Tfreg staining for IL-10 from WT or LAG3–/– mice on day 10 after immunization with NP-KLH. For heatmaps, individual mice are shown above the indicated mean MFI values. Antibody dilution curves were analyzed with multiple unpaired t tests with Benjamini, Krieger, and Yekutieli false discovery approaches. For all other analyses, Student’s t tests were performed. For dilution curves, NS = not significant; in heatmaps, squares without asterisks are not significant (P > 0.05). *P ≤ 0.05, **P ≤ 0.01, ***P ≤ 0.001, ****P ≤ 0.0001.
Figure 9
Figure 9. LAG3 is required for IL-10 production by plasma cells and regulates plasma cells intrinsically.
(A) Analysis of MHC-I, MHC-II, CD40, CD80, and CD86 expression by isolated follicular B cells from WT and LAG3–/– after stimulation for 24 hours with either anti-IgM and anti-CD40/CpG, IL-4, and IL-5 by flow cytometry. (B) ELISPOT analysis of BALB/c T cell IFN-γ responses to stimulation by either B6.WT or B6.LAG3–/– isolated B cells. (C) Heatmaps of MFIs of CD40, CD80, CD86, and MHC-II expression by follicular B cells (FoB), marginal zone B cells (MZB), transitional B cells (TrB), and germinal center B cells (GCBs) from the spleens of WT and LAG3–/– mice 10 days after immunization with NP-KLH. (D) Heatmaps of MFIs of IL-10 and production by splenic plasma cells (PCBs) of WT and LAG3–/– mice 10 days after immunization with NP-KLH. (E) Quantification of frequency of IgG-producing cells and IgG spot size from plasma cell ELISPOTs of WT and LAG3–/– splenocytes ± LAG3 cross-linking (LAG3-XL). (F) Quantification of frequency of IgG-producing cells and IgG spot size from plasma cell ELISPOTs of CD19-Cre+/– and CD19-Cre+/–LAG3fl/fl splenocytes ± LAG3 cross-linking (LAG3-XL). For heatmaps, individual mice are shown above the indicated mean MFI values. For A, 2-way ANOVA with Šidák’s multiple-comparison test was performed. For BE, Student’s t tests were performed, and in F, 1-way ANOVA with Tukey’s multiple-comparison test was performed. For dilution curves, NS indicates not significant; in heatmaps, squares without asterisks are not significant (P > 0.05). **P ≤ 0.01.

References

    1. Triebel F, et al. LAG-3, a novel lymphocyte activation gene closely related to CD4. J Exp Med. 1990;171(5):1393–1405. doi: 10.1084/jem.171.5.1393. - DOI - PMC - PubMed
    1. Kisielow M, et al. Expression of lymphocyte activation gene 3 (LAG-3) on B cells is induced by T cells. Eur J Immunol. 2005;35(7):2081–2088. doi: 10.1002/eji.200526090. - DOI - PubMed
    1. Durham NM, et al. Lymphocyte activation Gene 3 (LAG-3) modulates the ability of CD4 T-cells to be suppressed in vivo. PLoS One. 2014;9(11):e109080. doi: 10.1371/journal.pone.0109080. - DOI - PMC - PubMed
    1. Pena J, et al. Lymphocyte activation gene-3 expression defines a discrete subset of HIV-specific CD8+ T cells that is associated with lower viral load. AIDS Res Hum Retroviruses. 2014;30(6):535–541. doi: 10.1089/aid.2012.0195. - DOI - PMC - PubMed
    1. Huang CT, et al. Role of LAG-3 in regulatory T cells. Immunity. 2004;21(4):503–513. doi: 10.1016/j.immuni.2004.08.010. - DOI - PubMed

MeSH terms