. 2025 May 20;122(20):e2412447122.
doi: 10.1073/pnas.2412447122. Epub 2025 May 13.

Staphylococcus aureus SaeR/S-regulated factors overcome human complement-mediated inhibition of aggregation to evade neutrophil killing

Affiliations

Staphylococcus aureus SaeR/S-regulated factors overcome human complement-mediated inhibition of aggregation to evade neutrophil killing

Brian A Pettygrove et al. Proc Natl Acad Sci U S A. .

Abstract

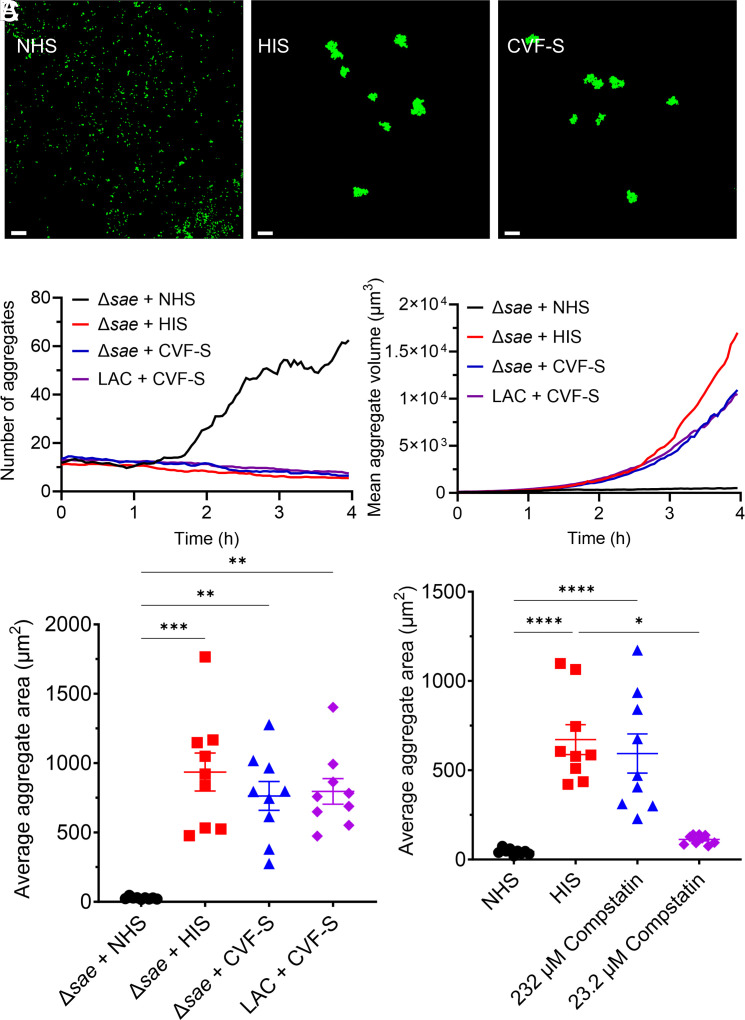
Staphylococcus aureus (S. aureus) is a frequent culprit in implant-associated infections and employs many virulence factors to escape killing by the host immune system. The specific immune evasion strategies used by small aggregates of S. aureus on a surface, precursors to mature biofilm, are still relatively unknown. Time-lapse confocal microscopy was leveraged to quantify interactions between S. aureus aggregates and human neutrophils in vitro and identify specific mechanisms of resistance to neutrophil killing. Surface-associated wild-type S. aureus rapidly formed small biofilm aggregates when grown in human serum. Conversely, aggregation was inhibited when the SaeR/S two-component gene regulatory system was deleted. Wild-type aggregates began to show individual and population-level resistance to neutrophil killing upon reaching sizes of approximately 50 to 75 µm2, whereas Δsae clusters failed to reach these sizes and were readily cleared. Aggregation of Δsae strains was impaired by serum complement, and this inhibition required complement proteins C3 and factor B, but not C4 or C5, suggesting that this activity primarily occurs at the level of the alternative pathway. Several complement-inhibiting genes regulated by SaeR/S were identified that collectively facilitate biofilm aggregate formation in human, but not murine serum. Finally, aggregation of two related opportunistic pathogens, Staphylococcus epidermidis and Enterococcus faecalis, was inhibited by serum. These data demonstrate a function of serum complement, the ability to inhibit bacterial aggregation, that is potently blocked by S. aureus through the production of multiple complement-interfering proteins that are regulated by the SaeR/S system.

Keywords: Staphylococcus aureus; biofilm; complement; microscopy; neutrophil.


Conflict of interest statement

Competing interests statement:The authors declare no competing interest.

Figures

Fig. 1.
Fig. 1.
S. aureus (strain LAC) biofilm aggregates rapidly gain resistance to neutrophil killing. Survival of aggregates grown for (A) 3 h, (B) 2 h, or (C) 1 h prior to neutrophil addition (pregrowth +, circles) and CFU-matched nonaggregated controls (pregrowth −, squares), compared to control wells without neutrophils. Log difference calculated as the difference between neutrophil-treated and control wells for either recovered CFUs (closed symbols) or total GFP signal remaining on the surface measured by a stitched tile scan view of the entire well (open symbols) (N = 4 independent experiments each. Paired t test *P < 0.05, **P < 0.01). (D) Average bacterial aggregate size at the start of imaging. Bins indicated the amount of time allowed for aggregate growth prior to neutrophil addition (N = 61 to 1,406 aggregates per condition from 12 independent experiments. Kruskal–Wallis test with Dunn’s multiple comparisons ****P < 0.0001). (E) Change in aggregate volume following discovery by a neutrophil (N = 15 to 92 aggregates per bin from 12 independent experiments. Kruskal–Wallis test with Dunn’s multiple comparisons ***P < 0.001, ****P < 0.0001). (F) Percentage of aggregates in a FOV that induce PI staining of at least one neutrophil (N = 7 to 12 FOVs per bin. Kruskal–Wallis test with Dunn’s multiple comparisons *P < 0.05, **P < 0.01, ***P < 0.001). Error bars indicate mean ± SEM.
Fig. 2.
Fig. 2.
LACΔsae demonstrates an aggregation defect in human serum. Representative images of (A) LAC, (B) LACΔsae, (C) LACΔagr, and (D) LACΔsae::sae aggregation in 10% NHS after approximately 4 h of growth. [Scale bar, 50 µm (AD).] (E-H) Aggregation phenotype in 10% NHS. Data shown were collected from N = 8 FOVS from four independent experiments per condition.
Fig. 3.
Fig. 3.
LACΔsae but not LACΔagr shows increased susceptibility to neutrophil clearance in vitro during early biofilm formation. (A) Biofilm aggregate size at the time of initial interaction with a neutrophil (A) Δsae [N = 41 (LAC) and 86 (Δsae) aggregates. Mann–Whitney test. ****P < 0.0001] and (B) Δagr [N = 36 (LAC) and 40 (Δagr) aggregates. Mann–Whitney test]. (C and D) Percentage of aggregates in a FOV that induce PI staining of at least one interacting neutrophil (Unpaired t test with Welch’s correction. ***P < 0.001). (E and F) Percentage of aggregates in a FOV that had no detectable GFP signal at 4 h after discovery by a neutrophil (Unpaired t test with Welch’s correction. ****P < 0.0001). (G and H) Log difference in GFP area within a FOV over 4 h of imaging. Solid symbols indicate control wells without PMNs added. Open symbols indicate wells treated with PMNs (N = 8 FOVs per condition. Unpaired t test with Welch’s correction ***P < 0.001). Error bars indicate mean ± SEM. Data shown were collected from 8 FOVs from four independent experiments each.
Fig. 4.
Fig. 4.
Complement inhibits aggregation by LACΔsae. Representative images of LACΔsae aggregation in 10% (A) NHS, (B) HIS, or (C) CVF-treated serum (CVF-S) after approximately 4 h of growth. (Scale bar, 50 µm.) (D) Average number of bacterial objects detected and (E) average aggregate volume in each FOV (N = 6 FOVs per condition). (F) CVF or (G) compstatin treatment of serum restores Δsae aggregation (N = 9 FOVs per condition. Kruskal–Wallis test with Dunn’s multiple comparisons. *P < 0.05, **P < 0.01, ***P < 0.001). Data shown were collected from N = 3 independent experiments. Error bars indicate mean ± SEM.
Fig. 5.
Fig. 5.
The alternative complement pathway is required for inhibition of S. aureus aggregation. Representative images of LACΔsae aggregation in (A) C3-depleted human serum, (B) C5-depleted human serum, (C) C4-depleted human serum, and (D) factor B-depleted human serum after approximately 8 h of growth. (Scale bar, 50 µm.) (E) Average number of bacterial objects detected and (F) average aggregate volume in each FOV after 8 h (N = 6 FOVs per condition. Unpaired t test with Welch’s correction *P < 0.05, ****P < 0.0001). (G) Average aggregate area and (H) aggregation score per representative FOV after 8 h (N = 9 FOVs per condition. Mann–Whitney test. ****P < 0.0001). (I) Average aggregate area per representative FOV after 8 h (N = 9 FOVs per condition. Brown–Forsythe with Dunnett’s T3 multiple comparisons test. ****P < 0.0001). (J) Aggregation score after 8 h of growth (N = 9 FOVs collected per condition. Kruskal–Wallis test with Dunn’s multiple comparisons. **P < 0.01, ***P < 0.001). Data shown were collected from N = 3 independent experiments. Error bars indicate mean ± SEM.
Fig. 6.
Fig. 6.
Multiple SaeR/S-regulated genes contribute to S. aureus aggregation in human serum. Representative images of LACΔC7 (LACΔecbΔefbΔsbiΔscnΔscbΔFnbPs) aggregation in (A) NHS and (B) HIS after approximately 4 h of growth. Representative images of LACΔC5 (LACΔecbΔefbΔsbiΔFnbPs) in (C) NHS and (D) HIS after approximately 4 h of growth. (Scale bar, 20 µm.) (E) Average aggregate area per representative FOV collected after approximately 4 h of growth. (F) Aggregation score after 4 h of growth. N = 12 FOVs per condition collected from four independent experiments. Kruskal–Wallis test with Dunn’s multiple comparisons compared to LAC-NHS condition. **P < 0.01, ***P < 0.001. Error bars indicate mean ± SEM.

References

    1. Costerton J. W., Stewart P. S., Greenberg E. P., Bacterial biofilms: A common cause of persistent infections. Science 284, 1318–1322 (1999). - PubMed
    1. Parsek M. R., Singh P. K., Bacterial biofilms: An emerging link to disease pathogenesis. Annu. Rev. Microbiol. 57, 677–701 (2003). - PubMed
    1. Arciola C. R., An Y. H., Campoccia D., Donati M. E., Montanaro L., Etiology of implant orthopedic infections: A survey on 1027 clinical isolates. Int. J. Artif. Organs 28, 1091–1100 (2005). - PubMed
    1. Arciola C. R., Campoccia D., Montanaro L., Implant infections: Adhesion, biofilm formation and immune evasion. Nat. Rev. Microbiol. 16, 397–409 (2018). - PubMed
    1. Guerra F. E., Borgogna T. R., Patel D. M., Sward E. W., Voyich J. M., Epic immune battles of history: Neutrophils vs. Staphylococcus aureus. Front. Cell. Infect. Microbiol. 7, 286 (2017). - PMC - PubMed

MeSH terms

Substances

LinkOut - more resources