. 2025 May 20;6(5):102129.
doi: 10.1016/j.xcrm.2025.102129. Epub 2025 May 12.

Organoid morphology-guided classification for oral cancer reveals prognosis

Affiliations

Organoid morphology-guided classification for oral cancer reveals prognosis

Mi Rim Lee et al. Cell Rep Med. .

Abstract

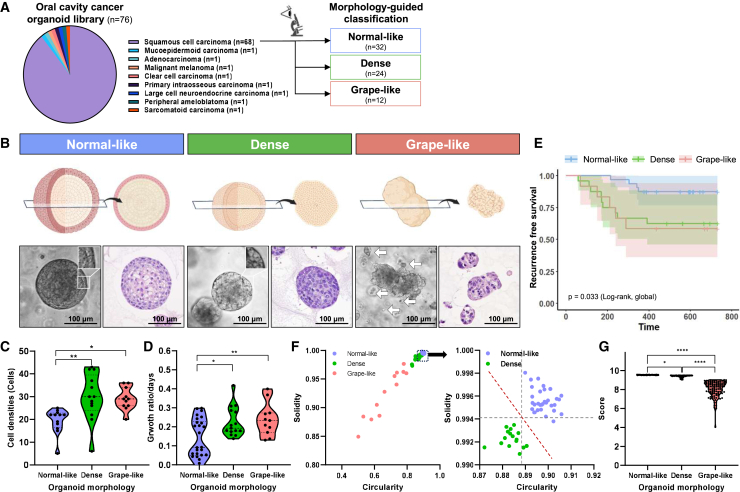
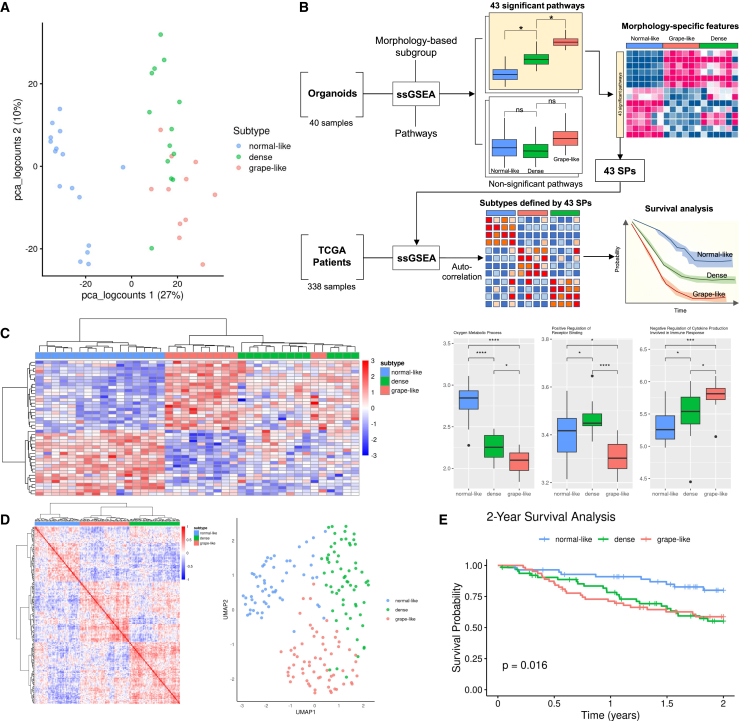
Oral cancer is an aggressive malignancy with a survival rate below 50% in advanced stages due to low mutation rates, lack of molecular subtypes, and limited treatment targets. This study presents a pioneering approach to classifying oral cancer subtypes based on the morphology of patient-derived organoids (PDOs) and proposes a therapeutic strategy. We establish 76 cancer and 81 normal PDOs. For cancer PDOs, both manual classification and AI-based scoring are utilized to categorize them into three distinct subtypes: normal-like, dense, and grape-like. These subtypes correlate with unique transcriptomic profiles, genetic mutations, and clinical outcomes, with patients harboring dense and grape-like organoids exhibiting poorer prognoses. Furthermore, drug response assessments of 14 single agents and cisplatin combination therapies identify a synergistic treatment approach for resistant subtypes. This study highlights the potential of integrating morphology-based classification with genomic and transcriptomic analyses to refine oral cancer subtyping and develop effective treatment strategies.

Keywords: combination therapy; morphology analysis; oral cancer; organoids.


Conflict of interest statement

Declaration of interests The authors declare no competing interests.

Figures

None
Graphical abstract
Figure 1
Figure 1
Generation of oral cancer organoids from patient tumors and tumor-adjacent non-malignant tissues (A) Summary of the modified organoid subculture process. (B and C) Optimization of organoid growth media. The basic conditions in which R-spondin 1, EGF, and FGF10 were added to advanced DMEM F/12 medium containing B-27 complement, HEPES, glutamine, and N-acetyl cysteine, termed the basal medium. 1% Noggin conditioned media (CM), 100 ng/mL recombinant Wnt-3a (rWNT), 3 mM CHIR99021, 1x N-2 supplement, or ITS were added to basal media. After culturing for 7 days, organoid images were taken at 5× and 20× magnifications, and the ATP assay was performed using CellTiter-Glo (3D) reagent to compare cell viability relative to the basal medium. Scale Bar, 100 μm. Each experiment was performed in biological triplicates. Statistical significance levels: ∗p < 0.05, ∗∗p < 0.01, and ∗∗∗p < 0.001. (D) Representative images of organoids treated in a concentration-dependent manner for CHIR99021. Scale Bar, 50 μm. (E) H&E and IHC staining of tumor tissue and matching PDO. Scale Bar, 50 μm. H&E, hematoxylin and eosin; IHC, immunohistochemistry; PDO, patient-derived organoid. See also Figure S1 and Tables S1, S2, and S3.
Figure 2
Figure 2
Classification and characterization of organoid morphology (A) Composition of the oral cancer organoid library. Pie chart indicates the histological diagnosis of the tumor organoids. (B) Representative organoid morphology for each subtype. The illustration summarizes the appearance and cross-sectional characteristics of each morphology. The white outlined box shows the distinguishing features at the edges of normal-like and dense organoids at high magnification. White arrows point to daughter organoids that have escaped from the main organoid body. (C) Cell density based on organoid morphology. Cell density was calculated by counting the number of hematoxylin-stained nuclei within a circle with a radius of 50 μm from the center of the organoid section in the H&E image. (D) A comparison of growth rates based on organoid morphology. Growth rates were calculated as mean values between passages 4 and 8 using the number of cells harvested per incubation period for each passage. (E) Kaplan-Meier curves of 2 years recurrence-free survival according to organoid morphology. (F) Circularity and solidity score based on organoid morphology. A circularity value of 1.0 indicates a perfect circle. A solidity value of 1.0 indicates that the shape is completely filled, resembling the reference sphere. Each score was calculated by selecting one from each of the 68 OSCC organoids Expanded ranges of normal-like and dense scores are shown on the right. Comparing solidity or circularity as a single factor (gray dotted line) results in overlapping range, whereas considering both factors together (red dotted line) can be clearly distinguished. (G) The morphology score was calculated by randomly selecting 2 to 5 images for each of the 68 OSCC organoids, for a total of 336 images. The score was defined as 0–10. Statistical significance levels: ∗p < 0.05, ∗∗p < 0.01, ∗∗∗p < 0.001, and ∗∗∗∗p < 0.001. See also Figure S2 and Table S4.
Figure 3
Figure 3
Genomic characterization by organoid morphology (A) Oncoplot displaying the somatic landscape of oral cancer organoid. Genes are arranged by their mutation frequency. TMB is shown as a bar plot (top). Stacked bar plot (bottom) shows distribution of mutation spectra for every sample in the mutatin annotation format (MAF) file. SNV class of organoid with normal-like (B), dense (C), or grape-like (D) morphology. Statistical significance levels: ∗p < 0.05, ∗∗p < 0.01, ∗∗∗p < 0.001, and ∗∗∗∗p < 0.0001. TMB, tumor mutation burden. See also Figure S3.
Figure 4
Figure 4
Transcriptional characteristics of OSCC organoids and application of morphological subtypes to TCGA (A) Dimension-reduction plot of 40 organoids, showing that each morphological subtype is well clustered. (B) Schematic representation of the morphological subtype classification process for TCGA patients, based on morphology-specific transcriptional features (see STAR Methods for details). (C) Heatmap of 43 Gene Ontology: Biological Process (GOBP) pathways showing significant subtype-specific enrichment (left), along with three representative pathways per subtype (right). Normal-like and grape-like subtypes exhibit multiple enriched pathways, while the dense subtype shows an intermediate enrichment profile. Pairwise statistical significance was assessed using the Kruskal-Wallis test. (D) Autocorrelation heatmap (left) and UMAP representation of morphology-specific features (right) of TCGA patients, filtered based on statistically significant correlations with morphological subtypes. Three distinct clusters are evident in both the heatmap and UMAP representation. (E) Kaplan-Meier plot of 2-year overall survival analysis of TCGA patients stratified by morphological subtype. The normal-like subtype demonstrates the most favorable prognosis, followed by the dense and grape-like subtypes. Statistical significance levels: ∗p < 0.05, ∗∗p < 0.01, ∗∗∗p < 0.001, and ∗∗∗∗p < 0.0001. See also Figures S4 and S5.
Figure 5
Figure 5
Exploring targeted drugs for combination treatment using an organoid model (A) Comparison of drug response by organoid morphology. (B) Comparison of synergy scores for cisplatin by target drug. The Bliss score was calculated using SynergyFinder to evaluate the synergistic effects of BAY1895344, AZD7762, EPZ015666, or everolimus in combination with cisplatin across 27 OSCC organoids, comprising 10 normal-like, 8 dense, and 9 grape-like subtypes. (C) Representative images of Bliss score according to the combination treatment. Normal-like: OC122T-O, dense: SOC34T-O, and grape-like: SOC22T-O. (D) Mean value of Bliss score by morphology. Each experiment was performed in biological quadruplicates. Statistical significance levels: ∗p < 0.05, ∗∗p < 0.01, ∗∗∗p < 0.001, and ∗∗∗∗p < 0.0001 See also Figures S6 and S7 and Table S5.

References

    1. Abrahao R., Anantharaman D., Gaborieau V., Abedi-Ardekani B., Lagiou P., Lagiou A., Ahrens W., Holcatova I., Betka J., Merletti F., et al. The influence of smoking, age and stage at diagnosis on the survival after larynx, hypopharynx and oral cavity cancers in Europe: The ARCAGE study. Int. J. Cancer. 2018;143:32–44. doi: 10.1002/ijc.31294. - DOI - PubMed
    1. Choi Y.S., Kim M.G., Lee J.H., Park J.Y., Choi S.W. Analysis of prognostic factors through survival rate analysis of oral squamous cell carcinoma patients treated at the National Cancer Center: 20 years of experience. J. Korean Assoc. Oral Maxillofac. Surg. 2022;48:284–291. doi: 10.5125/jkaoms.2022.48.5.284. - DOI - PMC - PubMed
    1. Mohamad I., Glaun M.D.E., Prabhash K., Busheri A., Lai S.Y., Noronha V., Hosni A. Current treatment strategies and risk stratification for oral carcinoma. Am. Soc. Clin. Oncol. Educ. Book. 2023;43 doi: 10.1200/EDBK_389810. - DOI - PubMed
    1. Hubbers C.U., Akgul B. HPV and cancer of the oral cavity. Virulence. 2015;6:244–248. doi: 10.1080/21505594.2014.999570. - DOI - PMC - PubMed
    1. Johnson D.E., Burtness B., Leemans C.R., Lui V.W.Y., Bauman J.E., Grandis J.R. Head and neck squamous cell carcinoma. Nat. Rev. Dis. Primers. 2020;6:92. doi: 10.1038/s41572-020-00224-3. - DOI - PMC - PubMed