. 2025 Jun 11;5(6):100872.
doi: 10.1016/j.xgen.2025.100872. Epub 2025 May 12.

Nanopore direct RNA sequencing of human transcriptomes reveals the complexity of mRNA modifications and crosstalk between regulatory features

Affiliations

Nanopore direct RNA sequencing of human transcriptomes reveals the complexity of mRNA modifications and crosstalk between regulatory features

Yerin Kim et al. Cell Genom. .

Abstract

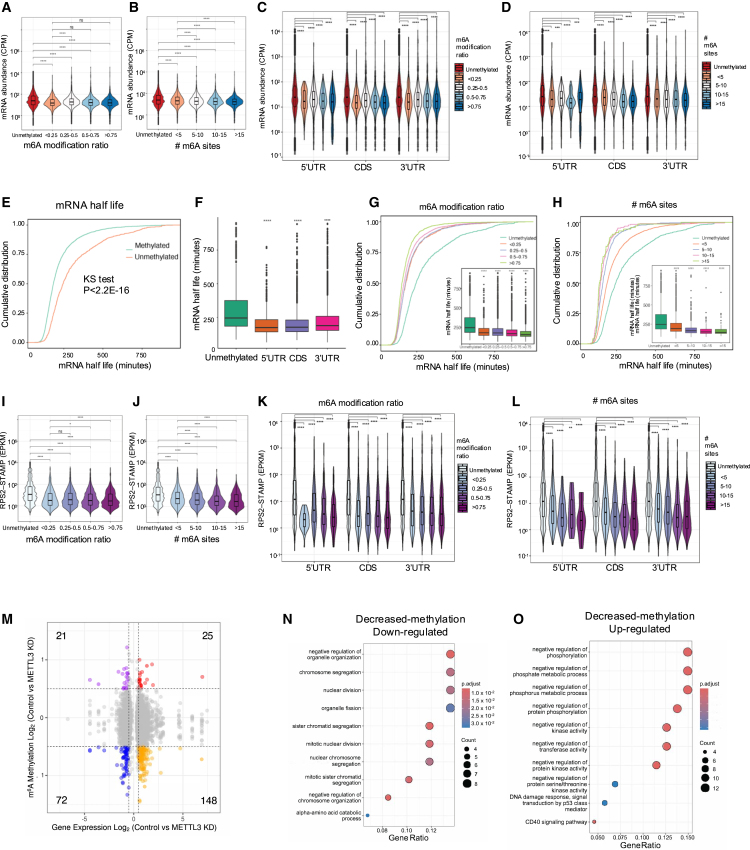
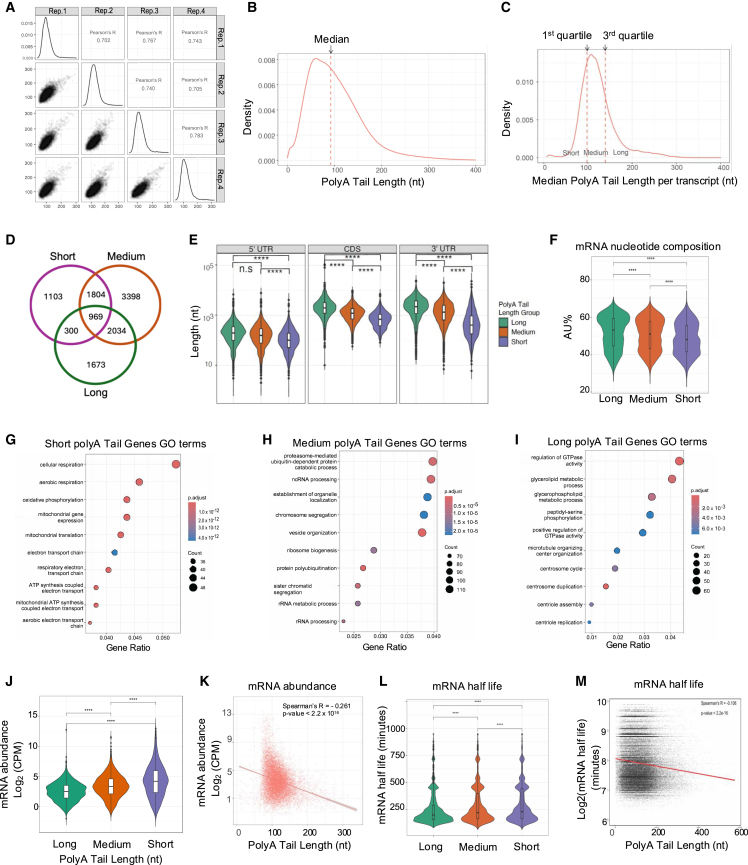
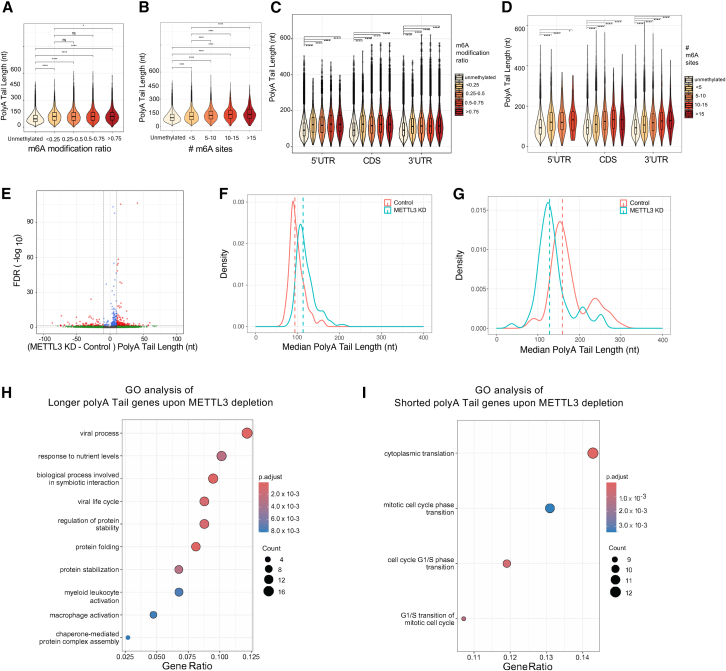
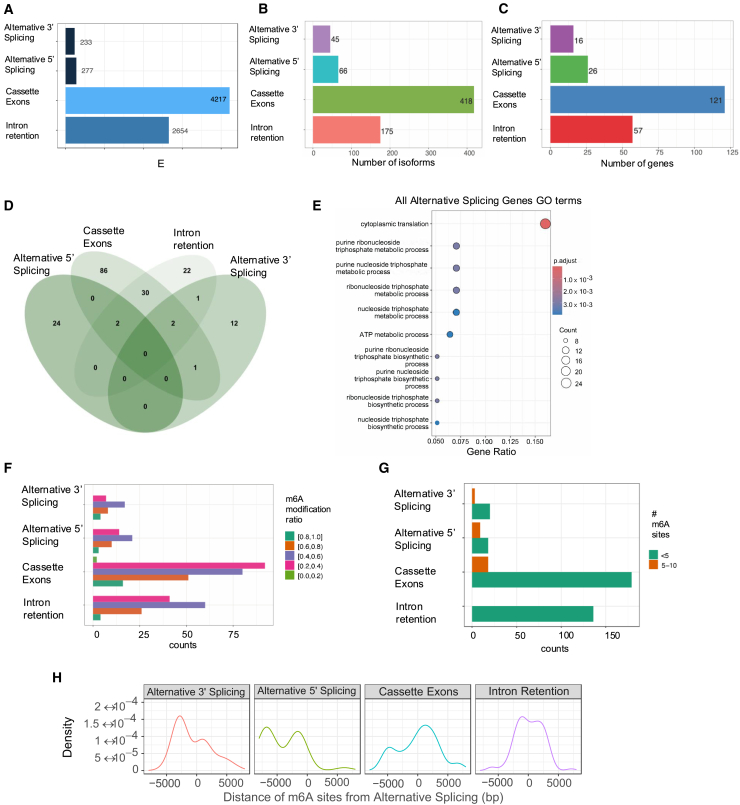
The identification and functional characterization of chemical modifications on an mRNA molecule, in particular N6-methyladenosine (m6A) modification, significantly broadened our understanding of RNA function and regulation. While interactions between RNA modifications and other RNA features have been proposed, direct evidence showing correlation is limited. Here, using Oxford Nanopore long-read direct RNA sequencing (dRNA-seq), we simultaneously interrogate the transcriptome and epitranscriptome of a human leukemia cell line to investigate the correlation between m6A modifications, mRNA abundance, mRNA stability, polyadenylation (poly(A)) tail length, and alternative splicing. High-quality dRNA-seq is important for unbiased and large-scale correlative analyses. Global assessments indicated a negative association between poly(A) tail length and mRNA abundance while uncovering pathway-specific responses upon depletion of the m6A-forming enzyme METTL3. Overall, our study presented a rich dRNA-seq data resource that has been validated and can be further exploited to inquire into the complexity of RNA modifications and potential interplays between RNA regulatory elements.

Keywords: RNA features; RNA methylation; RNA processing; RNA splicing; epitranscriptomics; long-read sequencing; mRNA decay; nanopore direct RNA sequencing; native RNA sequencing; poly(A) tail length.


Conflict of interest statement

Declaration of interests The authors have no competing interests to declare.

Figures

None
Graphical abstract
Figure 1
Figure 1
Comprehensive capture of the transcriptome and epitranscriptome of leukemia cells using Oxford Nanopore long-read direct RNA sequencing (A) Workflow of Oxford Nanopore direct RNA sequencing (dRNA-seq) and in silico data analysis. (B) Pairwise scatterplots of Pearson’s correlation of m6A ratios for modification sites (m6Anet probability ≥ 0.9) identified in all four control replicates. (C) Proportion of sites detected in corresponding replicates for m6A sites with m6Anet probability ≥0.9. (D) Metagene plot illustrating the transcriptome-wide distribution of m6A across 5′ untranslated regions (UTRs), coding sequences (CDS), and 3′ UTRs from dRNA-seq (m6Anet probability ≥ 0.9) and miCLIP-seq (Vu et al.9), respectively. (E) Proportion of m6A sites with m6Anet probability ≥0.7 by their proximity to the splice junction. (F) A violin plot depicting methylation status by the corresponding exon length for m6A sites (m6Anet probability ≥ 0.7) found within the CDS. Wilcoxon test, ∗∗∗∗p < 0.00005. (G) Bar graphs showing numbers of genes categorized based on number of m6A sites identified within the gene by dRNA-seq (m6Anet probability ≥ 0.9). (H) Bar graphs showing numbers of m6A sites characterized with the particular DRACH motifs. (I) Bar graphs showing numbers of m6A sites with corresponding m6A ratios (m6Anet probability ≥ 0.9). (J) Volcano plot of Mann-Whitney test results comparing m6A modification probability of each m6A modification site identified in METTL3-KD cells. (K) Gene Ontology (GO) and pathway analysis of genes whose m6A frequencies were decreased upon METTL3 depletion. (L and M) Representative IGV view of m6A sites (m6Anet probability ≥ 0.7) on CDKN2C and RARA transcripts. See also Figures S1 and S2 and Tables S1, S2, and S3.
Figure 2
Figure 2
Correlation analysis of m6A RNA modifications and mRNA abundance, stability, and ribosome association (A) Violin plots depicting mRNA abundance of transcripts categorized into 5 groups based on their respective m6A ratio in control cells. (B) Violin plots depicting mRNA abundance (CPM) by number of m6A sites identified per gene. (C) Violin plot depicting mRNA abundance (CPM), clustered by the location of their m6A site in the mRNA read and organized within their respective m6A ratio into five groups. (D) Violin plot depicting mRNA abundance (CPM), clustered by the location of their m6A site in the mRNA read and organized within their respective count of m6A sites per mRNA into five groups. (E) Cumulative distribution plot comparing mRNA half-life values by their methylation status. (F) Boxplot visualizing the mRNA half-life by location of m6A site in mRNA. (G) Cumulative distribution plot and boxplot comparing mRNA half-life values by increasing m6A ratio. (H) Cumulative distribution plot and boxplot comparing mRNA half-life values by increasing number of m6A sites. (I) Violin plot depicting m6A ratio with the edited read counts per target normalized for length and coverage (EPKM) on a log scale axis. (J) Violin plot depicting number of m6A sites alongside the edited read counts per target normalized for length and coverage (EPKM) on a log scale axis. (K) Violin plot clustered by the location of m6A sites in the mRNA read and organized within by their respective m6A ratio into five groups. (L) Violin plot clustered by the location of m6A sites in the mRNA read and organized within by their respective number of m6A sites into five groups. (A–L) Unmethylated is designated as any transcript with a maximum per site probability that is less than 0.7. Wilcoxon test, ∗p < 0.05, ∗∗p < 0.005, ∗∗∗p < 0.0005, and ∗∗∗∗p < 0.00005. (M) Four quadrant diagrams showing differentially methylated sites METTL3-KD vs. control cells. (N and O) GO analysis for gene groups: decreased-methylation; downregulated gene expression (N) and decreased-methylation; upregulated gene expression (O). p values were adjusted by Benjamini-Hochberg method with threshold p < 0.01 and q < 0.05. See also Figure S3 and Table S4.
Figure 3
Figure 3
Genome-wide characterization of poly(A) tail length and its correlation with mRNA abundance and stability in leukemia cells (A) Pairwise scatterplots of Pearson’s correlation showing the median poly(A) tail length per transcript across four control replicates. (B) Distribution of poly(A) tail length measured for each single read in control cells. (C) The distribution of median poly(A) tail lengths measured for each transcript when combining all reads in control cells. (D) Venn diagram showing overlapping gene names under 3 poly(A) tail length groups. (E) The length of RNA features (5′ UTR, CDS, and 3′ UTR) of transcripts categorized into each poly(A) tail length group (long vs. medium vs. short). (F) Assessment of AT content of transcripts categorized into each poly(A) tail length group (long vs. medium vs. short). (G–I) GO analysis of genes categorized into each poly(A) tail length group, i.e., (G) short, (H) medium, and (I) long. p values are adjusted by Benjamini-Hochberg method with threshold p < 0.01 and q < 0.05. (J) Violin plot showing mRNA abundance of transcripts categorized into 3 poly(A) tail length groups. (K) Scatterplot showing correlation between averaged poly(A) tail length of individual transcripts vs. transcript expression (TPM) in control cells. Spearman’s R = −0.261, p < 2.2 × 10⁻¹⁶. (L) Violin plot showing mRNA half-lives of transcripts categorized into 3 poly(A) tail length groups. (M) Scatterplot showing correlation between poly(A) tail length of individual transcript vs. mRNA half-life in control cells. Spearman’s R = −0.106, p < 2.2 × 10⁻¹⁶. All violin plots depict a Wilcoxon test, ∗p < 0.05, ∗∗p < 0.005, ∗∗∗p < 0.0005, and ∗∗∗∗p < 0.00005.
Figure 4
Figure 4
Correlation analysis of m6A RNA modifications and poly(A) tail length (A) Violin plot depicting the poly(A) tail length in nucleotide units (nt) of a transcript by m6A modification ratios categorized into five groups. (B) Violin plot depicting poly(A) tail lengths of transcripts categorized based on number of m6A sites. (C) Violin plot showing poly(A) tail lengths of transcripts clustered by the location of their m6A sites and organized within their respective m6A modification ratio groups. (D) Violin plot showing poly(A) tail lengths of transcripts clustered by the location of their m6A sites and organized within their respective number of m6A sites groups. (E) Volcano plot of Mann-Whitney test results comparing changes in poly(A) tail length of individual transcripts in METTL3-depleted (METTL3-KD) vs. control cells. (F) Density plot of median poly(A) tail length of group of transcripts when poly(A) tail lengths were decreased upon METTL3 depletion. (G) Density plot of median poly(A) tail length of group of transcripts when poly(A) tails were increased upon METTL3 depletion. (H and I) GO analysis of genes showing (H) longer tails upon METTL3 depletion and (I) shorter tails upon METTL3 depletion. p values were adjusted using the Benjamini-Hochberg method with a threshold of p < 0.01 and q < 0.05. See also Figure S5 and Table S6.
Figure 5
Figure 5
METTL3-mediated m6A regulation and alternative splicing control (A) Bar plots showing event counts for alternative RNA splicing identified in METTL3-depleted (METTL3-KD) vs. control cells. 4 main types of alternative splicing were characterized, i.e., alternative 3′ splicing, alternative 5′ splicing, cassette exon, and intron retention. (B) Bar plots showing isoform counts for alternative RNA splicing events in METTL3-depleted (METTL3-KD) vs. control cells. (C) Bar plot of gene counts for alternative RNA splicing events in METTL3-depleted (METTL3-KD) vs. control cells. (A–C) Fisher’s exact test, p < 0.05. (D) Venn diagram showing overlapping genes found to have different alternative splicing patterns. (E) GO analysis result of gene list showing differential alternative splicing events between METTL3-depleted (METTL3-KD) vs. control cells. (F) Bar plots showing number of 4 types of alternative splicing events in transcripts categorized based on m6A modification ratio (m6Anet probability ≥ 0.7). (G) Bar plots showing number of 4 types of alternative splicing events in transcripts categorized based on number of m6A sites. (H) Density plots showing distance of m6A modification sites from the alternative splicing events. See also Figure S6 and Table S7.

References

    1. Wiener D., Schwartz S. The epitranscriptome beyond m6A. Nat. Rev. Genet. 2021;22:119–131. doi: 10.1038/s41576-020-00295-8. - DOI - PubMed
    1. Gilbert W.V., Nachtergaele S. mRNA Regulation by RNA Modifications. Annu. Rev. Biochem. 2023;92:175–198. doi: 10.1146/annurev-biochem-052521-035949. - DOI - PMC - PubMed
    1. Jin Z., MacPherson K., Liu Z., Vu L.P. RNA modifications in hematological malignancies. Int. J. Hematol. 2023;117:807–820. doi: 10.1007/s12185-023-03576-0. - DOI - PubMed
    1. Zaccara S., Ries R.J., Jaffrey S.R. Reading, writing and erasing mRNA methylation. Nat. Rev. Mol. Cell Biol. 2019;20:608–624. doi: 10.1038/s41580-019-0168-5. - DOI - PubMed
    1. Batista P.J., Molinie B., Wang J., Qu K., Zhang J., Li L., Bouley D.M., Lujan E., Haddad B., Daneshvar K., et al. m(6)A RNA modification controls cell fate transition in mammalian embryonic stem cells. Cell Stem Cell. 2014;15:707–719. doi: 10.1016/j.stem.2014.09.019. - DOI - PMC - PubMed

MeSH terms

LinkOut - more resources