. 2025 Jun 5;112(6):1447-1467.
doi: 10.1016/j.ajhg.2025.04.005. Epub 2025 May 12.

Reannotation of cancer mutations based on expressed RNA transcripts reveals functional non-coding mutations in melanoma

Affiliations

Reannotation of cancer mutations based on expressed RNA transcripts reveals functional non-coding mutations in melanoma

Daniele Pepe et al. Am J Hum Genet. .

Abstract

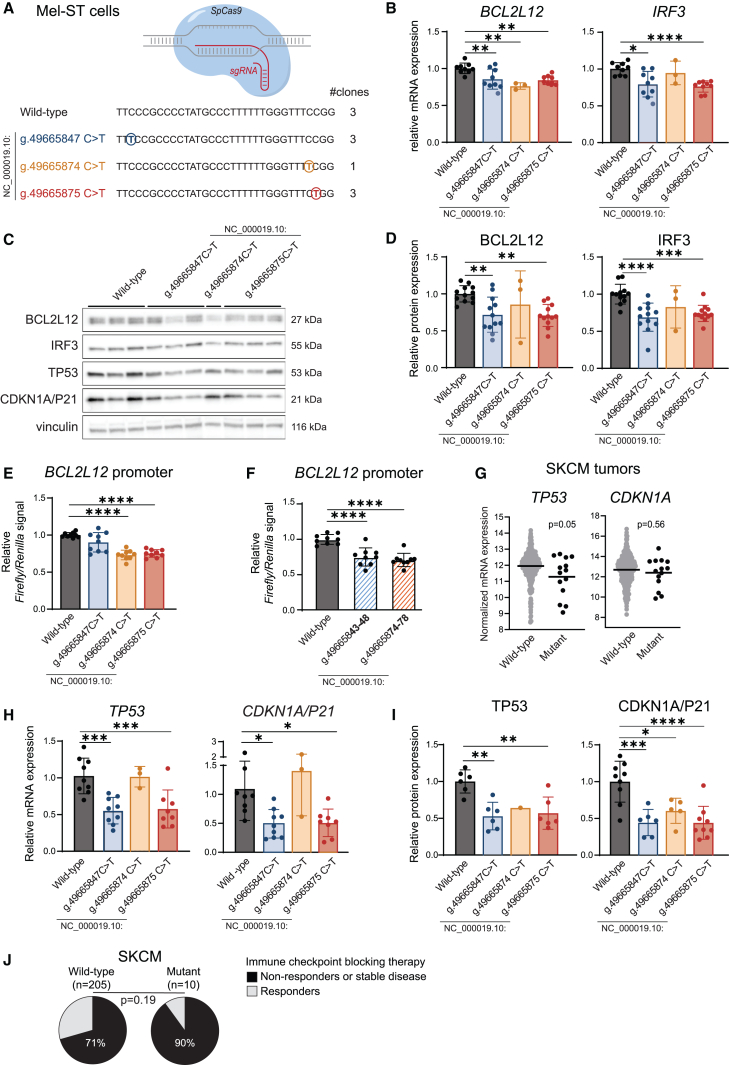
The role of synonymous mutations in cancer pathogenesis is currently underexplored. We developed a method to detect significant clusters of synonymous and missense mutations in public cancer genomics data. In melanoma, we show that 22% (11/50) of these mutation clusters are misannotated as coding mutations because the reference transcripts used for their annotation are not expressed. Instead, these mutations are actually non-coding. This, for instance, applies to the mutation clusters targeting known cancer genes kinetochore localized astrin (SPAG5) binding protein (KNSTRN) and BCL2-like 12 (BCL2L12), each affecting 4%-5% of melanoma tumors. For the latter, we show that these mutations are functional non-coding mutations that target the shared promoter region of interferon regulatory factor 3 (IRF3) and BCL2L12. This results in downregulation of IRF3, BCL2L12, and tumor protein p53 (TP53) expression in a CRISPR-Cas9 primary melanocyte model and in melanoma tumors. In individuals with melanoma, these mutations were also associated with a worse response to immunotherapy. Finally, we propose a simple automated method to more accurately annotate cancer mutations based on expressed transcripts. This work shows the importance of integrating DNA- and RNA-sequencing data to properly annotate mutations and identifies a number of previously overlooked and wrongly annotated functional non-coding mutations in melanoma.

Keywords: CRISPR-Cas9; bioinformatics; expressed transcript; functional genomics; gene regulation; melanoma; mutation annotation; non-coding mutations; synonymous mutations.


Conflict of interest statement

Declaration of interests The authors declare no conflicts of interest.

Figures

None
Graphical abstract
Figure 1
Figure 1
Significant mutation clusters in melanoma (SKCM) (A) Image explaining the four different concentration detection methods that were applied in this study. (B) Heatmap summarizing significant mutation clusters in SKCM detected using four mutational detection methods (Conc, concentration method; Entr, entropy method; Hot12, hotspot 12 method; Hot3, hotspot 3 method). The heatmap depicts results obtained when only considering non-synonymous missense and nonsense mutations (nSMs, left), when only considering synonymous mutations (SMs, middle), and when considering non-synonymous and synonymous mutations together (All mutations, right). Only genes that were significant for at least three concentration methods for nSMs, SMs, or All mutations are depicted in this heatmap. All genes with significant mutation clusters are reported in Tables S2, S3, S4, and S5. The genes in the heatmap are ranked according to mutation frequency, and detected significant mutation clusters are colored according to the frequency of mutations in the identified clusters in the SKCM dataset as explained in the legend on the right. (C) Needleplots illustrating the distribution of identified mutations in CAMK4, SLC27A5, BCL2L12, and KNSTRN.
Figure 2
Figure 2
Reannotation of BCL2L12 mutations in SKCM as functional IRF3/BCL2L12 promoter mutations (A) Needleplot of COSMIC mutations in BCL2L12 in malignant melanoma in respect to transcript ENST00000616144.4, the default transcript shown in COSMIC. (B) RNA-seq data from melanoma tumors were mapped against hg38 in the Integrative Genomics Viewer (IGV). A representative RNA-seq read distribution plot of a wild-type and three mutant tumors is shown in the upper part of the panel. The genomic location of the IRF3/BCL2L12 promoter variants is indicated, as well as the reported transcripts for BCL2L12 (black) and IRF3 (blue) in NCBI. Transcript GenBank: NM_138639.2 is highlighted in green, as it was identified as main expressed BCL2L12 transcript, as can be seen in Figure S3. (C) Normalized BCL2L12 and IRF3 mRNA expression in melanoma tumors with a wild-type (n = 420) or mutant (g.49665874C>T [GenBank: NC_000019.10], g.49665847C>T [GenBank: NC_000019.10], or g.49665875C>T [GenBank: NC_000019.10] mutation; n = 14) IRF3/BCL2L12 promoter region. Horizontal lines indicate median expression. Statistics calculated by Mann-Whitney U test: p < 0.05, ∗∗p < 0.01.
Figure 3
Figure 3
IRF3/BCL2L12 promoter mutations are functional (A) Overview of knocked-in mutations in Mel-ST cells using CRISPR-Cas9. No additional nucleotide changes besides the indicated mutations were inserted. We obtained three independent single-cell-derived Mel-ST clones for genotypes wild-type, g.49665847C>T (GenBank: NC_000019.10), and g.49665875C>T (GenBank: NC_000019.10) mutations, whereas only one clone could be obtained containing the g.49665874C>T (GenBank: NC_000019.10) variant. All clones were used in each independent experiment. (B) mRNA levels of BCL2L12 and IRF3 in Mel-ST cells as measured via RT-qPCR. Expression was normalized to GAPDH using the ΔΔCt method. Combined data of three independent experiments. Statistics calculated by ordinary one-way ANOVA (BCL2L12) or Brown-Forsythe and Welch ANOVA (IRF3). (C) Representative western blot of BCL2L12, IRF3, TP53, CDKN1A, and vinculin in Mel-ST cell clones. Each lane corresponds to sample from an independent single-cell-derived Mel-ST clone of the indicated genotype. Vinculin signal was used to normalize for protein input. (D) Quantified levels of BCL2L12 and IRF3 Mel-ST cells as measured via western blot. Combined data of three independent experiments. Statistics calculated by ordinary one-way ANOVA. (E) Ratio of firefly luciferase signal (under BCL2L12 promoter) over Renilla luciferase signal (under constitutive TK promoter) as a measurement of wild-type and mutant BCL2L12 promoter activity in reporter assays in HEK293T cells. Combined data of three independent experiments. Statistics calculated by Brown-Forsythe and Welch ANOVA (BCL2L12). (F) Ratio of firefly luciferase signal (under BCL2L12 promoter) over Renilla luciferase signal (under constitutive TK promoter) to evaluate BCL2L12 promoter activity in HEK293T cells. g.49665843-48 (GenBank: NC_000019.10) and g.49665874-78 (GenBank: NC_000019.10) correspond to mutated reporters that abolish PhysBinder predicted binding of transcription factors in the corresponding wild-type sequences (sequences shown in Figure S11). Combined data of three independent experiments. Statistics calculated by Brown-Forsythe and Welch ANOVA (BCL2L12). (G) Normalized TP53 and CDNK1A mRNA expression in SKCM tumors with a wild-type (n = 420) or mutant (g.49665874C>T [NC000019.10], g.49665847C>T [NC000019.10], or g.49665875 C>T [NC000019.10] mutation; n = 14) IRF3/BCL2L12 promoter region. Horizontal lines indicate median expression. Statistics calculated by Mann-Whitney U test. (H) mRNA levels of TP53 and CDKN1A in Mel-ST cells as measured via RT-qPCR. Expression was normalized to GAPDH using the ΔΔCt method. Combined data of three independent experiments. Statistics calculated by ordinary one-way ANOVA. (I) TP53 and CDKN1A levels in Mel-ST cells as measured via western blot. Combined data of two (TP53) or three (CDKN1A) independent experiments. Statistics calculated by ordinary one-way ANOVA. (J) Response to immune-checkpoint therapy in individuals with melanoma with a wild-type or mutant IRF3/BCL2L12 promoter status in the tumor. Statistics calculated by chi-square test. Error bars in (B), (D), (E), (F), (H), and (I) indicate standard deviations. p ≤ 0.05, ∗∗p < 0.01, ∗∗∗p < 0.001, ∗∗∗∗p < 0.0001.
Figure 4
Figure 4
Reannotation of KNSTRN mutations in SKCM as promoter mutations (A) Needleplot of COSMIC mutations in KNSTRN in malignant melanoma in respect to transcript ENST00000249776.12, the default transcript shown in COSMIC. (B) RNA-seq data from melanoma tumors were mapped against hg38 in IGV. An RNA-seq read distribution plot of a representative wild-type and KNSTRN mutated tumor is shown in the upper part of the panel. The reported KNSTNR transcripts in Ensembl are indicated, the KNSTRN-201 reference transcript is highlighted in gray, and the KNSTRN-216 transcript that is expressed in melanoma is highlighted in green. The gray rectangle indicates the region where the KNSTRN promoter variants are located and is shown in more detail in (C). (C) More detailed image of the area in the gray box in (B). This image clearly shows the location of the non-coding KNSTRN promoter mutations in respect to expressed transcript KNSTRN-216. (D) Scoring of the KNSTRN promoter variants (g.40382906C>T [GenBank: NC_000015.10] and g.40382931G>A [GenBank: NC_000015.10]) using DeepMEL2, a melanoma-specific deep-learning model to interpret how sequence variation affects gain or loss of TF binding sites. DeepMEL2 predictions are based on training the model based on three classes/topics, which represent a general melanoma (general), a melanocytic (MEL), and a mesenchymal (MES) state. The visualization on the right shows the nucleotide targeted by the mutation (indicated by a red rectangle) as well as the nucleotides upstream and downstream and illustrates the disruption (g.40382931G>A [GenBank: NC_000015.10]) of an ETS transcription factor binding site that underlies the observed prediction difference. Gray shaded areas indicate an ETS binding site. (E) Ratio of firefly luciferase signal (under KNSTRN promoter) over Renilla luciferase signal (under constitutive TK promoter) as a measurement of wild-type and mutant KNSTRN promoter activity in reporter assays performed in HEK293T cells. Combined data of three independent experiments. Error bars indicate standard deviations. Statistics calculated by ordinary one-way ANOVA: ∗∗∗∗p < 0.0001.
Figure 5
Figure 5
Reannotation of SLC27A5 mutations in SKCM as promoter mutations (A) Needleplot of COSMIC mutations in SLC27A5 in malignant melanoma in respect to transcript ENST00000263093.6, the default transcript shown in COSMIC. (B) RNA-seq data from melanoma tumors mapped against hg38. This analysis reveals that transcript SLC27A5-204 is expressed in melanoma (indicated with green shading) instead of the SLC27A5-201 reference transcript (gray shading). In respect to expressed transcript SLC27A5-204, the identified SLC27A5 mutations in melanoma are non-coding. (C) Normalized SLC27A5 mRNA expression in melanoma tumors with a wild-type (n = 422) or mutated (g.58499497C>T [GenBank: NC_000019.10] or g.58499498C>T [GenBank: NC_000019.10]; n = 12) SLC27A5 promoter region. Horizontal lines indicate median expression. Statistics calculated by Mann-Whitney U test.
Figure 6
Figure 6
Impact of SKCM mutation clusters on RNA expression of their host gene Differential RNA expression of the indicated genes in SKCM tumors with a mutated status for the identified mutation cluster in that gene (mutation cluster defined here as the region ranging from 30 nt upstream to 30 nt downstream of the most recurrent mutation) as compared to tumors with a wild-type status for the gene of interest. The genes are divided into two columns to clearly indicate whether the mutation cluster was identified as coding (missense and synonymous mutations) or non-coding. MGAM2 and ANKRD30B were not included because the coding or non-coding nature of these mutations is unclear. The legend in the figure explains the color coding. Statistical testing was done in DESeq2.

References

    1. Tamborero D., Gonzalez-Perez A., Lopez-Bigas N. OncodriveCLUST: exploiting the positional clustering of somatic mutations to identify cancer genes. Bioinformatics. 2013;29:2238–2244. doi: 10.1093/bioinformatics/btt395. - DOI - PubMed
    1. Martincorena I., Raine K.M., Gerstung M., Dawson K.J., Haase K., Van Loo P., Davies H., Stratton M.R., Campbell P.J. Universal Patterns of Selection in Cancer and Somatic Tissues. Cell. 2017;171:1029–1041.e21. doi: 10.1016/j.cell.2017.09.042. - DOI - PMC - PubMed
    1. Sauna Z.E., Kimchi-Sarfaty C. Understanding the contribution of synonymous mutations to human disease. Nat. Rev. Genet. 2011;12:683–691. doi: 10.1038/nrg3051. - DOI - PubMed
    1. Shen X., Song S., Li C., Zhang J. Synonymous mutations in representative yeast genes are mostly strongly non-neutral. Nature. 2022;606:725–731. doi: 10.1038/s41586-022-04823-w. - DOI - PMC - PubMed
    1. Kristofich J., Morgenthaler A.B., Kinney W.R., Ebmeier C.C., Snyder D.J., Old W.M., Cooper V.S., Copley S.D. Synonymous mutations make dramatic contributions to fitness when growth is limited by a weak-link enzyme. PLoS Genet. 2018;14 doi: 10.1371/journal.pgen.1007615. - DOI - PMC - PubMed

MeSH terms

Substances