. 2025 Jul 1;39(13-14):826-848.
doi: 10.1101/gad.352899.125.

Ribosome association inhibits stress-induced gene mRNA localization to stress granules

Affiliations

Ribosome association inhibits stress-induced gene mRNA localization to stress granules

Noah S Helton et al. Genes Dev. .

Abstract

The integrated stress response (ISR) is critical for resilience to stress and is implicated in numerous diseases. During the ISR, translation is repressed, stress-induced genes are expressed, and mRNAs condense into stress granules. The relationship between stress granules and stress-induced gene expression is unclear. We measured endogenous stress-induced gene mRNA localization at the single-molecule level in the presence or absence of small molecule translation inhibitors. Reducing ribosome association increases the localization of stress-induced gene mRNAs to stress granules, whereas increasing ribosome association inhibits their localization to stress granules. The presence of upstream open reading frames (uORFs) in mRNA reporters reduces their localization to stress granules in a ribosome-dependent manner. Furthermore, a single initiating ribosome blocks stress granule formation and inhibits mRNA association with preformed stress granules. Thus, uORF-mediated ribosome association inhibits stress-induced gene mRNA localization to stress granules, suggesting a new role for uORFs in limiting RNA condensation.

Keywords: ATF4; GADD34; RNA localization; condensate; integrated stress response; ribosome; stress granules; stress-induced genes; translation; upstream open reading frame.


Conflict of interest statement

The authors declare no competing interests.

Figures
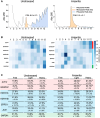
Figure 1.
Figure 1.
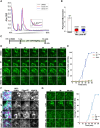
Stress-induced genes ATF4 and GADD34 are translationally upregulated during arsenite stress. (A) Representative polysome profiles of U-2 OS cells unstressed or stressed with 250 µM arsenite for 45 min, with orange shading representing the monosome peak and light blue representing polysomes. P/M is the polysome:monosome ratio of three independent experiments ±SEM Collected fractions are indicated below each profile. (B) Total RNA was isolated from the fractions shown in A, and RT-qPCR was performed. Heat maps display the average percentage of mRNA from RT-qPCR analysis in each polysome fraction corresponding to polysome profiles from unstressed and stressed cells (n = 3). Color coding represents stress-induced gene mRNAs that are translationally induced upon arsenite treatment (red), stress-induced gene mRNAs that are translationally repressed upon arsenite treatment (blue), or constitutive mRNAs that are translationally repressed upon arsenite treatment (green). (C) The average percentage of mRNA sedimenting with free (fractions 1–5), light (fractions 6–9), and heavy (fractions 10–12) polysomes ±SEM, corresponding to polysome profiles from unstressed and stressed cells (n = 3), is shown. Color coding is as in B. One-way ANOVA tests were done to determine the significance between unstressed and stressed conditions. (*) P < 0.05 and (***) P < 0.005. See also Supplemental Figures S1 and S2.
Figure 2.
Figure 2.
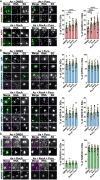
Steady-state localization of candidate stress-induced gene mRNAs to stress granules. (A–D) Stressed (250 µM arsenite for 45 or 90 min) U-2 OS cells stably expressing GFP-G3BP1 were fixed, and smFISH was performed for RNAs encoding stress-induced genes that are translationally upregulated (A,B; red), stress-induced genes that are translationally downregulated (C; blue), or constitutively expressed genes (D; green). (A) Representative images are shown of an entire cell (45 min arsenite stress). Stress granules (SGs) are shown in green, ATF4 RNA is shown in magenta, and nuclei are shown in blue. Scale bar, 10 µm. (BD, left) Representative zoomed-in images (n = 3) of cells stressed with 250 µM arsenite (As) for 45 or 90 min. Images were taken at 100× magnification, with the GFP-G3BP1 stress granule (SG) marker shown in green and RNA shown in magenta. Scale bars, 5 µm. (Right) The average ± SEM of the percentage of cytoplasmic RNA localized to stress granules per cell (n = 27 cells) from three independent experiments (denoted as green, red, and black circles, with individual circles representing a single cell) is shown. One-way ANOVA tests were done to determine the significance between 45 and 90 min arsenite conditions. (*) P < 0.05. See also Supplemental Figure S3.
Figure 3.
Figure 3.
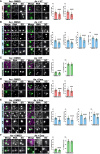
A single initiating ribosome blocks stress granule assembly. (A) Representative polysome profiles (n = 3) of U-2 OS cells treated with 0.1% DMSO (carrier; black) or 2 µg/mL harringtonine (HT) for 10 min (red) or 30 min (blue) followed by cycloheximide addition. The X-axis represents the distance down the sucrose gradient from 10% to 50%. (B) Average ± SEM is reported for the polysome to monosome ratio from polysome profiles in A from n = 3 replicates (denoted as green, red, and black circles). ANOVA tests were done to determine the significance between the DMSO and HT-treated conditions. (****) P < 0.001. (C) Schematic of experimental time line for DF (2 µg/mL harringtonine [HT] and 250 µMarsenite [As]). (D) U-2 OS cells were pretreated with DMSO or harringtonine for 30 min followed by live-cell imaging at 40× magnification with or without arsenite for 60 min. Images were taken every minute, and representative images (n = 3 for all times and conditions except the DMSO 20 min time point, which is n = 2) of U-2 OS cells stably expressing GFP-G3BP1 (green) are shown. Scale bar, 10 µm. See also Supplemental Move S1. (E) The average ± SEM of the percentage of cells in a frame positive for stress granules corresponding to images in D is shown. (F) After live-cell imaging (shown in D,E), cells were fixed and stained for polyadenylated RNA [oligo(dT); magenta] and stress granule protein UBAP2L (cyan). GFP-G3BP1 is shown in green (n = 2). Scale bar, 5 µm. See also Supplemental Figure S4. (G) U-2 OS cells were pretreated with DMSO or 50 µM lactimidomycin (LTM) for 30 min followed by live-cell imaging with or without arsenite as done in D. (Left) Representative images. Scale bar, 10 µm. (Right) The average ± SEM of the percentage of cells in a frame with stress granules (n = 3) is shown. See also Supplemental Movies S2–S4 and Supplemental Figure S5.
Figure 4.
Figure 4.
Ribosome release or inhibition of ribosome association with ATF4 or GADD34 increases their partitioning into stress granules. (AC) U-2 OS cells stably expressing GFP-G3BP1 were stressed with 250 µM arsenite (As) for 35 min followed by addition of 0.1% DMSO, 1 µM rocaglamide A (RocA), 2 µg/mL puromycin (Puro), or rocaglamide A and puromycin for 10 min. smFISH was performed on fixed cells to determine the localization of RNAs encoding stress-induced genes that are translationally upregulated (A, red), stress-induced genes that are translationally downregulated (B; blue), or constitutively expressed genes (C; green). (Left) Representative images are shown with RNA in magenta and stress granules (SGs) in green, as labeled with GFP-G3BP1. Scale bar, 5 µm. (Right) The average ± SEM of the percentage of cytoplasmic RNA localized to stress granules per cell (n = 27 cells) from three independent replicates (denoted as green, red, and black circles, with individual circles representing a single cell) is shown. One-way ANOVA tests were done to determine significance between the DMSO condition and other treatments. (*) P < 0.05, (***) P < 0.005, (****) P < 0.001. See also Supplemental Figures S3, S6, and S7.
Figure 5.
Figure 5.
Stabilizing one or more ribosomes on mRNAs reduces their localization to stress granules. (AF) U-2 OS cells stably expressing GFP-G3BP1 were stressed with 250 µM arsenite (As) for 35 min followed by addition of 0.1% DMSO, 2 µg/mL harringtonine (HT), or 45 µM emetine (Eme) for 10 min. smFISH was performed on fixed cells to determine the localization of RNAs encoding stress-induced genes that are translationally upregulated (A,D; red), stress-induced genes that are translationally downregulated (B,E; blue), or constitutively expressed genes (C,F; green). (Left) Representative images are shown with RNA in magenta and stress granules (SGs) in green (GFP-G3BP1). Scale bar, 5 µm. (Right) The average ± SEM of the percentage of cytoplasmic RNA localized to stress granules per cell (n = 27 cells) from three independent replicates (denoted as green, red, and black circles, with individual circles representing a single cell) is shown. One-way ANOVA tests were done to determine the significance between DMSO condition and other treatments. (****) P < 0.001. See also Supplemental Figures S3, S6, and S7.
Figure 6.
Figure 6.
Ribosome association inhibits localization of endogenous mRNAs with uORFs to stress granules. (A) U-2 OS cells stably expressing GFP-G3BP1 were stressed with 250 µM arsenite for 35 min followed by addition of 0.1% DMSO, 1 µM rocaglamide A (RocA), 2 µg/mL puromycin (Puro), 2 µg/mL harringtonine (HT), or 45 µM emetine. smFISH was performed on fixed cells to determine the localization of RNAs encoding stress-induced genes with uORFs (IFRD1 and UCP2) or constitutively expressed genes (ACTB and AHNAK). (Top) Representative images are shown with stress-induced gene mRNA in magenta, constitutively expressed mRNAs in cyan, nuclei in blue, and stress granules (SGs) in gray as labeled with GFP-G3BP1, with zoomed-in images below the full cell images. Scale bars, 5 µm. (Bottom) The average ± SEM of the percentage of cytoplasmic RNA localized to stress granules per cell (n = 27) from three independent replicates (denoted as green, red, and black circles, with individual circles representing a single cell) is shown. One-way ANOVA tests were done to determine the significance between the DMSO condition and other treatments. (*) P < 0.05, (****) P < 0.001. (B) Summary of the average percentage change of stress granule localization for every endogenous mRNA tested under the different inhibitor treatments compared with the control DMSO treatment (n = 3). Green bars represent constitutively expressed mRNAs, blue represents stress-induced gene mRNAs that are translationally downregulated, and red represents uORF-containing stress-induced gene mRNAs. See also Supplemental Figures S3 and S6.
Figure 7.
Figure 7.
Ribosome association inhibits localization of reporter mRNAs containing ATF4 or GADD34 uORFs to stress granules. (A) Schematic of wild-type (WT) and mutant (Mut) ATF4 and GADD34 uORF reporter constructs. Green represents start codons, red represents stop codons, pink represents uORF sequences, and purple represents the main human-optimized Renilla luciferase (Luc) ORF. All 5′ UTR (uORF) start codons were mutated from ATG (Met) to GCC (Ala) in the Mut-ORF constructs to ablate uORFs. (B) U-2 OS cells stably expressing the reporters described in A under a dox-inducible promoter and GFP-G3BP1 to mark stress granules were treated with 200 ng/mL doxycycline for 24 h and stressed with 250 µM arsenite for 35 min followed by cotreatment with 0.1% DMSO, 1 µM rocaglamide A (RocA), 2 µg/mL puromycin (Puro), 2 µg/mL harringtonine (HT), or 45 µM emetine (Eme) for 10 min. smFISH was performed on fixed cells to determine the localization of Luc RNAs to stress granules. (Top) Representative images are shown with RNA in magenta and stress granules (SGs) in green. Scale bar, 5 µm. (Bottom) The average ± SEM of the percentage of cytoplasmic RNA localized to stress granules per cell (n = 41–53 cells) from three independent replicates (denoted as green, red, and black circles, with individual circles representing a single cell) is shown. One-way ANOVA tests were done to determine the significance between the DMSO condition and other treatments. (*) P < 0.05, (****) P < 0.001. (C) The average percentage change in stress granule localization from n = 3 independent experiments is shown for the reporters and conditions described in A and B.

References

    1. Abadi M, Barham P, Chen J, Chen Z, Davis A, Dean J, Devin M, Ghemawat S, Irving G, Isard M, et al. 2016. TensorFlow: a system for large-scale machine learning. OSDI'16: Proceedings of the 12th USENIX Symposium on Operating Systems Design and Implementation, pp. 265–283. USENIX Association, San Francisco. https://www.usenix.org/system/files/conference/osdi16/osdi16-abadi.pdf
    1. Abastado JP, Miller PF, Jackson BM, Hinnebusch AG. 1991. Suppression of ribosomal reinitiation at upstream open reading frames in amino acid-starved cells forms the basis for GCN4 translational control. Mol Cell Biol 11: 486–496. 10.1128/mcb.11.1.486-496.1991 - DOI - PMC - PubMed
    1. Adivarahan S, Livingston N, Nicholson B, Rahman S, Wu B, Rissland OS, Zenklusen D. 2018. Spatial organization of single mRNPs at different stages of the gene expression pathway. Mol Cell 72: 727–738.e5. 10.1016/j.molcel.2018.10.010 - DOI - PMC - PubMed
    1. Adjibade P, St-Sauveur VG, Quevillon Huberdeau M, Fournier M-J, Savard A, Coudert L, Khandjian EW, Mazroui R. 2015. Sorafenib, a multikinase inhibitor, induces formation of stress granules in hepatocarcinoma cells. Oncotarget 6: 43927–43943. 10.18632/oncotarget.5980 - DOI - PMC - PubMed
    1. Andreev DE, O'Connor PBF, Fahey C, Kenny EM, Terenin IM, Dmitriev SE, Cormican P, Morris DW, Shatsky IN, Baranov PV. 2015. Translation of 5′ leaders is pervasive in genes resistant to eIF2 repression. eLife 4: e03971. 10.7554/eLife.03971 - DOI - PMC - PubMed

MeSH terms

LinkOut - more resources