. 2025 May 29;12(5):ENEURO.0565-24.2025.
doi: 10.1523/ENEURO.0565-24.2025. Print 2025 May.

A Preprocessing Toolbox for 2-Photon Subcellular Calcium Imaging

Affiliations

A Preprocessing Toolbox for 2-Photon Subcellular Calcium Imaging

Anqi Jiang et al. eNeuro. .

Erratum in

Abstract

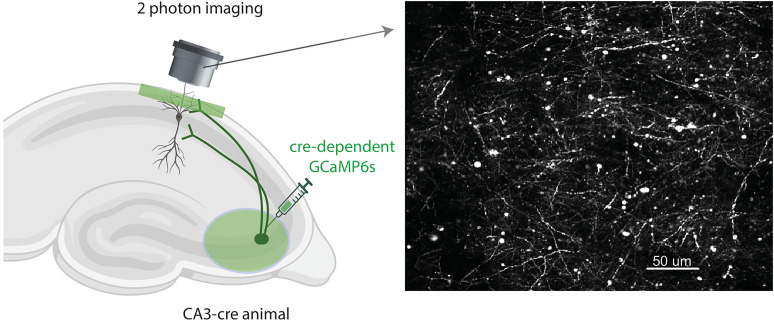
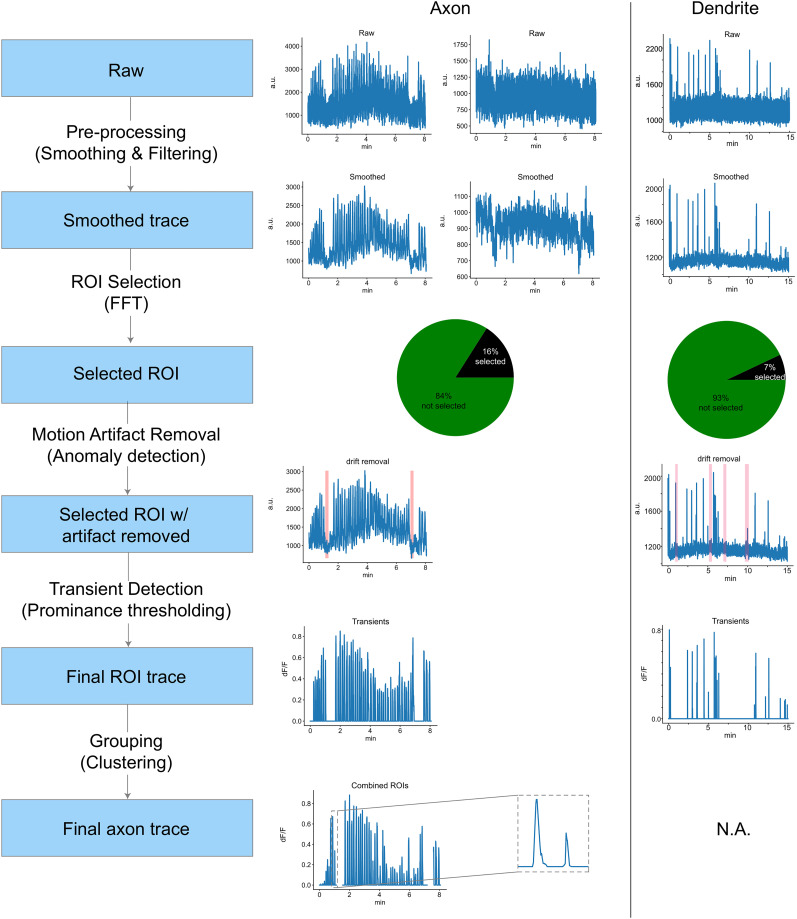
Recording the spiking activity from subcellular compartments of neurons such as axons and dendrites during mouse behavior with 2-photon calcium imaging is increasingly common yet remains challenging due to low signal-to-noise, inaccurate region-of-interest (ROI) identification, movement artifacts, and difficulty in grouping ROIs from the same neuron. To address these issues, we present a computationally efficient preprocessing pipeline for subcellular signal detection, movement artifact identification, and ROI grouping. For subcellular signal detection, we capture the frequency profile of calcium transient dynamics by applying fast Fourier transform (FFT) on smoothed time-series calcium traces collected from axon ROIs. We then apply bandpass filtering methods (e.g., 0.05-0.12 Hz) to select ROIs that contain frequencies that match the power band of transients. To remove motion artifacts from z-plane movement, we apply principal component analysis on all calcium traces and use a bottom-up segmentation change-point detection model on the first principal component. After removing movement artifacts, we further identify calcium transients from noise by analyzing their prominence and duration. Finally, ROIs with high activity correlation are grouped using hierarchical or k-means clustering. Using axon ROIs in the CA1 region, we confirm that both clustering methods effectively determine the optimal number of clusters in pairwise correlation matrices, yielding similar groupings to "ground truth" data. Our approach provides a guideline for standardizing the extraction of physiological signals from subcellular compartments during rodent behavior with 2-photon calcium imaging.

Keywords: 2-photon; axons; calcium imaging; dendrites; subcellular.


Conflict of interest statement

The authors declare no competing financial interests.

Figures

Figure 1.
Figure 1.
Imaging CA3 axons in CA1. Left, Schematic representation of CA3 axonal imaging in CA1 stratum oriens. Right, Example CA1 field of view containing CA3 axons. Image is the max projection from 5,000 frames.
Figure 2.
Figure 2.
Example time-series fluorescent traces from CA3 axons in CA1 before and after smoothing. A, Example raw fluorescent time-series trace from an ROI identified by Suite2P. B, The same trace after smoothing using the Savitzky–Golay filter.
Figure 3.
Figure 3.
Frequency band-based axon ROI selection. A, Examples of selected (black) and discarded (green) ROIs in time domain after smoothing. B, Same ROIs (first row in A) in frequency domain. The x-axis displays the frequency of the FFT transformation, and the y-axis displays the normalized power. Note, the black ROI has a higher power in the frequency band of interest (shaded in blue) and lower power in the noise frequency (shaded in gray) while the discarded ROI is the opposite. C, The distribution of normalized band power within the frequency band of interest (0.03–0.13 Hz) for all example ROIs from a single FOV. The ROIs with lower power in the frequency band interest (below 0.3; dashed line) were discarded, and the ROIs with higher power in the band of interest (above 0.3) were selected.
Figure 4.
Figure 4.
Identification of movement artifacts in time-series traces. A, First principal component on z-scored ROI activities. All selected ROI activities were first standardized to z-score and then dimension reduced to the first component of PCA. Bottom-up algorithm was used to segment and detect anomalies (identified anomaly period shaded in red). B, C, Identified periods for potential movement artifacts were superimposed on individual ROI activities for visual inspection. Two example selected ROI standardized activities are plotted and red shaded indicate potential periods of movement artifacts. All activities during the red shaded time period can then be ignored or removed from further data analysis. Note that the two example cells had activities in different directions but synchronous in time. D, Identified time periods for movement artifacts on red channel as further verification.
Figure 5.
Figure 5.
Baseline correction and peak detection. All ROI activities were scaled to baseline to create ΔF/F traces. Baseline-corrected ΔF/F traces across time were generated using sliding window of ∼20 s and the 8% percentile value within the sliding window was subtracted from each timepoint. Across the baseline-corrected ΔF/F traces, peaks were calculated using minimum height, distance, and prominence values. Of all potential peaks, only detected peaks (black) were kept and all other activities (green) were forced to 0.
Figure 6.
Figure 6.
Comparison of clustering methods used for grouping ROIs. A, Clustering performance metrics with hierarchical clustering and k-means clustering. The left panel shows that hierarchical clustering converged to a similar optimal number of clusters (peak pointed by the arrows) for both performance metrics, Silhouette scores and AMI. The right panel showed that k-means clustering converged to a similar optimal number of clusters for both performance metrics, Silhouette scores and AMI. B, Example grouping from hierarchical clustering transposed to original FOV. Left, Each color represents an individual ROI in the group. Right: all ROIs in the same group highlighted in yellow. C, Same grouping from “ground truth” data.
Figure 7.
Figure 7.
SUBPREP pipeline summary. Axon (middle) and dendrite (right) example traces are shown being processed as they move through the SUBPREP pipeline.

Update of

Similar articles

References

    1. Bilash OM, Chavlis S, Johnson CD, Poirazi P, Basu J (2023) Lateral entorhinal cortex inputs modulate hippocampal dendritic excitability by recruiting a local disinhibitory microcircuit. Cell Rep 42:111962. 10.1016/j.celrep.2022.111962 - DOI - PMC - PubMed
    1. Bowler JC, Losonczy A (2022) Direct cortical inputs to hippocampal area CA1 transmit complementary signals for goal-directed navigation. bioRxiv.
    1. Chen TW, , et al. (2013) Ultrasensitive fluorescent proteins for imaging neuronal activity. Nature 499:295–300. 10.1038/nature1235 - DOI - PMC - PubMed
    1. Cichon J, Gan WB (2015) Branch-specific dendritic Ca(2+) spikes cause persistent synaptic plasticity. Nature 520:180–185. 10.1038/nature14251 - DOI - PMC - PubMed
    1. Dragoi G, Buzsáki G (2006) Temporal encoding of place sequences by hippocampal cell assemblies. Neuron 50:145–157. 10.1016/j.neuron.2006.02.023 - DOI - PubMed

LinkOut - more resources