. 2025 May 13;11(1):47.
doi: 10.1038/s41421-025-00797-x.

Structural insight into the self-activation and G-protein coupling of P2Y2 receptor

Affiliations

Structural insight into the self-activation and G-protein coupling of P2Y2 receptor

Baoliang Lan et al. Cell Discov. .

Abstract

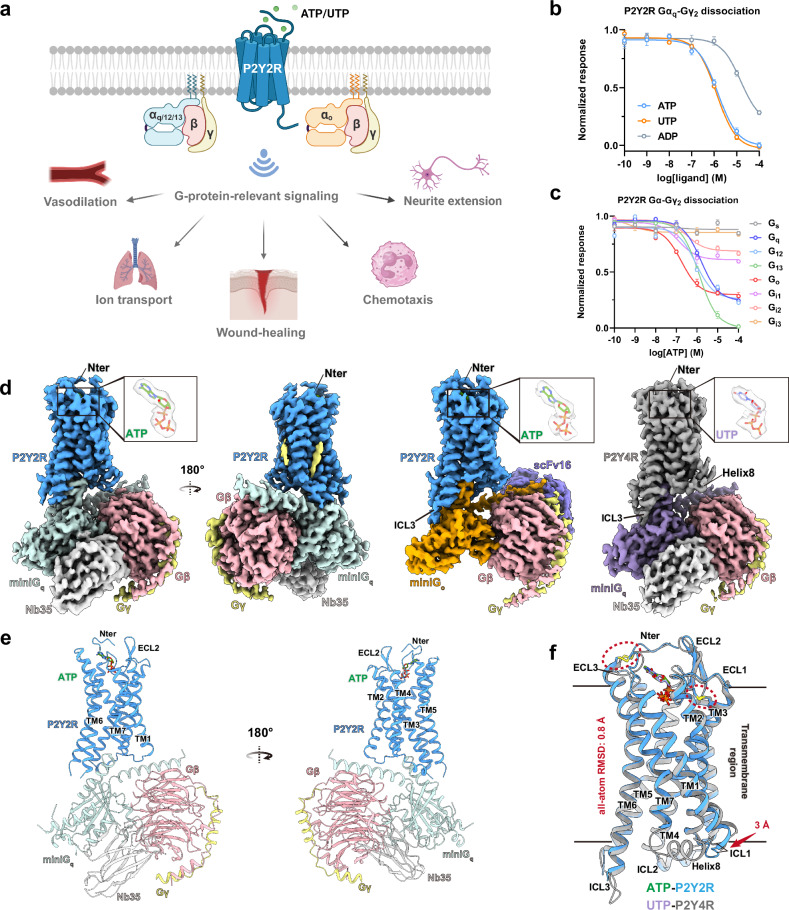
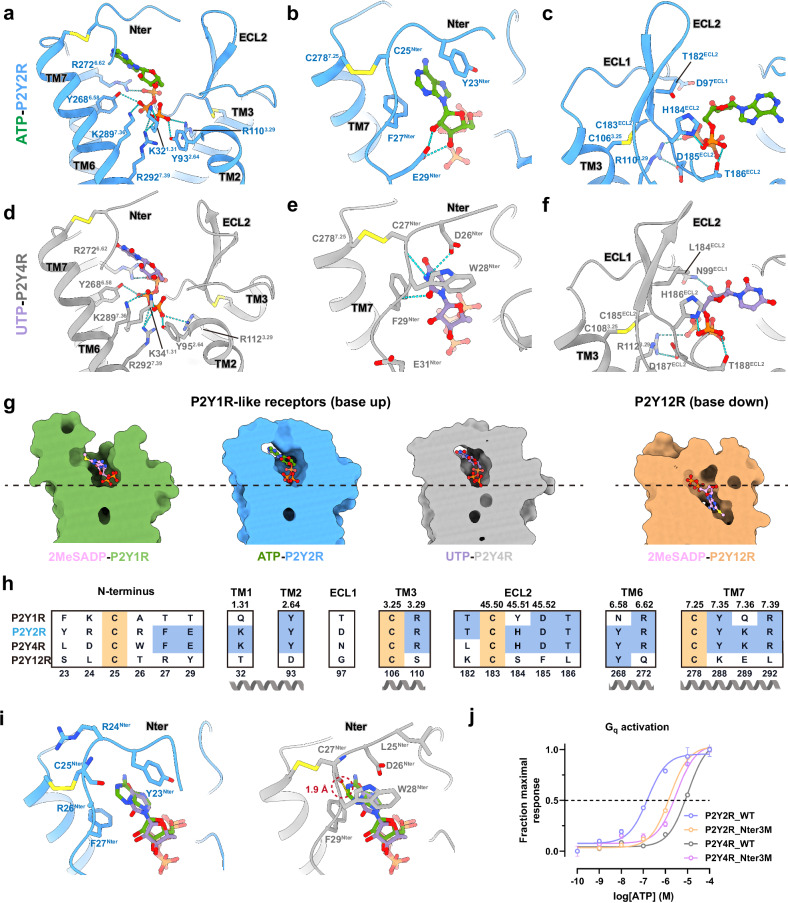
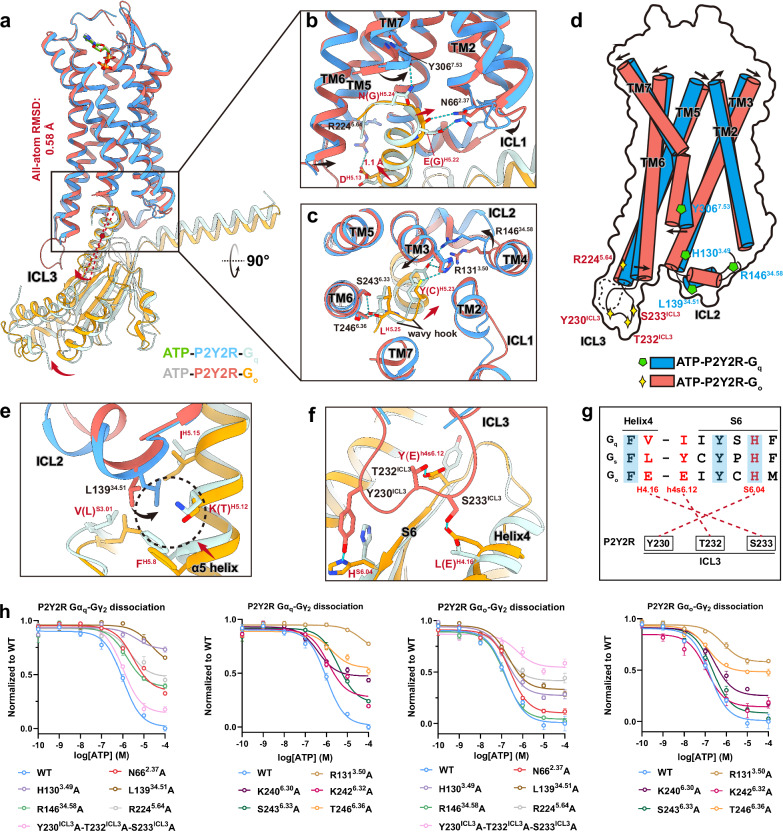
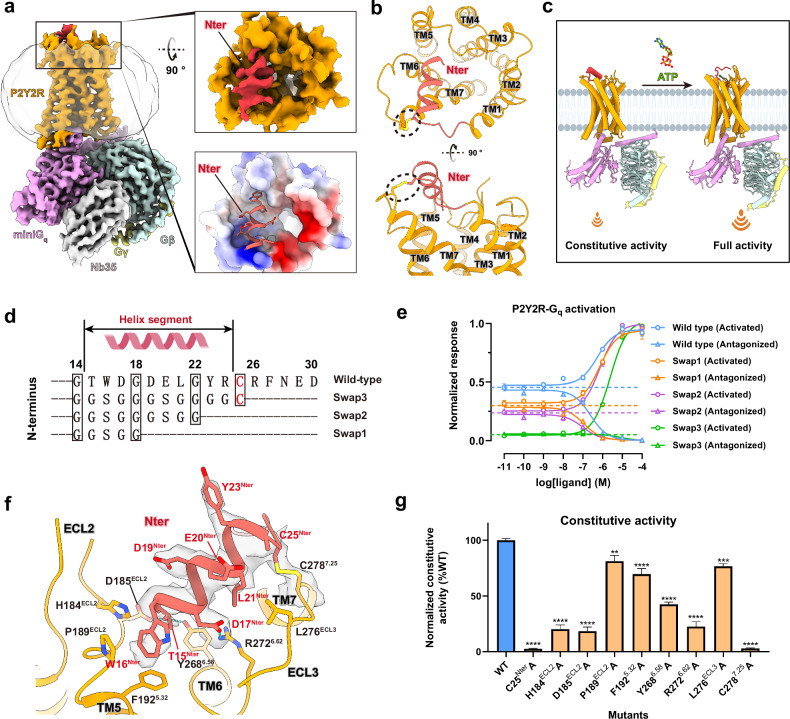
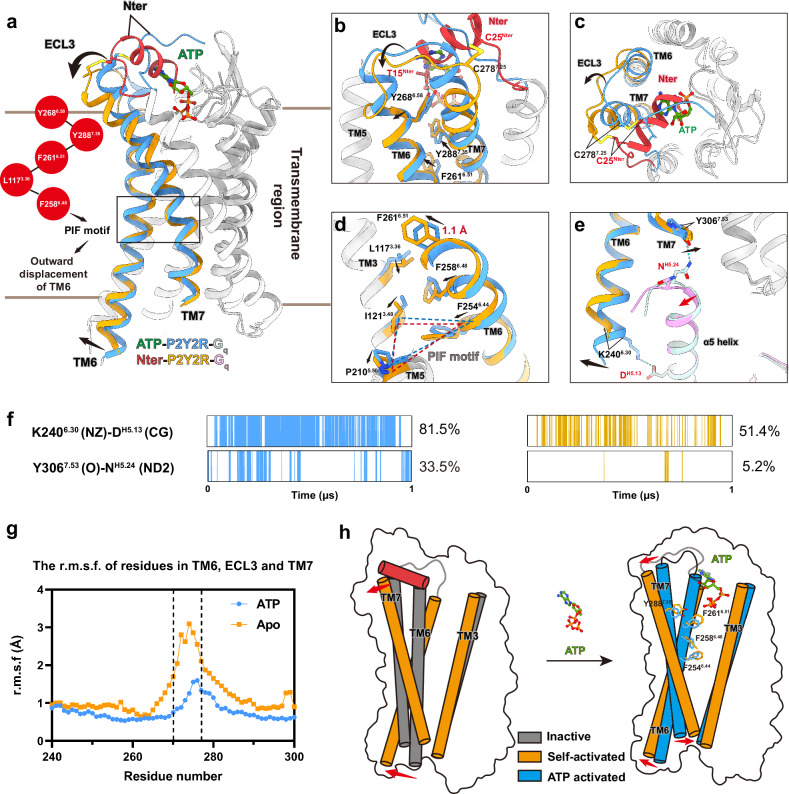
Purinergic P2Y2 receptor (P2Y2R) represents a typically extracellular ATP and UTP sensor for mediating purinergic signaling. Despite its importance as a pharmacological target, the molecular mechanisms underlying ligand recognition and G-protein coupling have remained elusive due to lack of structural information. In this study, we determined the cryo-electron microscopy (cryo-EM) structures of the apo P2Y2R in complex with Gq, ATP-bound P2Y2R in complex with Gq or Go, and UTP-bound P2Y4R in complex with Gq. These structures reveal the similarities and distinctions of ligand recognition within the P2Y receptor family. Furthermore, a comprehensive analysis of G-protein coupling reveals that P2Y2R exhibits promiscuity in coupling with both Gq and Go proteins. Combining molecular dynamics simulations and signaling assays, we elucidate the molecular mechanisms by which P2Y2R differentiates pathway-specific Gq or Go coupling through distinct structural components on the intracellular side. Strikingly, we identify a helix-like segment within the N-terminus that occupies the orthosteric ligand-binding pocket of P2Y2R, accounting for its self-activation. Taken together, these findings provide a molecular framework for understanding the activation mechanism of P2Y2R, encompassing ligand recognition, G-protein coupling, and a novel N-terminus-mediated self-activation mechanism.


Conflict of interest statement

Conflict of interest: The authors declare no competing interests.

Figures

Fig. 1
Fig. 1. Signaling profiles and cryo-EM structures of ATP–P2Y2R–Gq, ATP–P2Y2R–Go, and UTP–P2Y4R–Gq complexes.
a Illustration of G-protein signaling pathways of the P2Y2R and related functions. Created with BioRender.com. b, c Dose-response curves for P2Y2R in response to distinct ligands (b) and its coupling to respective G-protein subtypes (c) measured by NanoBiT-based G-protein dissociation assay. The data represent mean ± SEM of three independent experimental replicates (n = 3). The fold change in luminescence value after agonist treatment, relative to the basal level, is used to reflect receptor activation and is normalized to the fraction of maximal response. A detailed statistical evaluation is listed in Supplementary Tables S1 and S2. d Cryo-EM density maps of the ATP–P2Y2R–miniGq–Nb35, ATP–P2Y2R–miniGo–scFv16, and UTP–P2Y4R–miniGq–Nb35 complexes, colored according to different subunits. ATP (green) and UTP (purple) are shown in close-up views with models fitted into their cryo-EM density maps. The map of the ATP–P2Y2R–miniGq–Nb35 complex is displayed from the front and back views, with two sterol-like densities highlighted in yellow. e Cartoon representation of the ATP–P2Y2R–miniGq–Nb35 complex structure from the front and back views. f Structural superposition of the ATP-bound P2Y2R–Gq–Nb35 and UTP-bound P2Y4R–Gq–Nb35 complexes. The receptors from the two structures are aligned and displayed. Other subunits are omitted for clarity. P2Y2R is colored in blue, and P2Y4R is in gray. Conformational changes of TM1 and ICL1 are indicated by red arrows, and the two disulfide bonds are highlighted within a red dashed circle.
Fig. 2
Fig. 2. Molecular recognition of ATP and UTP by P2Y2R and P2Y4R.
ac Interactions between ATP and the transmembrane core (a), N-terminus (b), and ECL2 (c) of P2Y2R. Polar interactions, including hydrogen bonds and salt bridges, are depicted as light blue dashed lines. Disulfide bonds are represented as yellow sticks. df Interactions between UTP and the transmembrane core (d), N-terminus (e), ECL1 and ECL2 (f) of P2Y4R. g Comparison of the ligand-binding pockets of four P2YRs: P2Y1R (PDB: 7XXH), P2Y2R (this study), P2Y4R (this study), and P2Y12R (PDB: 7XXI). The ligands bound to each receptor are depicted as follows: 2MeSADP (pink) for P2Y1R and P2Y12R, ATP (green) for P2Y2R, and UTP (purple) for P2Y4R. A black dashed line drawn from the bottom of ligand-binding pocket of P2Y2R serves as a reference to compare the depth of the ligand-binding pockets of different P2YRs. h Sequence alignment of the ligand-binding pockets of four P2YRs: P2Y1R, P2Y2R, P2Y4R, and P2Y12R. The conserved residues are highlighted in wheat or light blue. i Comparison of the N-terminal sub-pockets between ATP-bound P2Y2R–Gq and UTP-bound P2Y4R–Gq structures. Receptors are aligned, and two views in the same orientation display the overlay of ATP and UTP in the sub-pocket formed by N-terminus in P2Y2R or P2Y4R. For clarity, the cartoon form of one receptor is shown while the other is hidden. j Mutational effects of P2Y2R_Nter3M (Y23NterL-R24NterD-R26NterW triple mutation in P2Y2R) and P2Y4R_Nter3M (L25NterY-D26NterR-W28NterR triple mutation in P2Y4R) on activation potency for both receptors in response to ATP. This experiment was performed using the Gs/q-based cAMP accumulation assay, and a detailed description is provided in Materials and Methods. The difference of luminescence intensity before and after agonist treatment is used to reflect receptor activation and is normalized to the maximal response. The dose-response curse represents the global fit of mean ± SEM from grouped data with three independent experimental replicates (n = 3). A detailed statistical evaluation is listed in Supplementary Table S4.
Fig. 3
Fig. 3. Molecular determinants of the P2Y2R Gq and Go couplings.
a Structural superimposition of ATP–P2Y2R–Gq and ATP–P2Y2R–Go complexes. The red arrows indicate the conformational changes of miniGq and miniGo proteins when aligning the receptors of the two structures. b, c Close-up representations of the interfaces between the P2Y2R and the α5 helices of Gq and Go proteins in side view (b) and top view (c). The black arrows indicate the conformational changes of P2Y2R when coupling to Gq or Go protein. The red curved arrows indicate the rotational shift of the α5 helix from Gq to Go. The side chains of residues that exhibit different interactions in P2Y2R–Gq or –Go interfaces are depicted as sticks. Polar interactions are represented as light blue dashed lines. Hereafter, for G-proteins, the residues labeled outside the parentheses correspond to Gq, and the ones inside correspond to Go. d Schematic representation of the conformational changes of P2Y2R and key interface residues that display distinct interactions in Gq and Go couplings. The residues that specifically interact with Gq are depicted as green pentagons, whereas the residues that specifically interact with Go are depicted as yellow four-pointed star. e Hydrophobic interactions of residue L13934.51 in ICL2 with Gq and Go proteins. The rotational shift of residue L13934.51 from the Go-coupled state to the Gq-coupled state is indicated by a black curved arrow. f Polar interactions between ICL3 of the receptor and Go proteins. The hydrogen bond interactions between ICL3 and Go are shown as blue dashed lines, with the corresponding residues depicted as sticks. g Schematic representation of specific interactions between ICL3 and Go protein. In the sequence alignment of Go, Gq, and Gs proteins, interaction residues in Go and their equivalents in Gq and Gs are highlighted in red. Conserved residues across different G-protein subtypes are indicated by a light blue background. h Effects of alanine mutations of residues in the P2Y2R–G-protein interfaces on Gαq–Gγ2 or Gαo–Gγ2 dissociation induced by ATP, compared to WT receptor. The dose-response curves represent the global fit of mean ± SEM from grouped data with three independent experimental replicates (n = 3). A detailed statistical evaluation is listed in Supplementary Table S6.
Fig. 4
Fig. 4. N-terminus-induced self-activation of P2Y2R.
a Cryo-EM density map of P2Y2R–Gq complex in apo state with a ‘built-in’ N-terminus (Red). The black box highlights the N-terminus region, and a close-up view is shown on the right. The top right graph depicts the cryo-EM density map of the N-terminus (red) and other regions of the receptor (orange) from a top view. The bottom right graph depicts the electrostatic potential of the N-terminus binding surface, which is colored from red (negative charge) to blue (positive charge). b Cartoon representation of the top and side views of P2Y2R in its apo state, showing the overall interaction mode of the N-terminus (red) and other regions of P2Y2R (orange). The disulfide bond linking the N-terminus and TM7 is depicted as yellow sticks. c Schematic representation of N-terminus-induced self-activation and ATP-induced full activation of receptor. d Protein sequence of the helix-like segment in the P2Y2R N-terminus, featuring three parts spaced by glycine. The corresponding replacements of three grouped residues by a ‘GS’ linker progressively created three mutants: swap1, swap2, and swap3. e Effects of the three swapped mutants of N-terminus (d) on the constitutive activity of P2Y2R, according to a Gs/q-based cAMP accumulation assay. The constitutive activity of the P2Y2R is assessed using a potent agonist (ATP) and antagonist (AR-C 118925XX), with luminescence values normalized to 100% for the highest ATP concentration and 0% for the highest AR-C 118925XX concentration. Each data point represents mean ± SEM from three independent replicates (n = 3). A detailed statistical evaluation is listed in Supplementary Table S7. f Detailed interactions between the N-terminus and other regions of the receptor are shown, with polar contacts depicted as blue dashed lines. The cryo-EM density maps for the N-terminal helix segment (from T15Nter to R24Nter) and the linked disulfide bond (C25Nter–C2787.25) are depicted as gray surface. g Effects of mutations of key residues in the interface between N-terminus and other regions of receptor on the constitutive activity. The luminescence values achieved by vehicle treatment are normalized to those achieved by full activation or antagonism. Each data point represents mean ± SEM from three independent replicates (n = 3), each performed in triplicate. A detailed statistical evaluation is listed in Supplementary Table S8.
Fig. 5
Fig. 5. Different conformations of P2Y2R in the self-activated and fully activated states.
a Structural superposition of the apo P2Y2R–Gq and ATP-bound P2Y2R–Gq complexes in side view. Receptors are aligned. For clarity, transmembrane helices TM6 and TM7 are highlighted in blue for the fully activated state and in orange for the self-activated state, while other TMs are colored in light gray. The movements of the TMs are indicated by black arrows, and key residues mediating conformational changes are displayed in the red circles. The binding pocket of the N-terminus (red) in the self-activated state is compared with that of ATP (green) in fully activated state. b, c Close-up representations of the N-terminus bound to the extracellular side of TM6 and TM7 in the self-activated state, compared with the ATP-bound fully activated state, are shown from the side (b) and top views (c). Key residues in P2Y2R mediating conformational changes are highlighted as sticks. The black arrows indicate the conformational changes of P2Y2R from the fully activated state to the self-activated state. Polar contacts are depicted as blue dashed lines. d Structure rearrangement of the conserved PIF motif in the self-activated state compared with the ATP-bound state. Key residues mediating the structure rearrangement are highlighted as sticks, and their conformational changes are indicated by black arrows. e Comparison of the P2Y2R–Gq interfaces in the self-activated state and the ATP-bound fully activated state. The movements of the α5 helix of the Gq and the TMs of the receptor are indicated by red and black arrows, respectively. Key residues displaying different interactions in these two states are highlighted as sticks. Polar contacts are depicted as blue dashed lines. f Comparison of two polar contacts of the receptor–G-protein interfaces in the ATP-bound P2Y2R–Gq complex and the N-terminus-occupied P2Y2R–Gq complex through MD simulations. One representative trace plot is displayed to illustrate this. The corresponding percentage values on the right represent the mean calculated from three independent simulations, each 3 µs in length. A detailed statistical evaluation for the data from three runs of MD simulation is listed in Supplementary Table S13. g The flexibility of TM6 and TM7 of P2Y2R in the self-activated state (labeled as ‘apo’) and the ATP-bound fully activated state (labeled as ‘ATP’) is quantified by MD simulations. The RMSF values of residues from K2406.30 to C3007.47 are shown, with the ECL3 region (residues S270–S277) highlighted by black dashed lines. h Schematic representation of the conformation of the P2Y2R in the AlphaFold2-predicted inactive, self-activated, and fully activated states. The conformational changes of transmembrane helices in the self-activated state relative to the inactive state and fully activated state are indicated by red arrows. Residues in TM6 and TM7 associated with activation are highlighted as sticks.

Similar articles

References

    1. Burnstock, G. & Verkhratsky, A. Evolutionary origins of the purinergic signalling system. Acta Physiol.195, 415–447 (2009). - PubMed
    1. Alexander, S. P. H. et al. The concise guide to pharmacology 2019/20: G protein-coupled receptors. Br. J. Pharm.176, S21–S141 (2019). - PMC - PubMed
    1. Rafehi, M. & Muller, C. E. Tools and drugs for uracil nucleotide-activated P2Y receptors. Pharm. Ther.190, 24–80 (2018). - PubMed
    1. Molliver, D. C., Cook, S. P., Carlsten, J. A., Wright, D. E. & McCleskey, E. W. ATP and UTP excite sensory neurons and induce CREB phosphorylation through the metabotropic receptor, P2Y2. Eur. J. Neurosci.16, 1850–1860 (2002). - PubMed
    1. Junger, W. G. Immune cell regulation by autocrine purinergic signalling. Nat. Rev. Immunol.11, 201–212 (2011). - PMC - PubMed

LinkOut - more resources