. 2025 May 13;11(1):46.
doi: 10.1038/s41421-025-00796-y.

Psychological stress-induced systemic corticosterone directly sabotages intestinal stem cells and exacerbates colitis

Affiliations

Psychological stress-induced systemic corticosterone directly sabotages intestinal stem cells and exacerbates colitis

Xiaole Sheng et al. Cell Discov. .

Abstract

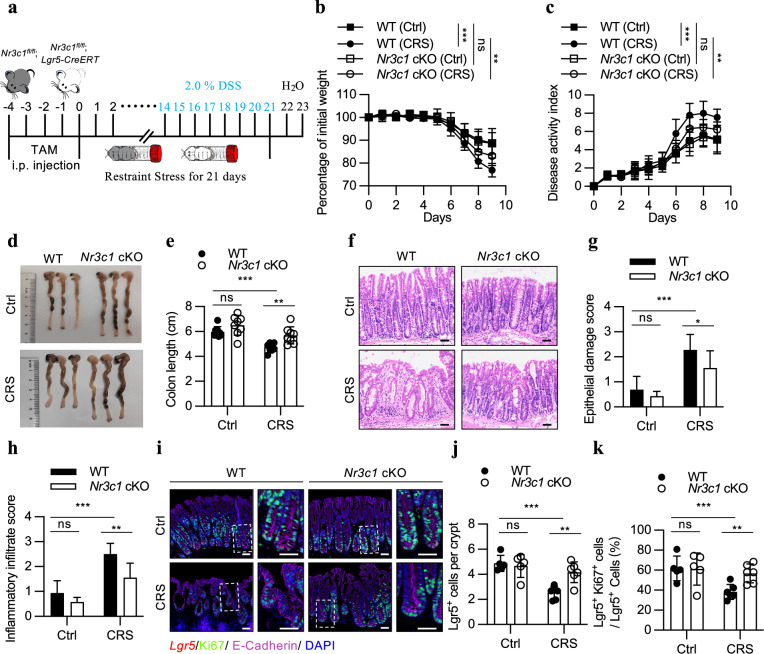
Psychological stress has profound impacts on the gastrointestinal tract via the brain‒gut axis. However, its effects on intestinal stem cells (ISCs) and the resulting implication for intestinal homeostasis remain poorly understood. Here, we observed a notable reduction in both the quantity and proliferative capacity of ISCs under chronic stress conditions, driven by elevated levels of corticosterone resulting from activation of the hypothalamic‒pituitary‒adrenal (HPA) axis. Mechanistically, corticosterone directly interacts with its receptor, nuclear receptor subfamily 3 group c member 1 (NR3C1), leading to increased expression of FKBP prolyl isomerase 5 (FKBP5) in ISCs. Subsequently, FKBP5 negatively regulates AKT activation by facilitating its dephosphorylation at Ser473, ultimately enhancing nuclear translocation of forkhead box O (FoxO) and inhibiting ISC proliferative activity. Consequently, ISC dysfunction contributes to the stress-driven exacerbation of DSS-induced colitis. Collectively, these findings reveal an intrinsic brain-to-gut regulatory pathway whereby psychological stress impairs ISC activity via corticosterone elevation, providing a mechanistic explanation for stress-enhanced susceptibility to colitis.


Conflict of interest statement

Conflict of interest: The authors declare no competing interests.

Figures

Fig. 1
Fig. 1. Chronic stress impairs intestinal stem cells (ISCs).
a, b Hematoxylin and eosin (H&E) staining (a) and quantification of crypt depth (b) in the jejuna of control (Ctrl) and chronic restraint stress (CRS)-treated mice (n = 5). Scale bar: 50 µm. c, d Ki-67 staining (c) and quantification of Ki-67+ cells per crypt (d) in the jejuna of the Ctrl and CRS-treated mice (n = 5). Scale bar: 20 µm. e, f 5-Ethynyl-2’-deoxyuridine (EdU) staining after pulse labeling for 1.5 h (e) and quantification of EdU+ cells per crypt (f) in the jejuna of the Ctrl and CRS-treated mice (n = 5). Scale bar: 20 µm. g, h Representative flow cytometric plots showing Lgr5-EGFP+ cells (g) and quantification of the percentage of ISCs (Lgr5-EGFPHigh) and progenitor cells (Lgr5-EGFPLow) (h) in the small intestine of the Ctrl and CRS-treated Lgr5-EGFP-IRES-creERT2 mice (n = 5). i, j Olfm4 staining (i) and quantification of Olfm4+ cells per crypt (j) in the jejuna of the Ctrl and CRS-treated mice (n = 5). Scale bar: 20 µm. k, l EdU and Olfm4 co-staining (k) and quantification of the proportion of EdU+ Olfm4+ cells (l) in the jejuna of the Ctrl and CRS-treated mice (n = 5). Scale bar: 20 µm. mp Representative images of day 4 organoids (m) and quantification of organoid formation (n), bud number (o) and surface area (p) from the Ctrl and CRS-treated mice (n = 5). Scale bar: 100 µm. The data are presented as the mean ± SD. The statistical analysis was performed by an unpaired two-tailed Student’s t-test for normally distributed data or the Mann‒Whitney test for non-normally distributed data. ns, p ≥ 0.05, *p < 0.05, **p < 0.01, ***p < 0.001.
Fig. 2
Fig. 2. Removal of adrenal glands counteracts the effect of stress on ISCs.
a, b H&E staining (a) and quantification of crypt depth (b) in the jejuna of Sham + Ctrl (n = 4), Sham + CRS (n = 5), ADX + Ctrl (n = 4) and ADX + CRS (n = 5) mice. ADX adrenalectomize. Scale bar: 50 µm. c, d Ki-67 staining (c) and quantification of Ki-67+ cells per crypt (d) in the jejuna of Sham + Ctrl (n = 5), Sham + CRS (n = 5), ADX + Ctrl (n = 4) and ADX + CRS (n = 5) mice. Scale bar: 20 µm. e, f Representative flow cytometric plots for Lgr5-EGFP+ cells (e) and quantification of the percentage of ISCs (Lgr5-EGFPHigh) (f) in the small intestine of the Sham + Ctrl, Sham + CRS, ADX + Ctrl and ADX + CRS Lgr5-EGFP-IRES-creERT2 mice (n = 6). g, h EdU and Olfm4 staining (g) and quantification of the proportion of EdU+ Olfm4+ cells (h) in the jejuna of the Sham + Ctrl (n = 5), Sham + CRS (n = 5), ADX + Ctrl (n = 4) and ADX + CRS (n = 5) mice. EdU (0.2 mg/25 g body weight) was administered to mice 1.5 h prior to sacrifice. Scale bar: 20 µm. il Representative images of day 4 organoids (i) and quantification of organoid formation (j), bud number (k) and surface area (l) from the Sham + Ctrl, Sham + CRS, ADX + Ctrl and ADX + CRS mice (n = 4). Scale bar: 100 µm. The data are presented as the mean ± SD. The statistical analysis was performed by an unpaired two-tailed Student’s t-test for normally distributed data or the Mann‒Whitney test for nonnormally distributed data. ns, p ≥ 0.05, *p < 0.05, **p < 0.01, ***p < 0.001.
Fig. 3
Fig. 3. Corticosterone reproduces the effect of stress on ISCs.
a Schematic representation of CORT administration. C57BL/6 mice were injected intraperitoneally with CORT (5 mg/kg) or vehicle once daily for 3 weeks at varying times of the day. CORT corticosterone. b Plasma CORT levels in mice measured 3 h after a single vehicle or CORT injection (n = 4). c, d H&E staining (c) and quantification of crypt depth (d) in the jejuna of the vehicle (n = 4) and CORT-treated (n = 5) mice. Scale bar: 50 µm. e, f Ki-67 staining (e) and quantification of Ki-67+ cells per crypt (f) in the jejuna of the vehicle (n = 4)- and CORT-treated (n = 5) mice. Scale bar: 20 µm. g, h Representative flow cytometric plots showing EGFP+ cells (g) and quantification of the percentage of ISCs (Lgr5-EGFPHigh) and progenitor cells (Lgr5-EGFPLow) (h) in the small intestine of the vehicle- and CORT-treated Lgr5-EGFP-IRES-creERT2 mice (n = 6). i, j Olfm4 staining (i) and quantification of Olfm4+ cells per crypt (j) in the jejuna of the vehicle (n = 4)- and CORT (n = 5)-treated mice. Scale bar: 20 µm. km EdU and Olfm4 co-staining (k), quantification of EdU+ cells per crypt (l) and the percentage of EdU+ Olfm4+ cells (m) in the jejuna of the vehicle- (n = 4) and CORT (n = 5)-treated mice. EdU (0.2 mg/25 g body weight) was administered to mice 1.5 h prior to sacrifice. Scale bar: 20 µm. nq Representative images of day 4 organoids (n) and quantification of organoid formation (o), bud number (p) and surface area (q) from the vehicle- and CORT-treated mice (n = 3). Scale bar: 100 µm. The data are presented as the mean ± SD. The statistical analysis was performed by an unpaired two-tailed Student’s t-test for normally distributed data or the Mann‒Whitney test for non-normally distributed data. ns, p ≥ 0.05, *p < 0.05, **p < 0.01, ***p < 0.001.
Fig. 4
Fig. 4. Stress-induced corticosterone impairs ISCs via NR3C1.
a, b H&E staining (a) and quantification of crypt depth (b) in the jejuna of WT (Nr3c1fl/fl) + Ctrl (n = 4), WT + CRS (n = 5), Nr3c1 cKO (Lgr5;Nr3c1fl/fl) + Ctrl (n = 3) and Nr3c1 cKO+CRS (n = 4) mice. Scale bar: 50 µm. c, d Ki-67 staining (c) and quantification of Ki-67+ cells per crypt (d) in the jejuna of the WT + Ctrl (n = 4), WT + CRS (n = 5), Nr3c1 cKO + Ctrl (n = 3) and Nr3c1 cKO + CRS (n = 3) mice. Scale bar: 10 µm. e, f Olfm4 staining (e) and quantification of Olfm4+ cells per crypt (f) in the jejuna of the WT + Ctrl (n = 4), WT + CRS (n = 5), Nr3c1 cKO + Ctrl (n = 3) and Nr3c1 cKO + CRS (n = 3) mice. Scale bar: 10 µm. g, h EdU and Olfm4 co-staining (g) and the proportion of EdU+Olfm4+ cells per crypt (h) in the jejuna of the WT + Ctrl (n = 4), WT + CRS (n = 4), Nr3c1 cKO + Ctrl (n = 3) and Nr3c1 cKO + CRS (n = 3) mice. EdU (0.2 mg/25 g body weight) was administered to mice 1.5 h prior to sacrifice. Scale bar: 20 µm. il Representative images of day 4 organoids (i) and quantification of organoid formation (j), bud number (k) and surface area (l) derived from the WT + Ctrl (n = 4), WT + CRS (n = 6), Nr3c1 cKO + Ctrl (n = 4) and Nr3c1 cKO + CRS (n = 6) mice. Scale bar: 100 µm. m Representative images of day 4 organoids after ex vivo treatment with 200 μM CORT or 200 μM CORT simultaneously supplemented with 5 μM RU486, an antagonist of the glucocorticoid receptor. Scale bar: 100 µm. Quantification of the bud number (n) and surface area (o) of the organoids in (m) (n = 8). The data are presented as the mean ± SD. The statistical analysis was performed by an unpaired two-tailed Student’s t-test for normally distributed data or the Mann‒Whitney test for non-normally distributed data. For multiple group comparisons, one-way ANOVA with Dunnett’s multiple comparisons test was used for normally distributed data, and the Kruskal‒Wallis test with Dunn’s multiple comparisons test was used for non-normally distributed data. ns, p ≥ 0.05, *p < 0.05, **p < 0.01, ***p < 0.001.
Fig. 5
Fig. 5. FKBP5 is upregulated by corticosterone in ISCs.
a Schematic diagram of RNA-seq analysis of ISCs isolated from the small intestine of Ctrl, restraint stress-treated, vehicle-treated and CORT-treated mice. Lgr5-EGFP-IRES-creERT2 mice were exposed to restraint stress or CORT treatment for 1 day (n = 3). The small intestinal crypt fractions were isolated and dissociated into single-cell suspensions. ISCs were sorted by using flow cytometry and subjected to RNA-seq analysis. b Heatmap showing the expression of stem cell marker genes, Wnt-related genes and proliferation-related genes in ISCs isolated from the small intestine of Ctrl, restraint stress-treated, vehicle-treated and CORT-treated mice. c Gene set enrichment analysis (GSEA) of transcriptome profiles showing high enrichment of FoxO signaling pathway-related genes in ISCs from the stressed (vs. Ctrl) and CORT-treated (vs. vehicle) mice. Differentially expressed gene, > 2-fold; Padj value < 0.05. d Venn diagram showing overlapping upregulated genes in ISCs from the stress-treated (vs. Ctrl) and CORT-treated (vs. vehicle) mice. e Top 5 upregulated genes in ISCs from the stress-treated (vs. Ctrl) and CORT-treated (vs. vehicle) mice. f Volcano plots showing the genes differentially expressed in ISCs from the stress-treated (vs. Ctrl) and CORT-treated (vs. vehicle) mice. g RT–qPCR analysis of Fkbp5 expression in the small intestinal crypts from the 1-day restraint stress- and CORT-treated mice. n = 6 and 9 mice for the restraint stressed and CORT-treated groups, respectively. h Western blotting for FKBP5 in the small intestinal crypts from the 2-day stress- and CORT-treated mice. β-actin was used as a loading control. i RT–qPCR analysis of Fkbp5 expression in intestinal organoids after ex vivo treatment with 200 μM CORT or 200 μM CORT simultaneously supplemented with 5 μM RU486 (n = 3). j A chromatin immunoprecipitation assay was performed using an antibody against NR3C1 on crypts isolated from the WT mice treated with vehicle or CORT for 1 day (n = 4). IgG was used as a negative control, and the enrichment of NR3C1 binding to the Fkbp5 promoter was quantified using qPCR. The data are presented as the mean ± SD. The statistical analysis was performed by unpaired two-tailed Student’s t-test for normally distributed data or the Mann‒Whitney test for non-normally distributed data and by one-way ANOVA with Dunnett’s multiple comparisons test or the KruskalWallis test with Dunn’s multiple comparisons test for non-normally distributed data. ns, p ≥ 0.05, *p < 0.05, **p < 0.01, ***p < 0.001.
Fig. 6
Fig. 6. FKBP5-AKT signaling is responsible for the effect of corticosterone on ISCs.
a Representative images of day 4 organoids after ex vivo treatment with 200 μM CORT, 0.25 μM SAFit2, or 200 μM CORT supplemented with 0.25 μM SAFit2. SAFit2, a highly selective FKBP5 inhibitor. Scale bar: 100 µm. b, c Quantification of the bud number (b) and surface area (c) of the organoids in a (n = 6). d, e Western blotting for AKT and pAKT (S473) in the small intestinal crypts of the vehicle-treated, CORT-treated (5 mg/kg/day), SAFit2-treated (20 mg/kg/day) and CORT + SAFit2-treated mice (d) and in the small intestinal crypts of the Ctrl + vehicle-treated, stress+vehicle-treated, Ctrl + SAFit2-treated and stress+SAFit2-treated mice (e). Mice were exposed to those treatments for 2 days. β-actin was used as a loading control. f, g Western blotting for FOXO1 in nuclear and cytoplasmic proteins isolated from the small intestinal crypts of the vehicle-treated, CORT-treated, SAFit2-treated and CORT + SAFit2-treated mice (f) and from the small intestinal crypts of the Ctrl + vehicle-treated, stress + vehicle-treated, Ctrl + SAFit2-treated and stress+SAFit2-treated mice (g). Mice were exposed to those treatments for 2 days. Lamin B1 and tubulin were used as nuclear proteins and cytoplasmic protein loading controls, respectively. h RT–qPCR analysis of p130, p21, and Ccnd1 expression in small intestinal crypts from the 1-day vehicle-treated, CORT-treated, SAFit2-treated and CORT + SAFit2-treated mice (n = 3). The data are presented as the mean ± SD. The statistical analysis was performed by one-way ANOVA with Dunnett’s multiple comparisons test. ns, p ≥ 0.05, *p < 0.05, **p < 0.01.
Fig. 7
Fig. 7. Nr3c1 deficiency in ISC mitigates the stress-exacerbated colitis.
a Schematic of the dextran sulfate sodium (DSS)-induced colitis model. WT and Nr3c1 cKO mice received a 5-day tamoxifen (TAM, 2 mg/25 g body weight) injection. A subset of the mice was were subjected to CRS treatment. During the last week of the three-week CRS treatment, mice were given 2.0% DSS in drinking water for seven days, followed by a 2-day recovery period with normal drinking water. b, c Body weight (b) and disease activity index (DAI) (c) of WT (Nr3c1fl/fl) + Ctrl (n = 8), WT + CRS (n = 9), Nr3c1 cKO (Lgr5;Nr3c1fl/fl) + Ctrl (n = 8) and Nr3c1 cKO + CRS (n = 9) mice during 2.0% DSS treatment. Body weight was monitored daily and expressed as a percentage of the initial body weight. d, e Representative image of colon (d) and quantification of colon length (e) of WT + Ctrl, WT + CRS, Nr3c1 cKO + Ctrl, Nr3c1 cKO + CRS mice (n = 8) after 7-day DSS treatment and 2-day recovery period. fh Representative H&E staining image (f), epithelial damage score (g), and inflammatory infiltrate score (h) of colonic section from WT + Ctrl (n = 8), WT + CRS (n = 9), Nr3c1 cKO + Ctrl (n = 7), Nr3c1 cKO + CRS (n = 9) mice after 7 days of DSS treatment and a 2-day recovery period. Scale bar: 50 µm. i Representative image of in situ hybridization for Lgr5 combined with immunofluorescence staining for Ki67 and the epithelial marker cadherin (E-cadherin) in the colons of Ctrl and CRS-treated mice with 2.0% DSS treatment. Scale bar: 50 µm. j, k Quantification of percentage of Lgr5+ cells per crypt (j), and the proportion of Lgr5+ cells expressing Ki-67 (k) in the colons of WT + Ctrl (n = 5), WT + CRS (n = 6), Nr3c1 cKO + Ctrl (n = 5) and Nr3c1 cKO + CRS (n = 6). The data are presented as the mean ± SD. The statistical analysis was performed by an unpaired two-tailed Student’s t-test for normally distributed data or the Mann‒Whitney test for non-normally distributed data. ns, p ≥ 0.05, *p < 0.05, **p < 0.01, ***p < 0.001.

References

    1. Appleton, J. The gut-brain axis: influence of microbiota on mood and mental health. Integr. Med.17, 28–32 (2018). - PMC - PubMed
    1. Carabotti, M., Scirocco, A., Maselli, M. A. & Severi, C. The gut-brain axis: interactions between enteric microbiota, central and enteric nervous systems. Ann. Gastroenterol.28, 203–209 (2015). - PMC - PubMed
    1. Foster, J. A., Rinaman, L. & Cryan, J. F. Stress & the gut-brain axis: regulation by the microbiome. Neurobiol. Stress7, 124–136 (2017). - PMC - PubMed
    1. Lobo, B. et al. The stressed gut: region-specific immune and neuroplasticity changes in response to chronic psychosocial stress. J. Neurogastroenterol. Motil.29, 72–84 (2023). - PMC - PubMed
    1. Vanuytsel, T. et al. Psychological stress and corticotropin-releasing hormone increase intestinal permeability in humans by a mast cell-dependent mechanism. Gut63, 1293–1299 (2014). - PubMed

LinkOut - more resources