. 2025 May 13;16(1):4419.
doi: 10.1038/s41467-025-59595-4.

Control of spatiotemporal activation of organ-specific fibers in the swine vagus nerve by intermittent interferential current stimulation

Affiliations

Control of spatiotemporal activation of organ-specific fibers in the swine vagus nerve by intermittent interferential current stimulation

Nicolò Rossetti et al. Nat Commun. .

Abstract

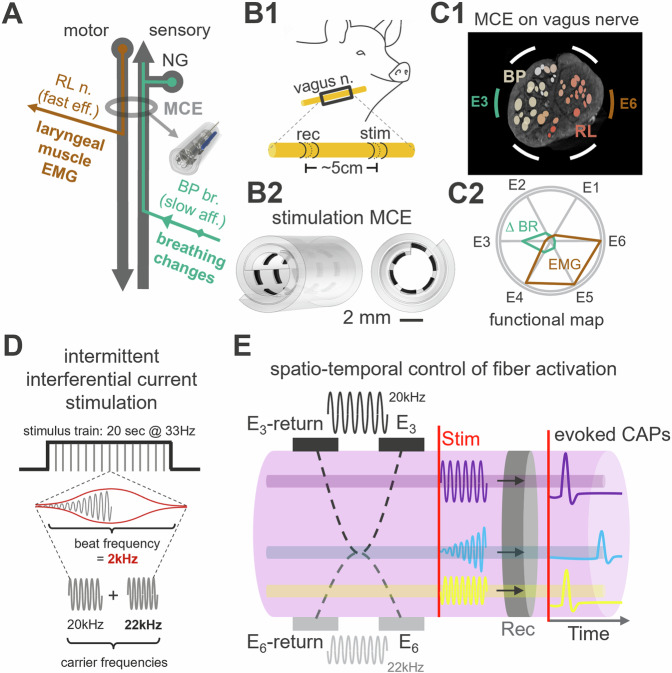
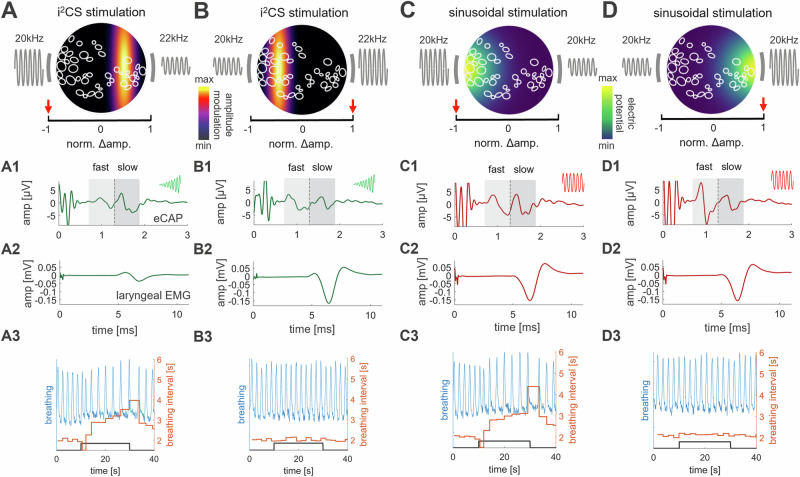
Vagus nerve stimulation (VNS) is emerging as potential treatment for several chronic diseases. However, limited control of fiber activation, e.g., to promote desired effects over side effects, restricts clinical translation. Towards that goal, we describe a VNS method consisting of intermittent, interferential sinusoidal current stimulation (i2CS) through multi-contact epineural cuffs. In experiments in anesthetized swine, i2CS elicits nerve potentials and organ responses, from lungs and laryngeal muscles, that are distinct from equivalent non-interferential sinusoidal stimulation. Resection and micro-CT imaging of a previously stimulated nerve, to resolve anatomical trajectories of nerve fascicles, demonstrate that i2CS responses are explained by activation of organ-specific fascicles rather than the entire nerve. Physiological responses in swine and activity of single fibers in anatomically realistic, physiologically validated biophysical vagus nerve models indicate that i2CS reduces fiber activation at the interference focus. Experimental and modeling results demonstrate that current steering and beat and repetition frequencies predictably shape the spatiotemporal pattern of fiber activation, allowing tunable and precise control of nerve and organ responses. When compared to equivalent sinusoidal stimulation in the same animals, i2CS produces reduced levels of a side-effect by larger laryngeal fibers, while attaining similar levels of a desired effect by smaller bronchopulmonary fibers.


Conflict of interest statement

Competing interests: IMEC has been granted patents related to this work (US18511762, US0017074A1, US0364428A1, US0198109A1). IMEC and Northwell have submitted patents related to this work.

Figures

Fig. 1
Fig. 1. Anatomical basis for control of spatiotemporal activation of fibers by vagus nerve stimulation using intermittent, interferential current stimulation (i2CS).
A Schematic of the vagal trunk: a multi-contact cuff electrode (MCE) is implanted in a swine at the cervical level, at a level below the nodose ganglion (NG). Out of the numerous subpopulations of vagal fibers mediating different physiological functions, shown are fibers relevant to this study, namely fast, motor fibers projecting to laryngeal muscles through the recurrent laryngeal (RL) branch, whose activation produces a laryngeal electromyography (EMG) signal as well as slower, sensory fibers from the lungs, entering the trunk through the bronchopulmonary (BP) branch, whose activation slows down breathing. B1 Stimulation and recording electrodes placed on the cervical vagus nerve (VN) of a swine used to record evoked nerve potentials and directly assess fiber activation. B2 Layout of the cylindrical MCE used for VNS, comprising 3 rows of contacts, with 6 contacts in each row. C1 Schematic cross section of a swine cervical VN with fascicles; fascicle color represents the varying percentages of RL (red) and BP fibers (yellow), determined via post-mortem imaging and fascicle tracking. C2 Functional mapping of the nerve trunk inferred by single contact stimulation and recording of physiological responses; contact E3, which is close to BP fascicles, is associated with a strong breathing response (green trace), whereas contact E6, which is close to RL fascicles and located opposite contact E3, is associated with a strong laryngeal EMG response (red trace). D i2CS waveform in a 20 s-long stimulus train, with pulse repetition frequency of 33 Hz. Each “pulse” is generated by sinusoidal stimuli with slightly different carrier frequencies (20 and 22 kHz), delivered through separate contacts, which result in amplitude modulation of the short bursts with a beat frequency of 2 kHz (red) through temporal interference. E Illustration of the delivery of 2 high frequency sinusoidal stimuli, one between contact E3 and E3-return, and one between contact E6 and E6-return, to produce interference at a specific location inside the nerve trunk. Points close to contacts E3 and E6 do not experience interference or electric field amplitude modulation (AM); the respective fibers (purple and yellow) are activated immediately upon onset of stimulation, resulting in relatively large evoked compound action potentials (CAPs) with short latencies. Areas at the focus of interference experience field amplitude modulation, and the respective fibers (blue) are activated to a lesser degree and only after a delay, resulting in smaller evoked CAPs with longer latencies.
Fig. 2
Fig. 2. Bronchopulmonary- and recurrent laryngeal-specific fascicles progressively merge and give rise to a bimodal anatomical organization at the cervical level.
A After completion of in vivo experiments, the stimulated nerve, along with the RL and BP branches, was dissected, between the nodose ganglion (rostral) and the lower thoracic region (caudal); the exact location of one of the MCE contacts (E4) was marked on the epineurium of the right, mid-cervical VN with a suture. Each of several segments of the vagal trunk (black rectangles; B lower thoracic, C upper thoracic; D cervical) was imaged with micro-computed tomography (micro-CT), as described previously. In the micro-CT data, organ-specific fascicles were tracked longitudinally from branch emergence to the mid-cervical level, fascicle splits and merges were identified and percentages of organ-specific fibers in the resulting fascicle(s) were updated according to relative cross-sectional areas of parent and daughter fascicles. B1 Reconstructed lower thoracic segment with BP branch emergence and respective fascicles shown in blue. B2 Cross-section of the vagal trunk shown in B1 (green plane); each fascicle is colored according to the percentage of BP fibers. “Other” vagal fibers are those innervating the heart, esophagus and abdominal organs. C1 Same as (B1), but for an upper thoracic segment at RL branch emergence, with respective fascicles shown in red. C2 Fascicular map at the level of the green plane in C1. Fascicles contain varying percentages of BP, RL and other fibers, represented using a 3-color scale (inset). D1 Mid-cervical segment, where the MCE was implanted. D2 Fascicular map at level of the green plane in D1, with location of MCE contact E4 indicated by the suture marking. D3 Same map as (D2), with colormap corresponding to the percentage of BP fibers inside fascicles, normalized between maximum and minimum. Diagonal line approximately corresponds to the radial direction defined by 2 of the contacts of the MCE, the ones used for i2CS in preceding in vivo experiments (E3 and E6). D4 Percentage of RL fibers (normalized) inside nerve fascicles. D5 Distribution of estimated BP and RL fiber counts projected on the E3–E6 diagonal line, at different distances from the center of the line; blue and red vertical arrows represent the median values of the BP and RL distance distributions (−593 and 547 μm, respectively; p < 1−10, Wilcoxon rank-sum test).
Fig. 3
Fig. 3. i2CS elicits distinct experimental nerve and organ responses that are different than those to equivalent, non-interfering sinusoidal current stimulation.
A Schematic cross section of the stimulated VN of the example animal from Fig. 2 at the level of an implanted MCE; shown are outlines of nerve fascicles and the 2 contacts (grey bars) used for i2CS, with the left source at greater amplitude than the right source (negative steering ratio, expressed as the ratio in amplitude of the left current source with respect to the total current, mapped to a −1 to +1 range for illustration purposes; i.e., 0.9 = −1, 0.7 = −0.5, 0.5 = 0, 0.3 = 0.5, 0.1 = 1. −1 denotes 90% of the total amplitude on the left contact and 10% of the total amplitude on the right contact; red arrow on left side of x-axis); left and right sources have carrier frequencies of 20 kHz and 22 kHz respectively. The colormap represents the maximum peak-to-peak amplitude of the beat interference envelope, indicating the location of the maximal amplitude modulation (cf. Suppl. Fig. S1). A1 Evoked compound action potential (eCAP) triggered from the onset of i2CS, with 0.75 mA total current delivered through the 2 sources; slow and fast eCAP components are identified by the shaded areas corresponding to time windows defined by the average conduction velocities for ‘slow’ and ‘fast’ fibers. A2 Weak laryngeal EMG in response to i2CS. A3 Robust breathing response (blue trace: raw respiratory movements, orange trace: respective breathing interval), during a 20s-long train of i2CS (black trace). B Same as in A, but for i2CS steered in the opposite direction (i.e., towards the right side; shown are sizeable eCAP and EMG responses, with minimal breathing response. C Same as in A, but for sinusoidal stimulation. The two current sources have the same carrier frequency (20 kHz). The strength of the electric potential generated by this particular current steering ratio is represented by a colormap. Robust fast eCAP and EMG, as well as intense breathing response. D Same as in C, but for the opposite steering direction. All eCAP and EMG responses shown as averages triggered from n = 660 stimuli.
Fig. 4
Fig. 4. An anatomically realistic, physiologically validated biophysical model of the nerve-electrode interface predicts that i2CS produces reduced activation of fibers at the focus of interference.
A Cross-section of micro-CT-imaged swine vagus nerve at the level of the implanted cuff (same as in Fig. 3). Fascicle color indicates the relative prevalence of BP (blue, maximum 8% more BP) and RL fibers (orange, maximum 50% more RL) within each fascicle. B Physical 3D model containing the nerve as an extrusion of the cross-section in A and the spiral cuff around it, including the different 3D domain materials (perineurium delimiting each fascicle and surrounding medium not shown) and MRG-model used to calculate the activation function of each fiber based on the electric field. C Cross-section of the nerve model after circular deformation, including the relative placement of (longitudinally positioned pairs of) contacts within the cuff (black lines); the circumferential position of 2 pairs of contacts used for stimulation are highlighted in green. One pair of contacts delivers a 20 kHz and the second a 22 kHz sinusoidal carrier. The horizontal axis represents the ratio in stimulus amplitudes between the 2 contacts that controls the location of the interference focus (steering ratio). For visual clarity, areas with a predominance of RL (or BP) fibers are highlighted. D Modeled slow A-fiber (6 µm) responses to i2CS with different steering ratios (with a combined total current amplitude of 1.5 mA) and change in breathing rate measured experimentally upon i2CS with the same steering ratios. E Modeled fast A-fiber (10 µm) responses and experimentally recorded EMG responses. F Correlation between modeled normalized fiber firing probabilities and normalized physiological responses obtained experimentally in the same animal: fast A-fibers vs. EMG (orange), slow A-fiber vs. breathing response (blue). See Suppl. Fig. S5 for sinusoidal stimulation for DF. G Map of the electric potential magnitude generated by i2CS with a total injected current of 1 mA and steering ratio of 0, focusing the amplitude modulation (AM) in the middle of steering axis. H Level of AM for all nerve fascicles under the same stimulation conditions in G. I Fiber activation threshold for i2CS (circles) and for equivalent sinusoidal stimulation (triangles) at BP (blue) and RL (orange) fascicles at different distances from the middle of steering axis for current steering towards the middle of the nerve (left panel) and towards the right side (right panel). Insets indicate the focus of the interferential stimulation with a black cross, dotted black line indicates the current used for computational model that replicates experimental results (1.5 mA), and grey area indicates no activation.
Fig. 5
Fig. 5. Interferential stimulation activates vagal fibers in a specific spatiotemporal pattern, in experiments in swine and in swine vagus nerve models.
A Example laryngeal EMG responses to a 0.25 ms long sinusoidal stimulus (red) and i2CS (green) at different steering ratios (total amplitude 1 mA) and beat durations (0.25, 1, and 2 ms, from left to right). B Difference in latency of onset of laryngeal EMG in response to 0.25 ms-long sinusoidal stimulation (red) and i2CS (green) of different beat durations (0.25, 1, and 2 ms, from left to right), across all steering ratios, in 5 animals. Median response onset latencies to sinusoidal stimulation are shorter compared to i2CS of beat durations of 1 and 2 ms (p < = 0.112 for sin. stim. vs. i2CS 0.25 ms, p = 0.024 for sin. stim. vs. i2CS 1 ms and p = 0.0002 for sin. stim. vs. i2CS 2ms, Kruskal–Wallis test). C Modeled action potentials (APs) in a fast fiber located in a deep, RL fascicle (black-outlined fascicle in inset i1), in response to sinusoidal (red) and i2CS (green), at different steering ratios (total amplitude 2 mA) and beat durations (0.25, 1 and 2 ms, from left to right), same as those used in A. D Difference in latency of onset of modeled APs calculated from simulations of fast fibers located in all RL fascicles (inset: orange-filled fascicles), for sinusoidal stimulation (red) and i2CS (green), at different beat durations (0.25, 1, and 2 ms, from left to right), across all steering ratios. Median AP latencies to sinusoidal stimulation are shorter compared to i2CS of any beat duration (p < 0.001, Kruskal–Wallis test). E Onset latency of APs for modeled, fast fibers inside fascicles located at different distances from the middle of the steering axis, in response to sinusoidal stimulation (red data points) or i2CS with beat durations of 0.25 ms (filled green data points) and 1 ms (open green data points); the current was steered at the center of the nerve (steering ratio = 0; total amplitude 2 mA). Inset i2 shows modeled fascicles color-coded according to their distance from the mid-point of the steering axis. F Same as (E), but for a steering ratio of −0.5 (total amplitude 2 mA), resulting in a maximum interferential field on the right side of the nerve cross-section.
Fig. 6
Fig. 6. Repetition frequency of intermittent interferential stimulation controls timing of evoked action potentials in a temporally precise manner, in models of nerve fibers.
A Modeled responses of fast fibers, located in several fascicles, during continuous interferential stimulation (steering ratio = 0). Stimuli with carrier frequencies of 20 kHz and 22 kHz and total amplitude of 2 mA are deployed for 90 ms without interruption: stimulation signal at the top, with inset focusing on 3 consecutive beats. Traces 1–5 show the time course of responses of single fibers inside 5 fascicles, selected to demonstrate the effect of different levels of amplitude modulation (AM) of the electric field. Inset i1 shows the spatial distribution of the AM in a radial cross-section between contacts of each source, where interference is strongest; numbers 1–5 indicate the selected fascicles. Fiber responses range from activation blocking (fascicles 1, 2, 5), to regular tonic firing (3), to irregular tonic firing (4). B Same as (A), but for i2CS, demonstrating regular firing in all 5 fascicles, with the inter-spike interval (ISI) being determined by the pulse repetition frequency (in this case 33 Hz, matching in vivo experiments). APs are elicited at different latencies across fascicles (cf. Fig. 5C–F, not all visible here because of long time base). C1-4 ISI histograms obtained from APs from fibers in nerve fascicles exposed to different levels of AM (inset i2, fascicles are color-coded based on three ranges of amplitude modulation using quantile values: low <0.33, medium 0.33-0.66, high >0.66), for continuous interferential stimulation (IS): C1: fascicles with low AM (below first tertile), C2: intermediate AM (between first and second tertile), and C3: high AM (above second tertile). C4: for i2CS (all fascicles).
Fig. 7
Fig. 7. Interferential stimulation of the swine vagus nerve attains increased selectivity of a desired effect, mediated by smaller BP fibers, over a side effect, mediated by larger RL fibers, compared to equivalent sinusoidal stimulation.
A Slow eCAP amplitudes for sinusoidal and interferential stimulation at different steering ratios, from an example animal. B Same as in A, but for fast eCAPs. C Slow over fast eCAP selectivity index (SI) defined as the ratio of the difference over the sum of eCAP amplitudes in A and B (see Eqs. (2) and (3) in Methods section), fitted with a sigmoidal function, for the 2 stimulus conditions. D The mean eCAP selectivity factor (SF), defined as the product of the slope and range of the fitted sigmoidal function of the SI (Suppl. Fig. S9) is significantly different between the 2 stimulus conditions across 7 animals (example animal denoted with open symbols) (p = 0.038; Wilcoxon rank-sum test). E Magnitude of the (desired) breathing response (change in breathing interval, ΔBI) at different steering ratios, from an example animal, for interferential and equivalent sinusoidal stimulation. F Amplitude of the (undesired) laryngeal EMG at different steering ratios, in the same animal. G Physiological SI, defined as the ratio of the magnitude of the desired over the side effect, in the same animal. H The mean physiological SF is significantly different between interferential and equivalent sinusoidal stimulation across 5 animals (open symbols: example animal) (p = 0.008, Wilcoxon rank-sum test). I Recruitment of BP fibers (modelled as smaller A-fibers, diameter 6 μm, placed inside fascicles rich in BP fibers) for sinusoidal (red) and interferential (green) stimulation at different steering ratios and a total stimulation amplitude of 1.5 mA. Results obtained using the anatomically realistic biophysical model of the example animal. J Same as in I, but for RL fibers (modelled as larger A-fibers, diameter 10 μm, inside fascicles rich in RL fibers). K BP over RL SI calculated from the fiber recruitments in I and J, fitted with a sigmoidal function. L SF comparing the sinusoidal and interferential stimulation conditions.

Similar articles

Cited by

References

    1. Jänig, W. The Integrative Action of the Autonomic Nervous System: Neurobiology of Homeostasis. 10.1017/9781108778411 (Cambridge University Press, Cambridge, 2022).
    1. Karemaker, J. M. The multibranched nerve: vagal function beyond heart rate variability. Biol. Psychol.172, 108378 (2022). - PubMed
    1. Afra, P., Adamolekun, B., Aydemir, S. & Watson, G. D. R. Evolution of the vagus nerve stimulation (VNS) therapy system technology for drug-resistant epilepsy. Front. Med. Technol.3, 696543 (2021). - PMC - PubMed
    1. Ben-Menachem, E. Vagus nerve stimulation, side effects, and long-term safety. J. Clin. Neurophysiol.18, 415–418 (2001). - PubMed
    1. Dawson, J. et al. Vagus nerve stimulation paired with rehabilitation for upper limb motor function after ischaemic stroke (VNS-REHAB): a randomised, blinded, pivotal, device trial. Lancet397, 1545–1553 (2021). - PMC - PubMed

LinkOut - more resources