Clinical Trial
. 2025 May 13;16(1):4451.
doi: 10.1038/s41467-025-59796-x.

Clinical response to azacitidine in MDS is associated with distinct DNA methylation changes in HSPCs

Affiliations
Clinical Trial

Clinical response to azacitidine in MDS is associated with distinct DNA methylation changes in HSPCs

Julie A I Thoms et al. Nat Commun. .

Abstract

Hypomethylating agents are frontline therapies for myelodysplastic neoplasms (MDS), yet clinical responses remain unpredictable. We conducted a phase 2 trial comparing injectable and oral azacitidine (AZA) administered over one or three weeks per four-week cycle, with the primary objective of investigating whether response is linked to in vivo drug incorporation or DNA hypomethylation. Our findings show that injection results in higher drug incorporation, but lower DNA demethylation per cycle, while global DNA methylation levels in mononuclear cells are comparable between responders and non-responders. However, hematopoietic stem and progenitor cells (HSPCs) from responders exhibit distinct baseline and early treatment-induced CpG methylation changes at regulatory regions linked to tissue patterning, cell migration, and myeloid differentiation. By cycle six-when clinical responses typically emerge-further differential hypomethylation in responder HSPCs suggests marrow adaptation as a driver of improved hematopoiesis. These findings indicate that intrinsic baseline and early drug-induced epigenetic differences in HSPCs may underlie the variable clinical response to AZA in MDS.


Conflict of interest statement

Competing interests: F.V. is affiliated with OmniOmics.AI Pty Ltd. C.F. is an advisory board member at Amgen, AbbVie, Adaptive Biotech, BeiGene, Pfizer, Otsuka, and Jazz, a consultant at Novotech, and received speaker fees from Amgen, Pfizer, Servier, BMS, and Astella. D.H. has consultancy agreements with GlaxoSmithKline and Pharming Corp. M.H. is a consultant/advisory board member at Roche, Gilead, Otsuka, Janssen, Beigene, and Takeda. M.N.P. received research funding and/or provision of drug for clinical trials (to institution) from AstraZeneca, BRII Biosciences, Celgene/BMS, CSL Behring, Eli Lilly, Emergent Biosciences, Gilead Pharmaceuticals, GlaxoSmithKline, Grifols, Janssen/Johnson and Johnson, Takeda, ViiV Pharmaceuticals and has advisory roles with Celgene/BMS, Gilead Pharmaceuticals, and ViiV Pharmaceuticals. J.E.P. received research funding and/or provision of drug for clinical trials (to institution) from Celgene/BMS, Astex, Verastem Oncology and received honoraria from Abbvie as an advisory board member. The remaining authors declare no competing interests.

Figures
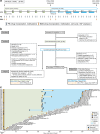
Fig. 1
Fig. 1. Trial design and patient outcomes.
a Trial design showing dosing schedule, specimen collection, and IWG assessment timepoints for injected and oral phases. b Consort diagram summarising outcomes for all participants who were assessed for eligibility. c Swimmer plots showing participant response and outcome over time. Coloured squares indicate diagnosis for each patient (yellow—high risk (HR) MDS, purple—CMML, brown—low blast (LB) AML). Circles show response at IWG assessment or progression timepoints (blue—responder, orange—non-responder). The off-study reason for each patient is as indicated, the number in brackets indicates the number of treatment cycles completed, * denotes a single patient (P21) who was accelerated to the oral phase following 4 injection cycles.
Fig. 2
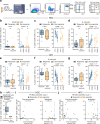
Fig. 2. Cell cycle parameters in CD34+ HSPCs at diagnosis and across treatment cycles.
a Analysis workflow for cell cycle analysis in CD34+ CD38lo stem (HSC) and CD34+ CD38hi progenitor (HPC) cells. Schematic partially created in BioRender. Thoms, J. (2025) https://BioRender.com/64wue88. Percentage of HSCs in b S/G2/M, c G0, d G1 cell cycle phases. Samples with <50 immunophenotypic HSCs not shown. bd Left: percentage of cells in specified cell cycle phase at diagnosis (C1D1), coloured by outcome at end of the injection phase. Responders: n = 15, non-responders n = 11. P values are indicated, ns denotes P > 0.05, Welch’s two-sided t-test. Boxplots throughout this figure show centre=median, box=interquartile range (IQR), whiskers=furthest point within 1.5× IQR, outliers = points >1.5× IQR. Right: Percentage of cells in specified cell cycle phase at diagnosis (C1D1) and end (C6D28) of injection phase. Lines indicate paired samples from a single patient, only patients with data at both timepoints are shown. Responders: n = 10, non-responders n = 7. P values as indicated, ns denotes P > 0.05, two-sided linear mixed model. Percentage of HPCs in (e) S/G2/M, (f) G0, (g) G1 cell cycle phases. eg Left: percentage of cells in specified cell cycle phase at diagnosis (C1D1), coloured by outcome at end of the injection phase. Responders: n = 15, non-responders n = 11. P values are indicated, ns denotes P > 0.05, Welch’s two-sided t-test. Right: Percentage of cells in specified cell cycle phase at diagnosis (C1D1) and at the end (C6D28) of the injection phase. Lines indicate paired samples from a single patient, only patients with data at both timepoints are shown. Responders: n = 15, non-responder n = 7. P values as indicated, ns denotes P > 0.05, two-sided linear mixed model. h Percentage of HPCs in S/G2/M following 12 treatment cycles, coloured by clinical outcome at C12D28, Welch’s two-sided t-test. Relationship between cell cycle status and drug incorporation and DNA demethylation during cycle 1 in (i) HSCs and (j) HPCs. i, j Percentage of cells actively cycling (S/G2/M phase) at C1D1 compared to maximum drug incorporation (left) and minimum DNA methylation (right) in peripheral blood during the same cycle. Dashed lines indicate baseline values, grey dots show patients with no response data. r = two-sided spearman correlation coefficient.
Fig. 3
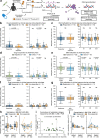
Fig. 3. DAC incorporation and relative DNA methylation in PB and BM MNCs across treatment phases.
a Administration of azacitidine (5-AZA-C), in vivo modification, and DNA incorporation leading to DNMT1 degradation and DNA hypomethylation. Drug incorporation into DNA is assessed by measuring NaBH4-stabilised and fragmented DNA (dihydro 5-AZA-dC ribonucleotide (R)) by mass spectrometry. Schematic partially created in BioRender. Thoms, J. (2025) https://BioRender.com/6ep5ch6. b, c Drug incorporation and DNA methylation (relative to baseline) during injection phase (n = 26, responder: 16, non-responder: 10]). b Drug incorporation in responders and non-responders at all sample points (left) or separated by cycle day (right). Statistical comparisons for bg were performed using a two-sided linear mixed model approach with subject-level random effects to account for within-subject variability, significant P values are as indicated, ns indicates P > 0.05. Boxplots throughout this figure show centre = median, box = interquartile range (IQR), whiskers = furthest point within 1.5xIQR, outliers = points >1.5xIQR. c Relative DNA methylation at all sample points or separated by cycle day. d, e Drug incorporation and DNA methylation during the injection and oral phases of the study (injection: n = 29, oral: n = 19) (d) DAC incorporation during the injection and oral phase at all sample points (left) or separated by cycle day (right). e Relative DNA methylation at all sample points or separated by cycle day. f, g Drug incorporation and DNA methylation during oral phase of the study (n = 19, responder: 8, non-responder: 11). f DAC incorporation in responders and non-responders at all sample points (left) or separated by cycle day (right). g Relative DNA methylation at all sample points or separated by cycle day. (h) Relative DNA methylation in bone marrow (BM) mononuclear cells (MNC) compared to pre-treatment (n = 17, responder: 11, non-responder: 6). Left: aggregate data at each timepoint. Right: Longitudinal methylation changes. Statistical comparisons for (h, j) were performed using two-sided t-test_ind (scipy.stats). i Comparison of methylation changes measured by mass spectrometry or LINE-1 PCR assay in BM MNC. Green—concordant methylation changes in both assays. Purple—methylation changes differ between assays (n = 25). j Relative LINE-1 DNA demethylation in BM CD34+ cells compared to pre-treatment (n = 17, responder: 10, non-responder: 8). Left: aggregate data at each timepoint. Right: Longitudinal methylation changes.
Fig. 4
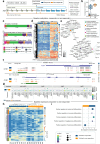
Fig. 4. Baseline differences in site-specific CpG methylation in CD34+ HSPCs correlate with clinical response to AZA.
a Schematic showing sample collection timepoints for reduced representation bisulphite sequencing (RRBS). b Average methylation at CpG sites at baseline (C1D1) for n = 10 responders and n = 8 non-responders. Statistical comparison is unpaired two-sided Welch’s t-test. Boxplots show centre=median, box=interquartile range (IQR), whiskers = furthest point within 1.5xIQR, outliers = points >1.5xIQR. ci Comparison of responder (n = 10) and non-responder (n = 8) patients prior to commencing AZA therapy. c Upper bar shows genomic distribution of 440140 CpG sites with data in all samples at C1D1 and C1D8. Lower bars show genomic distribution of CpGs which were hypomethylated (n = 23950) or hypermethylated (n = 3004) in responders compared to non-responders. d Clustered heatmap showing differentially methylated regions across all patients, with clinical response as indicated. e Network diagram showing enriched pathways for genes mapping to CpGs which are hypomethylated in responders at baseline. Network diagrams were created with clusterProfiler using GO pathways. CpGs were annotated to genes using HiChIP data from healthy human HSPC subsets. f Representative UCSC tracks showing differentially methylated CpGs at the HOXB1 (chr17:48,526,692-48,531,309 [hg38]) and EPO (chr7:100,719,795-100,724,032 [hg38]) loci. Tracks show composite data for each response group at C1D1. g Enrichment of differentially methylated CpGs at genomic regions with specific histone marks (H3K27Ac, H3K3me3, H3K27me3) or bound by key transcription factors and genome organisers (FLI1, ERG, PU.1, GATA2, RUNX1, TAL1, LYL1, LMO2, Pol2, CTCF, STAG2) in healthy human HSPC subsets. Plot shows CpG regions hypermethylated (upper) or hypomethylated (lower) in responders compared to non-responders. h Clustered heatmap showing log(1+count) for genes differentially expressed between responders and non-responders at C1D1, with clinical response as indicated. Cluster colours correspond to pathways shown in Supplementary Fig. 5j. i Normalised enrichment scores from FSGEA analysis for pathways related to blood production in responders compared to non-responders at C1D1.
Fig. 5
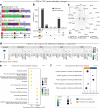
Fig. 5. Acute and sustained changes in site-specific CpG methylation in CD34+ HSPCs following AZA treatment.
ad Acute methylation changes at 440140 CpG sites detected in all samples at C1D1 and C1D8 following the first cycle of AZA treatment. a Genomic distribution of CpG sites differentially methylated at C1D8 compared to baseline C1D1 in responders and non-responders. b Upset plot showing overlap of differentially methylated CpG sites between comparison groups. c Network diagram showing enriched pathways for genes mapping to CpGs which are uniquely hypomethylated in responders at C1D8 compared to C1D1 (n = 15488 CpGs). Network diagrams were created with clusterProfiler using GO pathways.CpGs were annotated to genes using HiChIP data from healthy human HSPC subsets. d Enrichment of CpGs differentially methylated in responders at genomic regions with specific histone marks (H3K27Ac, H3K3me3, H3K27me3) or bound by key transcription factors and genome organisers (FLI1, ERG, PU.1, GATA2, RUNX1, TAL1, LYL1, LMO2, Pol2, CTCF, STAG2) in healthy human HSPC subsets. Plot shows CpG regions hypermethylated (upper) or hypomethylated (lower) at C1D8 compared to C1D1 in responders. e, f Changes in gene expression during cycle 1. e clusterProfiler pathway enrichment across all patients, irrespective of clinical response, at C1D8 vs C1D1. f Normalised enrichment scores from FSGEA analysis for pathways related to blood production in responders compared to non-responders at C1D8.
Fig. 6
Fig. 6. Methylation and Expression changes at Transposable Elements (TE) in CD34+ HSPCs following AZA treatment.
ac n = 18, responder: 10, non-responder: 8. a Methylation proportion (beta value) of CpGs mapping to TEs belonging to LINE, LTR, or SINE families in responders and non-responders. Left: at C1D1. Right: At C1D8. P values are indicated, statistical comparison used is two-sided Wilcoxon Rank-Sum test. Boxplots in (a, d) show centre = median, box = interquartile range (IQR), whiskers = furthest point within 1.5xIQR, outliers = not shown. b Average methylation proportion per patient in responders and non-responders at C1D1 and C1D8. P values are indicated, statistical comparison used is two-sided Wilcoxon Rank-Sum test. Boxplots in (b, c, e, f) show centre = median, box = interquartile range (IQR), whiskers = furthest point within 1.5xIQR, outliers = points >1.5xIQR. c Expression (average logCPM) for TEs belonging to LINE, LTR, or SINE families in responders and non-responders after one cycle of injected AZA (C1D8), statistics refer to two-sided student t-test ns indicates P > 0.05. df n = 8 patients, responder: 5, non-responder: 3. d Methylation proportion (beta value) of CpGs mapping to TEs belonging to LINE, LTR, or SINE families in responders and non-responders after one cycle of oral AZA. Left: at C7D1. Right: At C7D22. Statistical comparison used is two-sided Wilcoxon Rank-Sum test. e Average methylation proportion per patient in responders and non-responders at C7D1 and C7D22. Statistical comparison used is two-sided Wilcoxon Rank-Sum test, ns indicates P > 0.05. f Expression (average logCPM) for TEs belonging to LINE, LTR, or SINE families in responders and non-responders after one cycle of oral AZA (C7D22), statistics refer to two-sided student t test, ns indicates P > 0.05. g Per-patient expression of 12 TEs differentially expressed at C7D22 compared to C7D1. Differentially expressed TEs included evolutionarily young (PA1-PA6), members of the L1PA# subfamily. h Summed enrichment scores for six hallmark inflammatory pathways in responders compared to non-responders.
Fig. 7
Fig. 7. Variations in clonal composition in BM MNCs during HMA treatment.
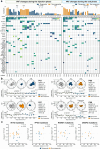
a Variant allele shifts in each patient over (left) injection phase, and (right) oral phase. Each column shows an individual patient with heatmap representation of VAF for each variant allele at start and end of the treatment phase (or, where relevant, during the oral phase, at progression). Bar plots show total number of variant alleles detected at each time point and are coloured by clinical response across the relevant treatment phase. b Clonal shifts in representative patients. Upper panels: Nightingale plots show VAF for each variant at diagnosis (C1), following 6 treatment cycles (C7) and following 12 treatment cycles/at progression (C12). Lower panels: Methylation level relative to C1D1 in PB across the entire course of treatment. c Correlation between global changes in methylation and shifts in variant allele burden for the four most frequently mutated genes in this cohort. Plots show composite data; each data point indicates a change in VAF across either injection or oral treatment phase and the average global methylation relative to C1D1 over the same treatment phase. r = two-sided spearman correlation coefficient.

References

    1. Chen, J. et al. Myelodysplastic syndrome progression to acute myeloid leukemia at the stem cell level. Nat. Med.25, 103–110 (2019). - PMC - PubMed
    1. Papaemmanuil, E. et al. Clinical and biological implications of driver mutations in myelodysplastic syndromes. Blood122, 3616–3627 (2013). - PMC - PubMed
    1. Carr, R. M. & Patnaik, M. M. Genetic and epigenetic factors interacting with clonal hematopoiesis resulting in chronic myelomonocytic leukemia. Curr. Opin. Hematol.27, 2–10 (2020). - PubMed
    1. Woll, P. S. et al. Myelodysplastic syndromes are propagated by rare and distinct human cancer stem cells in vivo. Cancer Cell25, 794–808 (2014). - PubMed
    1. Bejar, R. et al. Clinical effect of point mutations in myelodysplastic syndromes. N. Engl. J. Med.364, 2496–2506 (2011). - PMC - PubMed

Publication types

MeSH terms

Substances