. 2025 May 13;16(1):4437.
doi: 10.1038/s41467-025-59719-w.

FABP4 inhibition suppresses bone resorption and protects against postmenopausal osteoporosis in ovariectomized mice

Affiliations

FABP4 inhibition suppresses bone resorption and protects against postmenopausal osteoporosis in ovariectomized mice

Qian Xie et al. Nat Commun. .

Abstract

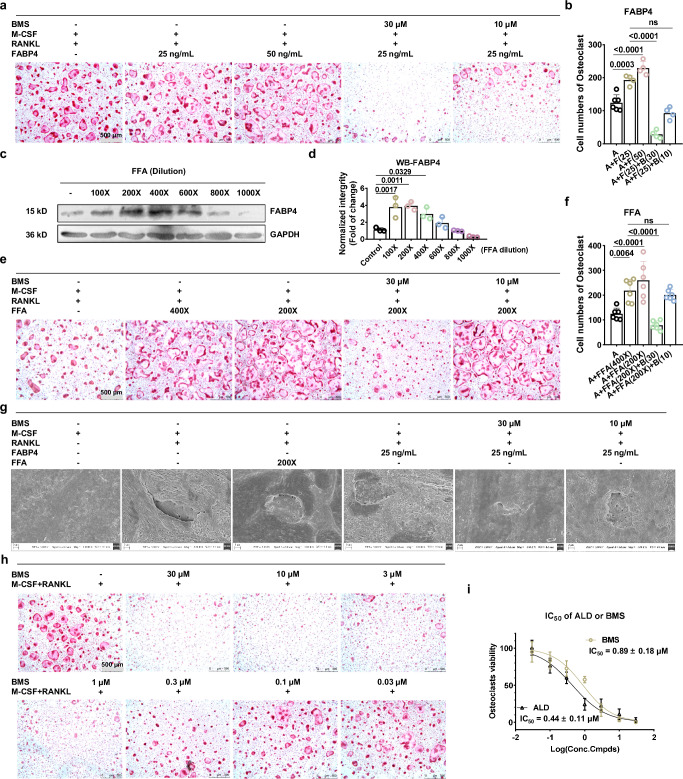
Postmenopausal osteoporosis (PMOP) is a condition in women caused by estrogen deficiency, characterized by reduced bone mass and increased fracture risk. Fatty acid-binding protein 4 (FABP4), a lipid-binding protein involved in metabolism and inflammation, has emerged as a key regulator in metabolic disorders and bone resorption; however, its direct role in PMOP remains unclear. Here, we show that serum FABP4 levels in PMOP patients negatively correlate with bone mineral density, a trend also observed in ovariectomized mice. FABP4 promotes osteoclast formation and bone resorption without affecting osteoblast differentiation. The FABP4 inhibitor BMS309403 suppresses osteoclast differentiation by modulating calcium signaling and inhibiting the Ca2+-Calcineurin-NFATc1 pathway. Oral BMS309403 increases bone mineral density in ovariectomized mice, though less effectively than alendronate. Notably, bone-targeted delivery of BMS309403 achieves comparable efficacy to alendronate. In this work, we demonstrate that FABP4 is a critical mediator in PMOP and that its inhibition offers a promising therapeutic strategy.


Conflict of interest statement

Competing interests: The authors declare no competing interests.

Figures

Fig. 1
Fig. 1. Increased FABP4 levels observed in the serum of PMOP patients and in the bone marrow of OVX mice.
a The OVX mice showed a marked decrease in trabecular bone mass. n = 6 mice per group. b H&E staining on paraffin-embedded tibial sections from OVX mice and Sham mice, with circular gaps representing dissolved adipose tissue. Scale bar, 300 μm and 100 μm. c IHC staining of FABP4 on tibial sections. Scale bar, 50 μm. d Quantification analysis of adipose tissue of (b). n = 4 mice in each group. e Quantification analysis of FABP4 expression of (c). n = 5 mice in each group. f Serum level of FABP4 was increased in PMOP patients and non-OP patients confirmed by ELISA assay. Data represent mean ± SEM; n = 8 for PMOP patients and n = 7 for non-OP patients. g Pearson correlation analysis between BMD and FABP4 in all clinical patients. All data is presented as mean ± SEM with p-values (df). Two-tailed unpaired t tests (df) and the two-tailed Pearson correlation coefficient (g) were calculated were performed. Source data are provided as Source Data file.
Fig. 2
Fig. 2. Increased endogenous or exogenous FABP4 protein does not affect the osteogenic differentiation of BMSCs.
a Full image of the effect of rmFABP4 (25 ng/mL or 50 ng/mL) or combined with FABP4 inhibitor BMS (5 μM or 10 μM) on BMSCs osteogenic differentiation, assessed by Alizarin Red staining. b Quantitative analysis of (a). n = 6 wells in 6-well-plate per group. c Representative bright-field and GFP images of FABP4 stably overexpressed BMSCs. Scale bar, 200 μm. At least three independent experiments were performed. d Western Blotting indicated the successful overexpression of FABP4 protein in FABP4 overexpressed BMSCs. Three independent experiments were performed. e q-PCR results showed a nearly 3600-fold increase in FABP4 expression in BMSCs. n = 3 independent samples per group. f Full image of the effect of FABP4 overexpressed BMSCs osteogenic differentiation by Alizarin Red staining. g Quantitative analysis of (f). n = 6 wells in 6-well-plate per group. All experiments were run in at least triplicate. All data is presented as mean ± SEM with p-values (b, e, g), ns = no significance. Two-tailed unpaired t test (e) and one-tailed Dunnett’s Multiple Comparison Test (b, g) were performed, and the p-values were adjusted made by multiple comparisons (b, g). Source data are provided as Source Data file.
Fig. 3
Fig. 3. Increased endogenous or exogenous FABP4 protein both exacerbates OCs differentiation.
a TRAP staining of BMMs after the treatment of rmFABP4 (25 ng/mL or 50 ng/mL) or simultaneously with FABP4 inhibitor BMS (10 μM or 30 μM). Scale bar, 500 μm. n = 4 for each 96-well plate. b Quantitative cell number of OCs in (a). n = 4 for each 96-well plate. c–d Western Blotting strips (c) and its quantitative analysis results (d) indicated treatment with FFA mixture will upregulate the intracellular FABP4 in BMMs. n = 3 independent experimental samples per group. e TRAP staining of BMMs after the treatment of FFA mixture (200X or 400X dilution) or simultaneously with FABP4 inhibitor BMS (10 μM or 30 μM). Scale bar, 500 μm. f Quantitative cell number of OCs in (e). n = 6 for each 96-well plate. g SEM results of bovine bone slices show that bone resorption experiments were conducted with OCs and treated with rm-FABP4, FFA, and BMS. Scale bar, 2 μm. Three independent experiments were performed. h TRAP staining of BMMs after treated with different concentration of BMS. Scale bar, 500 μm. n = 6 for each 96-well plate. i Comparison of the IC50 values of ALD and BMS in inhibiting OCs differentiation activity; n = 6 for each 96-well plate. The IC50 values were calculated by log(inhibitor) vs. normalized response - Variable slope. All experiments were run in at least triplicate. All data is presented as mean ± SEM with p-values (b, d, f, i), ns no significance. Data was analyzed by one-way ANOVA followed by Tukey’s multiple comparisons test (b, df). Source data are provided as Source Data file.
Fig. 4
Fig. 4. BMS blocks OCs differentiation via Ca2+-Calcineurin-NFATc1 signaling pathway.
a Volcano plot of transcriptome sequencing comparing BMMs vs. OCs and OCs vs. OCs treated with 1 μM BMS. n = 3 independent experimental samples. b Venn diagram showing upregulated genes in BMMs vs. OCs and downregulated genes in OCs vs. OCs + BMS. c KEGG pathway analysis of intersecting genes from the Venn diagram. d Cluster analysis of FPKM values for genes associated with OCs differentiation. e qPCR results of differentially expressed genes mentioned in (d). n = 3 independent experimental samples. f Western Blotting results of OCs differentiation marker proteins. g Quantitative analysis of (f). n = 3 independent experimental samples. h Flow cytometry quantification of intracellular Ca2+ concentration in OCs treated with FABP4 (25 ng/mL), FABP4 (25 ng/mL) + BMS (30 μM or 10 μM) (F + BMS30, F + BMS10), and BMS (1 μM) (BMS1) alone. i In situ fluorescence imaging of intracellular Ca2+ in OCs across different groups. Scale bar, 100 μm. Three independent experiments were performed. j Expression levels of Calcineurin and PLCγ proteins in OCs after BMS treatment. k Quantitative analysis of (j). n = 4 independent experimental samples. l Schematic diagram illustrating the mechanism by which the FABP4 inhibitor suppresses OCs differentiation. Created in BioRender. Li, J. (2025) https://BioRender.com/ha5yaui. All experiments were run in at least triplicate. All data is presented as mean ± SEM with p values (e, g, k), ns = no significance. Data was analyzed by one-tailed Student’s t-test (a, c) and one-way ANOVA followed by Tukey’s multiple comparisons test (e, g, k). Source data are provided as Source Data file.
Fig. 5
Fig. 5. Oral FABP4 inhibitor BMS increases bone density in OVX mice by inhibiting bone resorption.
a Schematic illustration of the animal study groups and experimental procedures. The scissors, ovary and syringe icons are from templates provided by ChemDraw. bd ELISA detection of serum levels of FABP4 (b) PINP (c) and CTX-1(d) at the endpoint. n = 5 mice per group in (b, d) and 10 mice per group in (c). e Micro-CT scans of the distal femur in each group, with trabecular bone highlighted in blue and the 3D analysis conducted within the defined ROI region. f Coronal micro-CT images of the L4-L5 lumbar vertebrae in each group, with the 3D analysis ROI region highlighted in bright blue. gi BMD (g) Tb.Th (h) and Tb.N (i) of trabecular bone in the distal femur for each group. jl BMD (j) Tb.Th (k) and Tb.N (l) in the trabecular bone of the L5 lumbar vertebra. m–n Quantitative TRAP staining results (m) and representative images (n) of demineralized proximal tibia sections in each group. n = 4 mice per group (gm). Scale bar, 400 μm and 100 μm. All data is presented as mean ± SEM with p values (bd, gm). ns no significance. Data was analyzed by one-way ANOVA followed by Tukey’s multiple comparisons test (bd, gm). Source data are provided as Source Data file.
Fig. 6
Fig. 6. PK data and tissue distribution of BMS in SD rats.
a PK data of three SD rats (101–103) following intravenous administration of BMS at a dose of 2 mg/kg. b PK data of three SD rats (201–203) following oral gavage of BMS at a dose of 10 mg/kg. c, d Tissue distribution of BMS in female (c) and male (d) SD rats at 0.25 h, 1 h, 4 h, and 8 h after oral gavage at a dose of 10 mg/kg. Distribution was assessed in the small intestine, lung, liver, stomach, kidney, heart, bone marrow (highlighted in red and emphasized), ovaries or testes, spleen, large intestine, bladder, adipose tissue, brain, and skeletal muscle. PK parameters included: T1/2 (half-life), Tmax (time to peak concentration), Cmax (maximum concentration), AUC(0–t) (area under the curve from 0 to t), AUC (0–∞) (area under the curve from 0 to infinity), MRT(0–t) (mean residence time from 0 to t), MRT (0–∞) (mean residence time from 0 to infinity), C0 (initial concentration), Vss (volume of distribution at steady state), Vz (apparent volume of distribution), Cl (clearance), F (oral bioavailability). Source data are provided as Source Data file.
Fig. 7
Fig. 7. Click chemistry constructs NPs for bone-targeted delivery of FABP4 inhibitors.
a Systematic strategy for one-step click chemistry synthesis of PLGA-PEG-Ald amphiphilic polymers. b Description of the self-assembly process of polymers into Ald-BMS-NPs. c Zeta potentials of PLGA-BMS-NPs and Ald-BMS-NPs. Data was represented mean ± SEM with p values; n = 3 independent samples per group. d DLS size distribution and TEM morphology of Ald-BMS-NPs. Scale bar, 100 nm. e DLS size distribution and TEM morphology of PLGA-BMS-NPs. Scale bar, 100 nm. Data was represented mean ± SEM; n = 3 independent samples per group. f Cumulative release curve of BMS in pH 7.0 PBS over time for PLGA-BMS-NPs and Ald-BMS-NPs. Data represent mean ± SEM; n = 3 independent samples per group. g In situ fluorescence images of BMMs uptake of Ald-BMS-Cy5-NPs and PLGA-BMS-Cy5-NPs after 30 min. Scale bar, 10 μm. h Representative TEM images of surface-bound nano-hydroxyapatite on Ald-NPs and PLGA-NPs. Scale bar, 200 nm. All experiments were run in triplicate. Data was analyzed by two-tailed unpaired t test (c) and one-sample t-test (df). Source data are provided as Source Data file.
Fig. 8
Fig. 8. Bone-targeting NPs loaded with FABP4 inhibitors effectively alleviate PMOP in vivo.
a Schematic illustration of the administration protocol for Ald-BMS-NPs treatment in OVX mice. The scissors, ovary and syringe icons are from templates provided by ChemDraw. n = 6 mice for each group. b Representative 3D reconstructed images of Micro-CT scans of femur from each group. c BMD data of the femur from different groups of mice. n = 4 mice per group. d Results of Micro-CT 3D analysis for BV/TV, Tb.Th, Tb.N and Tb.Sp across different groups. Data represent mean ± SEM; n = 4 mice per group. e Serum markers of liver and kidney function in the various groups of mice, Reference values ranges were obtained from literature. Data are presented as mean ± SEM, with p-values shown in parentheses. Values exceeding the reference range are highlighted in bold; n = 3 mice per group. All data is presented as mean ± SEM with p-values (c, d), ns = no significance. Data was analyzed by one-way ANOVA followed by Tukey’s multiple comparisons test (c, d). Source data are provided as Source Data file.

References

    1. Neer, R. M. et al. Effect of parathyroid hormone (1-34) on fractures and bone mineral density in postmenopausal women with osteoporosis. N. Engl. J. Med.344, 1434–1441 (2001). - PubMed
    1. Ebeling, P. R. et al. Secondary Osteoporosis. Endocr. Rev.43, 240–313 (2022). - PubMed
    1. Watts, N. B. Postmenopausal Osteoporosis: A Clinical Review. J. Women’s Health27, 1093–1096 (2018). - PubMed
    1. Wade, S. W., Strader, C., Fitzpatrick, L. A., Anthony, M. S. & O’Malley, C. D. Estimating prevalence of osteoporosis: examples from industrialized countries. Arch. Osteoporos.9, 182 (2014). - PubMed
    1. Reginster, J. Y. & Burlet, N. Osteoporosis: A still increasing prevalence. Bone38, 4–9 (2006). - PubMed

MeSH terms

Substances

LinkOut - more resources