. 2025 May 14;16(1):4455.
doi: 10.1038/s41467-025-59618-0.

Chaperone-mediated autophagy manipulates PGC1α stability and governs energy metabolism under thermal stress

Affiliations

Chaperone-mediated autophagy manipulates PGC1α stability and governs energy metabolism under thermal stress

Yixiao Zhuang et al. Nat Commun. .

Abstract

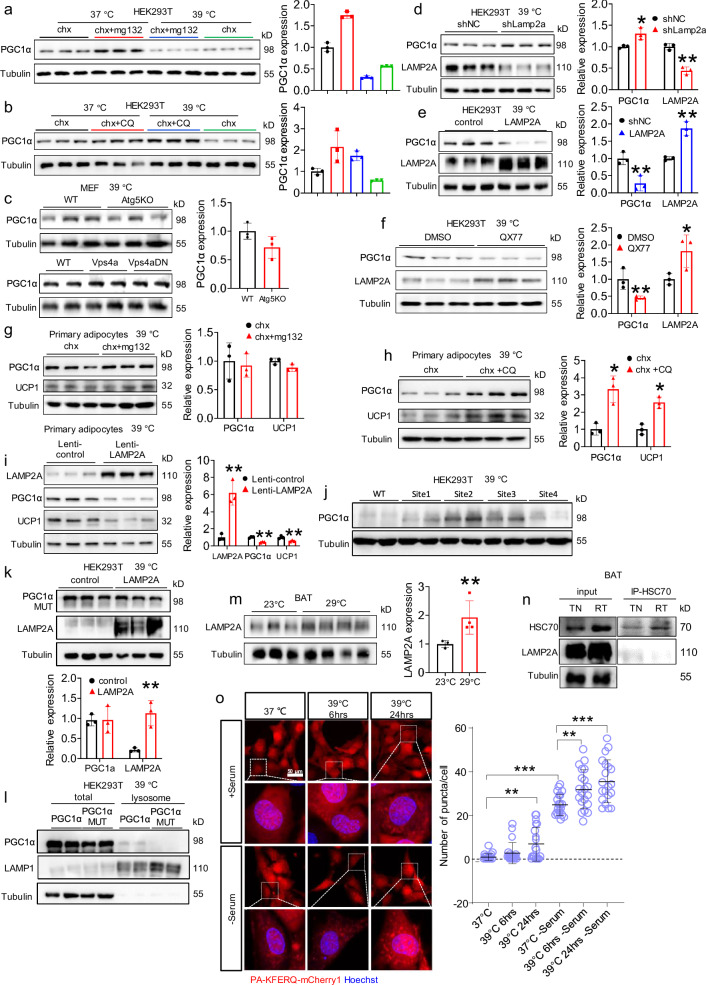
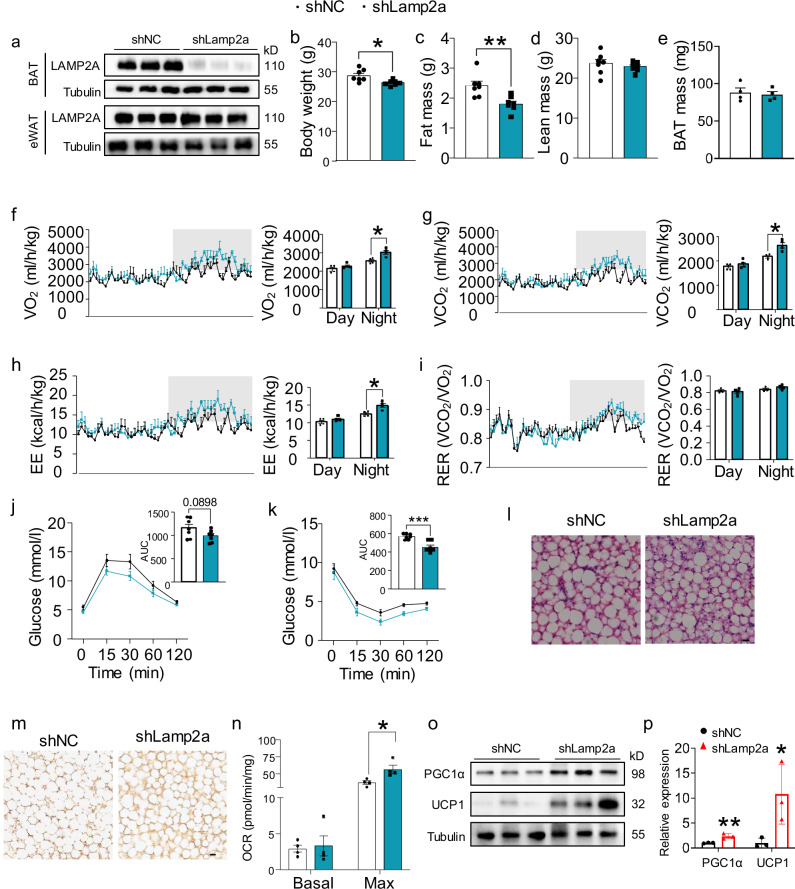
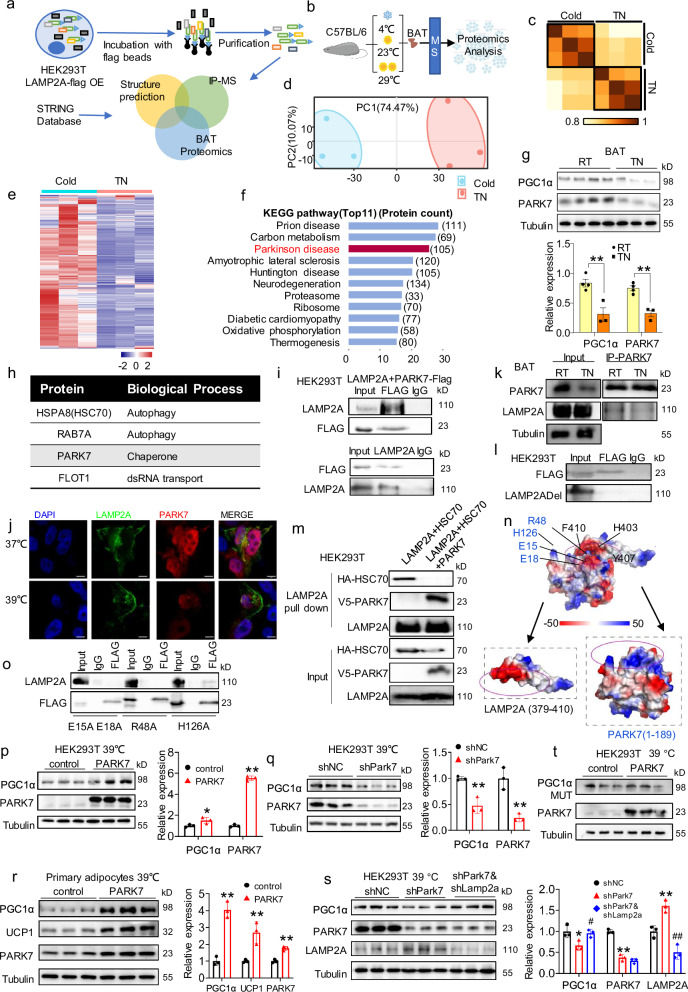
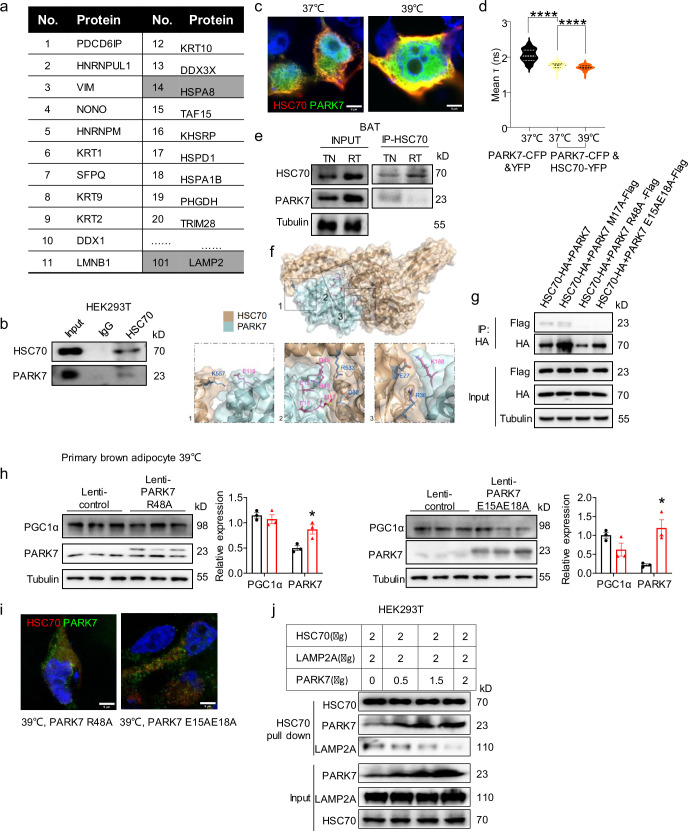
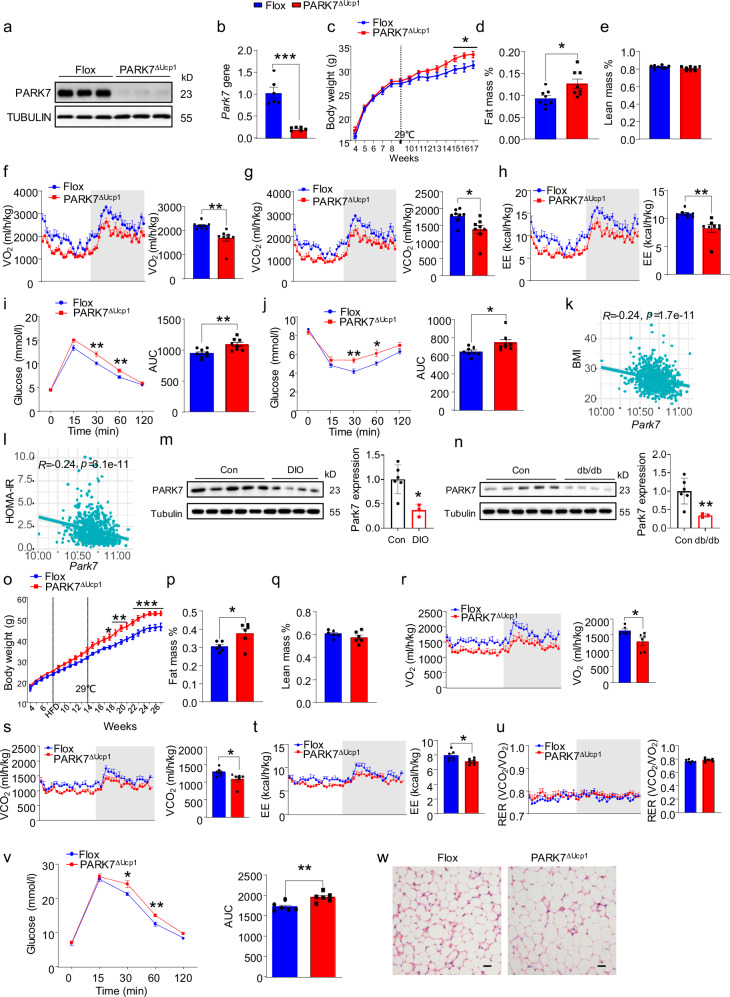
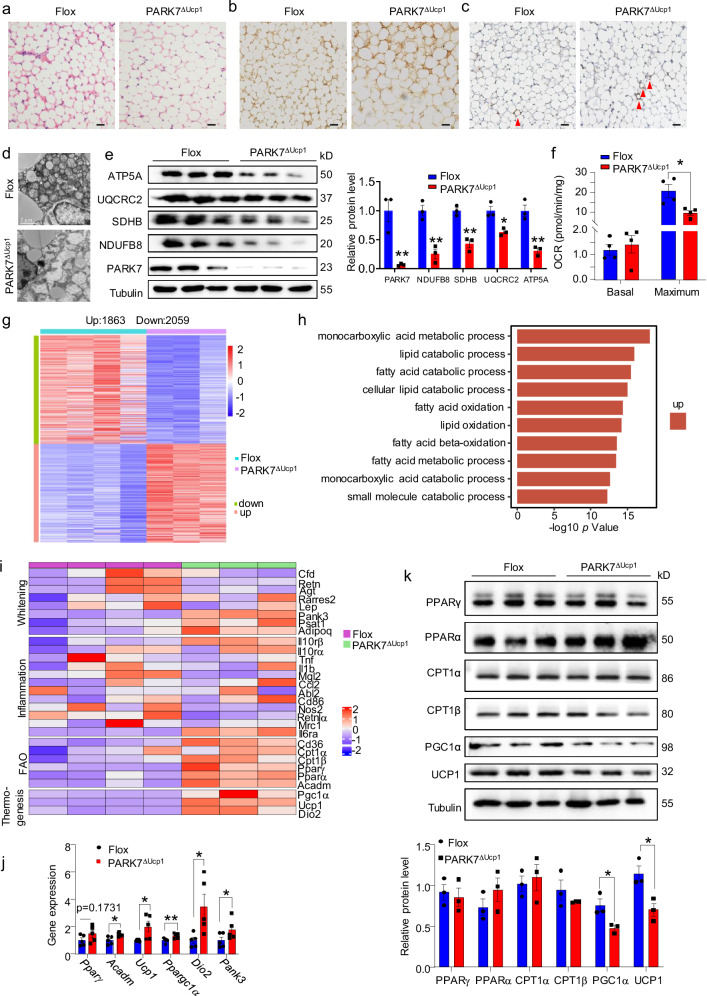
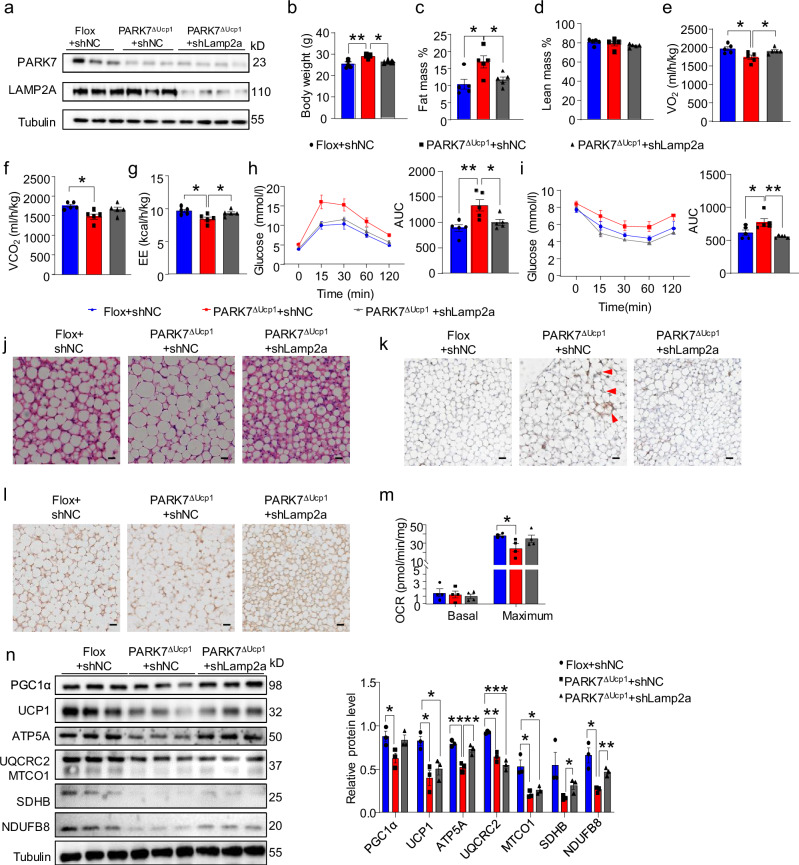
Thermogenic proteins are down-regulated under thermal stress, including PGC1α· However, the molecular mechanisms are not fully understood. Here, we addressed that chaperone-mediated autophagy could regulate the stability of PGC1α under thermal stress. In mice, knockdown of Lamp2a, one of the two components of CMA, in BAT showed increased PGC1α protein and improved metabolic phenotypes. Combining the proteomics of brown adipose tissue (BAT), structure prediction, co-immunoprecipitation- mass spectrum and biochemical assays, we found that PARK7, a Parkinson's disease causative protein, could sense the temperature changes and interact with LAMP2A and HSC70, respectively, subsequently manipulate the activity of CMA. Knockout of Park7 specific in BAT promoted BAT whitening, leading to impaired insulin sensitivity and energy expenditure at thermoneutrality. Moreover, inhibiting the activity of CMA by knockdown of LAMP2A reversed the effects induced by Park7 ablation. These findings suggest CMA is required for BAT to sustain thermoneutrality-induced whitening through degradation of PGC1α.


Conflict of interest statement

Competing interests: The authors declare no competing interest.

Figures

Fig. 1
Fig. 1. Degradation of PGC1α is induced by CMA under thermal stress.
a, b Immunoblotting for PGC1α protein levels in HEK293T cells cultured in 37 °C or 39 °C for 24 h (representative of n = 3 independent experiments). c Immunoblotting for PGC1α protein levels in MEF cells with/without ATG5 deletion or overexpressing VPS4A or VPS4AE228Q (dominant negative) in 39 °C for 24 h and treated with 50 μM cycloheximide (CHX) for 3 h before harvest cells (representative of n = 3 independent experiments). d Immunoblotting for PGC1α and LAMP2A protein levels in HEK293T cells with/ without LAMP2A knockdown in 39 °C for 24 h and treated with 50 μM cycloheximide (CHX) for 3 h before harvest cells (representative of n = 3 independent experiments). e Immunoblotting for PGC1α and LAMP2A protein levels in HEK293T cells over-expressing LAMP2A in 39 °C for 24 h and treated with 50 μM cycloheximide (CHX) for 3 h before harvest cells (representative of n = 3 independent experiments). f Immunoblotting for PGC1α and LAMP2A protein levels in HEK293T cells treated with QX77 in 39 °C for 24 h and treated with 50 μM cycloheximide (CHX) for 3 h before harvest cells (representative of n = 3 independent experiments). g, h Immunoblotting for PGC1α and UCP1 protein levels in primary brown adipocytes in 39 °C for 24 h (representative of n = 3 independent experiments). i Immunoblotting for PGC1α, UCP1 and LAMP2A protein levels in primary brown adipocytes overexpressing LAMP2A in 39 °C for 24 h and treated with 50 μM cycloheximide (CHX) for 3 h before harvest cells (representative of n = 3 independent experiments). j Immunoblotting for PGC1α protein levels in HEK293T cells overexpressing PGC1α wt/ mutants in 39 °C for 24 h and treated with 50 μM cycloheximide (CHX) for 3 h before harvest cells (representative of n = 3 independent experiments). k Immunoblotting for PGC1α and LAMP2A protein levels in HEK293T cells co-expressing LAMP2A and PGC1α -MUT in 39 °C for 24 h and treated with 50 μM cycloheximide (CHX) for 3 h before harvest cells (representative of n = 3 independent experiments). l Immunoblotting for PGC1α protein levels in HEK293T cells overexpressing PGC1α wt/ mutants in 39 °C for 24 h. m Endogenous Co-IP analysis of HSC70 and LAMP2A in BAT from mice housed at RT and TN (n = 3 mice for 23 °C group, n = 4 for 29 °C group). n Immunoblotting for LAMP2A protein level in BAT from mice housed at RT and TN. o Representative cell images and quantitation of CMA flux of NIH-3T3 cells expressing KFERQ-PA-mCherry1 (n = 20), Scale bar, 50 µm. Statistical significance was assessed by unpaired Student’s t-test. All results were expressed as means ± SEM and **p < 0.01, ***p < 0.005. Student’s two-tailed unpaired T-test for 2-group comparisons. Source data are provided as a Source Data file.
Fig. 2
Fig. 2. Mice with BAT-specific Lamp2a knockdown show identical energy metabolism at TN.
a Immunoblotting for LAMP2A protein levels of BAT from male C57BL/6 mice 4 weeks after injection with AAV-shScramble or AAV-shLamp2a and totally housed at TN for 8 weeks. bj Measurements of metabolic parameters of indicated mice housed at TN for 8 weeks, including body weight (b), n = 7 mice per group; fat mass (c), n = 7 mice per group; lean mass (d), n = 7 mice per group; BAT mass (e), n = 4 mice per group; oxygen consumption and quantitation of oxygen consumption (f), n = 4 mice per group; carbon dioxide production and quantitation of carbon dioxide production (g), n = 4 mice per group; EE and quantitation of EE (h), n = 4 mice per group; RER and quantitation of RER (i), n = 4 mice per group; GTT and AUC of GTT (j), n = 7 mice per group; ITT and AUC of ITT (k), n = 7 mice per group. l, m Histochemistry analysis, including representative hematoxylin-eosin staining of BAT (l), representative immunohistochemical UCP1 staining of BAT (m). Scale bar, 20 µm. n OCR analysis of BAT (n = 4 mice per group). o Immunoblotting for PGC1α and UCP1 protein levels of BAT lysate (representative of n = 3 independent experiments). p Quantification of o. Statistical significance was assessed by unpaired Student’s t-test. All results were expressed as means ± SEM, *p < 0.05, **p < 0.01, ***p < 0.005. Student’s two-tailed unpaired T-test for 2-group comparisons. Source data are provided as a Source Data file.
Fig. 3
Fig. 3. PARK7 interacts with LAMP2A and regulates PGC1α degradation.
a The schematic of Co-IP mass spectrum, protein interaction prediction and brown adipose tissue (BAT) proteomics. b The schematic of proteomics. c Principal-component analysis of the BAT proteomics dataset. d Similarity matrix showing Spearman correlations for proteomics dataset profiles. Spearman correlation coefficient r is represented in color as indicated. e Heatmap of BAT proteomics data detected in cold and warm conditions. f KEGG pathway analysis of significantly different BAT proteins in cold condition vs warm condition. g Immunoblotting for PARK7, PGC1α protein levels in BAT from mice housed at room temperature (RT, 23 °C) or thermoneutrality (TN, 29 °C) and quantification (bottom) (representative of n = 3 independent experiments). h Overlapping the data from Co-IP mass spectrum and protein interaction prediction. i Co-IP analysis of FLAG and LAMP2A in HEK293T cells co-expressing Flag-Park7 and Lamp2a. j Colocalization analysis of PARK7 and LAMP2A at 37 °C and 39 °C in HEK293T cells. Scale bar, 5 µm. k Endogenous Co-IP analysis of PARK7 and LAMP2A in BAT from mice housed at RT and TN. l Co-IP analysis of FLAG and LAMP2A in HEK293T cells co-expressing Flag-Park7 and Lamp2aDel. m Co-IP analysis of the competitive combination of PARK7 and LAMP2A with HSC70 in HEK293T cells co-expressing Lamp2a and HA-Flag-Hsc70 with or without V5- Park7. n 3D structure prediction of mouse protein interaction between LAMP2A and PARK7. o Co-IP assays of PARK7 mutants R48A, E15AE18A, H126A and LAMP2A in HEK293T cells co-expressing Flag-Park7 mutants and Lamp2a. p, q Immunoblotting for PARK7 and PGC1α protein levels in HEK293T cells with overexpression or knockdown of Park7 in 39 °C for 24 h (representative of n = 3 independent experiments). r Immunoblotting for PARK7, PGC1α and UCP1 protein levels in primary brown adipocytes with overexpression of Park7 (representative of n = 3 independent experiments). s Immunoblotting for PGC1α, PARK7 and LAMP2A protein levels in HEK293T cells knockdown of Park7 and Lamp2a in 39 °C for 24 h (representative of n = 3 independent experiments). t Immunoblotting for PGC1α and PARK7 protein levels in HEK293T cells co-expressing PARK7 and PGC1α -MUT in 39 °C for 24 h (representative of n = 3 independent experiments). Statistical significance was assessed by unpaired Student’s t-test. All results were expressed as means ± SEM and **p < 0.01. Student’s two-tailed unpaired T-test for 2-group comparisons. Source data are provided as a Source Data file. Figures a, b were created using PowerPoint.
Fig. 4
Fig. 4. HSC70 competes with LAMP2A to bind to PARK7.
a Table of top 20 proteins and LAMP2A from Co-IP mass spectrum. b Co-IP analysis of PARK7 and HSC70 in HEK293T cells co-expressing V5-Park7 and HA-Flag-Hsc70. c Colocalization analysis of PARK7 and HSC70 at 37 °C and 39 °C in HEK293T cells co-expressing HA-Flag-Hsc70 and Flag-Park7. d Quantitative analysis of fluorescence lifetime imaging microscopy (FLIM) of CFP fluorescence in HEK293T cells co-expressing CFP-Park7 and YFP-Hsc70 (n = 75). e Endogenous co-immunoprecipitation analysis of PARK7 and HSC70 in BAT from mice housed at RT and TN. f Multiple electrostatic interaction groups are involved in the surface of PARK7/HSC70 complex to maintain the L-shape interface according to the electrostatic properties of the residues. Residues of HSC70 involved were indicated and colored in blue as residues of PARK7 involved were colored in red, respectively. g Co-IP assays of PARK7 mutants M17A, R48A and E15AE18A and HSC70 in HEK293T cells co-expressing Flag-Park7 WT/mutants and HA-Flag-Hsc70. h Immunoblotting for PGC1α and PARK7 protein levels in primary brown adipocytes when overexpressing Park7 mutants in 39 °C for 24 h (representative of n = 3 independent experiments). i Colocalization analysis of PARK7 mutants R48A and E15AE18A and HSC70 at 39 °C in HEK293T cells. Scale bar, 5 µm. j Co-IP analysis of the competitive interaction among PARK7, LAMP2A and HSC70 in HEK293T cells. Cell lysates from HEK293T cells transfected with 2 μg HSC70 and 2 μg LAMP2A with and without different amount PARK7 were used for IP and IB assays. Statistical significance was assessed by unpaired Student’s t-test. All results were expressed as means ± SEM and ****p < 0.001. Student’s two-tailed unpaired T-test for 2-group comparisons. Source data are provided as a Source Data file.
Fig. 5
Fig. 5. Mice with BAT-specific Park7 knockout show lower energy metabolism at TN.
a, b Protein and mRNA levels of Park7 in the BAT from male Park7ΔUcp1 and Flox mice. cj Measurements of metabolic parameters of male Park7ΔUcp1 and Flox mice housed at TN for 8 weeks, including body weight (c), fat mass to body weight ratio (d), lean mass to body weight ratio (e), oxygen consumption (VO2) and quantitation of VO2 (f), carbon dioxide production (VCO2) and quantitation of VCO2 (g), energy expenditure (EE) and quantitation of EE (h), glucose tolerance test (GTT) and area under curve (AUC) of GTT (i), insulin tolerance test (ITT) and AUC of ITT (j) (n = 8). k, l Association between BMI (K) or HOMA-IR (L) and Park7 expression level in human from the METSIM study. m Immunoblotting and quantitation for PARK7 protein in BAT from diet-induced obesity (DIO) mice. n = 5 for control group and n = 4 for DIO group. n Immunoblotting and quantitation for PARK7 protein in BAT from db/db mice. n = 5 for control group and n = 4 for db/db group. ow Analysis of metabolic phenotypes of male Park7ΔUcp1 and Flox mice on HFD housed at TN for 8 weeks, including body weight (o), fat mass to body weight ratio (p), lean mass to body weight ratio (q), VO2 and quantitation of VO2 (r), VCO2 and quantitation of VCO2 (s), EE and quantitation of EE (t), RER and quantitation of RER (u), GTT and AUC of GTT (v) (n = 6). w Representative hematoxylin-eosin staining of BAT from male Park7ΔUcp1 and Flox mice on HFD housed at TN for 8 weeks. Scale bar, 20 µm. Statistical significance was assessed by unpaired Student’s t-test. All results were expressed as means ± SEM and *p < 0.05, **p < 0.01. Student’s two-tailed unpaired T-test for 2-group comparisons. Source data are provided as a Source Data file.
Fig. 6
Fig. 6. Park7 ablation exaggerates BAT whitening at thermoneutrality.
ac Histochemistry analysis of BAT of male Park7ΔUcp1 and Flox mice housed at TN for 8 weeks, including hematoxylin-eosin staining (a), immunohistochemical staining of UCP1 (b) and F4/80 (c). Arrow indicated crown-like structure. Scale bars, 20 µm. d Representative EM images of BAT from male Park7ΔUcp1 and Flox mice housed at TN for 8 weeks. Scale bars, 2 µm. e Immunoblotting for mitochondrial proteins in BAT from male Park7ΔUcp1 and Flox mice housed at TN for 8 weeks (n = 3 mice per group). f Oxygen consumption rate (OCR) analysis of BAT from male Park7ΔUcp1 and Flox mice housed at TN for 8 weeks (n = 4). gi RNA-seq analysis of BAT from male Park7ΔUcp1 and Flox mice housed at TN for 8 weeks, including heatmap of all changed genes (g), GO pathway analysis of up-regulated pathways (h), heatmap of whitening, thermogenesis, inflammation, fatty acid oxidation genes (i). j QPCR analysis for mRNA levels of Pparγ, Acadm, Ucp1, Ppargc1a, Dio2, Pank3 of BAT from male Park7ΔUcp1 and Flox mice housed at TN for 8 weeks (n = 5). k Immunoblotting for protein levels of PPARγ, PPARα, CPT1α, CPT1β, PGC1α, UCP1 of BAT from male Park7ΔUcp1 and Flox mice housed at TN for 8 weeks and quantification (n = 3 mice per group). Statistical significance was assessed by unpaired Student’s t-test. All results were expressed as means ± SEM and *p < 0.05, **p < 0.01. Student’s two-tailed unpaired T-test for 2-group comparisons. Source data are provided as a Source Data file.
Fig. 7
Fig. 7. CMA activity is required for Park7 ablation-induced BAT whitening.
a Immunoblotting for PARK7 and LAMP2A protein levels of BAT from male Park7ΔUcp1 and Flox mice 4 weeks after injection with AAV-shScramble or AAV-shLamp2a and totally housed at TN for 8 weeks. bi Measurements of metabolic parameters of indicated mice housed at TN for 8 weeks, including body weight (b), n = 5 mice per group; fat mass to body weight ratio (c), n = 5 mice per group; lean mass to body weight ratio (d), n = 5 mice per group; quantitation of VO2 (e), n = 5 mice per group; quantitation of VCO2 (f), n = 5 mice per group; quantitation of EE (g), n = 5 mice per group; GTT and AUC of GTT (h), n = 5 mice per group; ITT and AUC of ITT (i), n = 5 mice per group. jl Histochemistry analysis, including representative hematoxylin-eosin staining of BAT (j), representative immunohistochemical F4/80 (k) or UCP1 staining of BAT (l). Scale bar, 20 µm. m OCR analysis of BAT (n = 4). n Immunoblotting for PGC1α, UCP1 and mitochondrial protein levels of BAT and quantification (n = 3 mice per group). Statistical significance was assessed by unpaired Student’s t-test. All results were expressed as means ± SEM, *p < 0.05, **p < 0.01, ***p < 0.005. Student’s two-tailed unpaired T-test for 2-group comparisons. Source data are provided as a Source Data file.

Similar articles

References

    1. Kong, X. et al. Brown adipose tissue controls skeletal muscle function via the secretion of myostatin. Cell Metab.28, 631–643 e633 (2018). - PMC - PubMed
    1. Cannon, B. & Nedergaard, J. Brown adipose tissue: function and physiological significance. Physiol. Rev.84, 277–359 (2004). - PubMed
    1. Cannon, B., de Jong, J. M. A., Fischer, A. W., Nedergaard, J. & Petrovic, N. Human brown adipose tissue: Classical brown rather than brite/beige? Exp. Physiol.105, 1191–1200 (2020). - PubMed
    1. Fischer, A. W., Cannon, B. & Nedergaard, J. Optimal housing temperatures for mice to mimic the thermal environment of humans: An experimental study. Mol. Metab.7, 161–170 (2018). - PMC - PubMed
    1. Fischer, A. W., Cannon, B. & Nedergaard, J. The answer to the question “What is the best housing temperature to translate mouse experiments to humans?” is: thermoneutrality. Mol. Metab.26, 1–3 (2019). - PMC - PubMed

MeSH terms

Substances

LinkOut - more resources