. 2025 May 14;11(1):78.
doi: 10.1038/s41522-025-00705-x.

Extensively acquired antimicrobial-resistant bacteria restructure the individual microbial community in post-antibiotic conditions

Affiliations

Extensively acquired antimicrobial-resistant bacteria restructure the individual microbial community in post-antibiotic conditions

Jae Woo Baek et al. NPJ Biofilms Microbiomes. .

Abstract

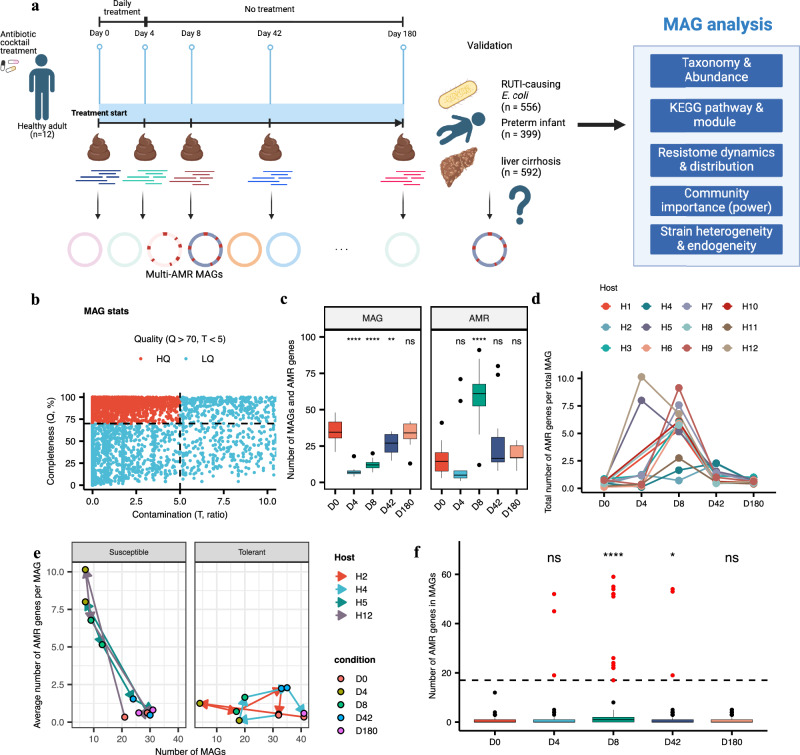
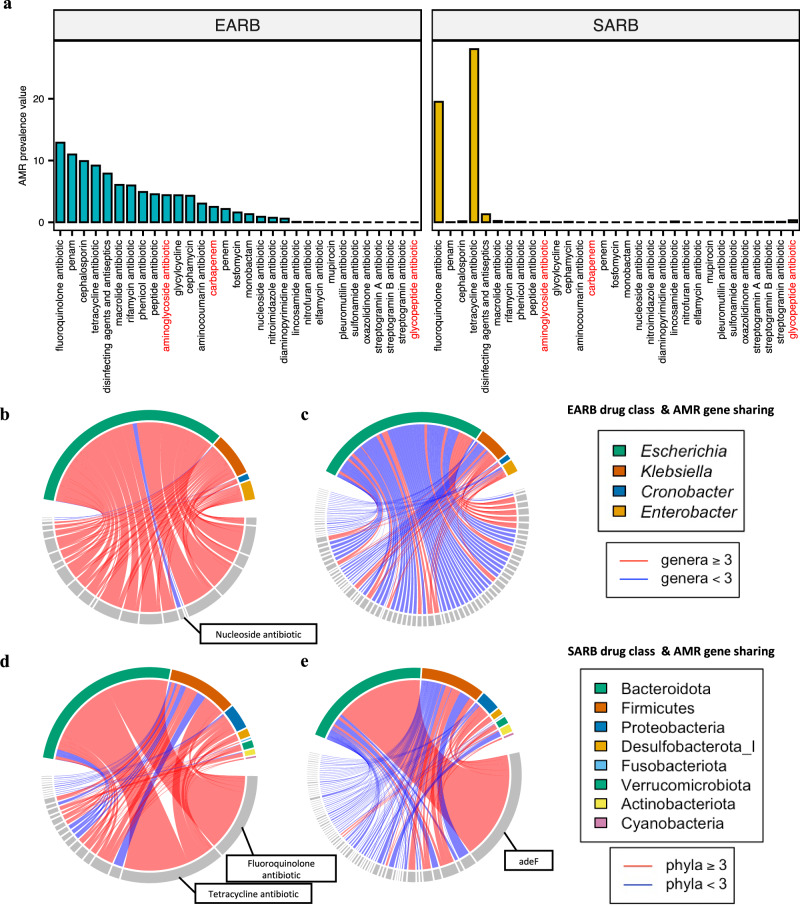
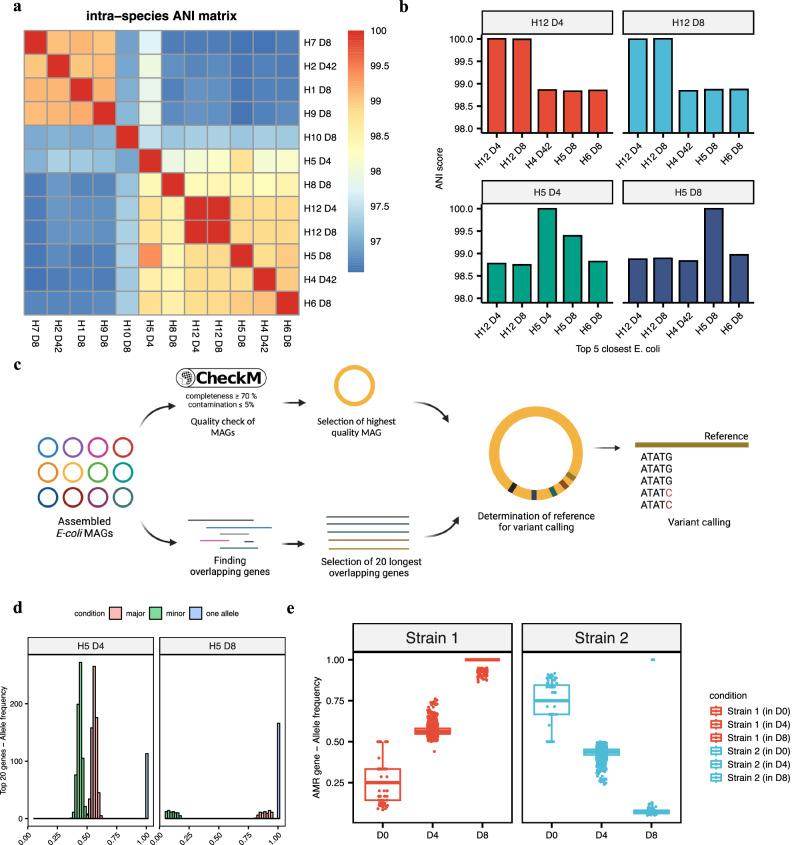
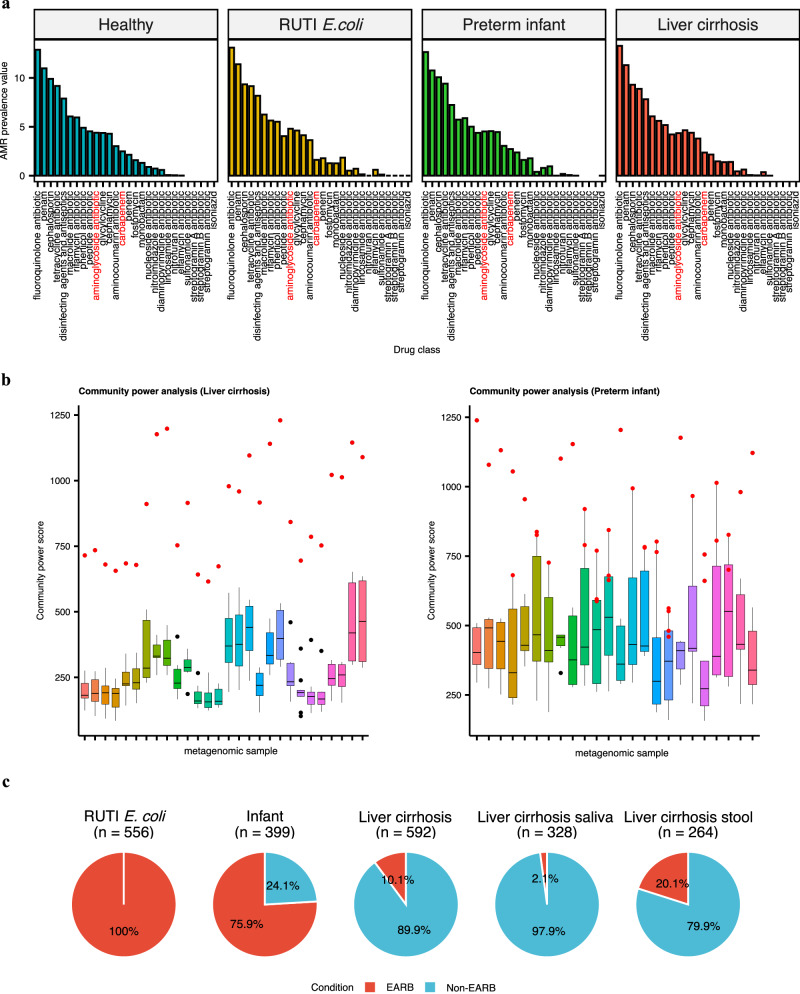
In recent years, the overuse of antibiotics has led to the emergence of antimicrobial-resistant (AMR) bacteria. To evaluate the spread of AMR bacteria, the reservoir of AMR genes (resistome) has been identified in environmental samples, hospital environments, and human populations, but the functional role of AMR bacteria and their persistence within individuals has not been fully investigated. Here, we performed a strain-resolved in-depth analysis of the resistome changes by reconstructing a large number of metagenome-assembled genomes from the gut microbiome of an antibiotic-treated individual. Interestingly, we identified two bacterial populations with different resistome profiles: extensively acquired antimicrobial-resistant bacteria (EARB) and sporadically acquired antimicrobial-resistant bacteria, and found that EARB showed broader drug resistance and a significant functional role in shaping individual microbiome composition after antibiotic treatment. Our findings of AMR bacteria would provide a new avenue for controlling the spread of AMR bacteria in the human community.


Conflict of interest statement

Competing interests: J.W.B., N.P., B.S., N.K., J.N., A.M., S.S., J.-I.K., J.W.S., A.K., and S.L. declared no financial competing interests. A.K. serves as an associate editor of this journal but had no involvement in the peer review or decision-making process for this manuscript. J.N. is a member of the advisory board of the journal, but he had no influence on the peer review process or decision to publish this paper.

Figures

Fig. 1
Fig. 1. Metagenome-assembled genomes revealed individual resistome changes and discovered bacteria that had acquired extensive antimicrobial resistance.
a Overview of the shotgun metagenome analysis conducted in this study. From 12 healthy adults, 56 metagenomics datasets were sampled at five different time points, and three additional datasets (recurrent urinary tract infection [RUTI]-causing Escherichia coli genomes, preterm infant metagenomes, and liver cirrhosis metagenomes) were used for further validation. b Scatter plot of metagenome-assembled genome (MAG) quality score of three different binning tools. Using CheckM algorithm, we selected high-quality MAGs (total number of high-quality (HQ) MAGs = 2585 [blue], total number of low-quality (LQ) MAGs = 5268 [red]) based on a completeness (Q) >70% and contamination (T) less than 5% (block dotted lines). c Boxplot of the number of refined MAGs based on the consensus of three binning tools (completeness > 70%, contamination < 5%; n = 1358) and the number of antimicrobial resistance (AMR) genes found in subjects at each sampling point. AMR genes were discovered by Resistance Gene Identifier (RGI) tool using the Comprehensive Antibiotic Resistance Database (statistical significance measured by Student’s t test comparing each time point group with the day (D)0 group as reference group. ****p ≤ 0.0001, **p ≤ 0.01). d Individual dynamics of the number of AMRs per MAG. Each line indicates AMR changes in a given host. e Line plots tracking the changes in the number of MAGs and average AMR gene burden per MAG of susceptible (Host 5 and 12) and tolerant subjects (Host 2 and 4). f AMR gene distribution within each MAG (n = 1358). MAGs containing more than 17 AMR genes (black dotted line) were regarded as bacteria that had acquired extreme resistance (EARB) (red dots, n = 20) (statistical significance measured by Student’s t test comparing each time point group with the D0 group, ****p ≤ 0.0001, *p ≤ 0.05).
Fig. 2
Fig. 2. Differential resistomes between EARB and SARB strains.
a Drug classes resistant to EARB and SARB strains identified by AMR prevalence scores. We calculated AMR prevalence scores based on the observed frequency of given drug classes in EARB or SARB strains, while normalizing them according to their carrier ratios. We show the AMR prevalence scores from EARB (left) and SARB (right) strains based on the descending orders of EARB prevalence scores (the class of antibiotics used for treatment in this study is colored red). b, c Circos plots of (b) shared drug classes (n = 23) and (c) shared AMR genes (n = 803) (upper bounds) of given genera of EARB (n = 4) (gray, lower bounds). Red links indicate drug classes or AMR genes shared by more than three genera, whereas blue links indicate those shared by less than three genera. d, e Circos plots of (d) shared drug classes (n = 26) and (e) shared AMR genes (n = 832) of given phyla of SARB (n = 8). Red links indicate drug classes or AMR genes shared by more than three phyla, whereas blue links indicate those shared by fewer than three phyla.
Fig. 3
Fig. 3. EARB strains harbored a greater functional repertoire capable of shaping the community.
a The outline of community power analysis. We calculated the functional repertoire of given microbial strains, herein termed community power scores, based on the number of genes harboring specific Kyoto Encyclopedia of Genes and Genomes orthology (KO) terms. In short, we counted the total functional repertoire of given microbial strains based on their genes harboring specific KO terms, after normalizing them according to the total number of KO terms in all the microbial strains in the given metagenomic samples. Therefore, all community power scores for microbes in a given metagenomic sample could be calculated and compared with each other. The microbes of the highest community power score had the highest functional repertoire in a given metagenomic sample. b Community power scores of metagenomic samples that carried EARB strains (n = 16). We compared the community power scores among EARB, SARB, and non-carriers (right panel) and found that EARB outscored the others (Student’s t test p values < 0.0001 [****]). c Co-abundance (i.e., Spearman’s correlation coefficients) of three EARB strains (Escherichia coli, Klebsiella oxytoca, Klebsiella pneumoniae) and four non-EARB strains with the highest community power score in one of the metagenomic samples (Bacteroides thetaiotaomicron, Bacteroides ovatus, Bilophila wadsworthia, Parabacteroides distasonis). Microbial strains significantly correlated with at least one of the seven selected strains (absolute correlation coefficients >0.3) are shown, and unknown metagenomic-based operational taxonomic unit (mOTU) species were excluded. Additionally, mOTUs that were not present in more than five metagenomic samples were also excluded (rows in the heatmap, n = 84). d The number of significantly correlated strains (absolute Spearman’s correlation coefficients >0.3) with EARB and non-EARB strains. e Negatively correlated between EARB abundance and species richness, based on the sum of log2-transformed relative abundances (rare < −10, −10 ≤ normal < −5, rich ≥ −5) and species richness. f Less-correlated patterns between sample groups of different non-EARB abundances, based on the sum of log2-transformed relative abundances (rare < −10, −10 ≤ normal < −5, rich ≥ −5) and species richness (relative abundance > 0). Differences between sample groups were tested using Wilcoxon rank-sum tests.
Fig. 4
Fig. 4. The enriched metabolic pathways of EARB strains in a given community.
a KEGG metabolic pathways or b KEGG modules significantly enriched among EARB strains compared to other microbes in given metagenomic samples (total number of EARB = 20 and total number of non-EARB compared = 217, Wilcoxon rank-sum test p values < 0.05, log2 fold change >0.5, and pathway coverage >0.3 or module coverage >0.8).
Fig. 5
Fig. 5. EARB strains were carried endogenously by some hosts and major strains alternated after antibiotic treatment.
a Intra-species average nucleotide identity (ANI) scores of E. coli strains belonging to EARB (n = 12). b Top 5 closest EARB E. coli strain ANI scores with two specific strains identified from the same host (H5, H12). c The workflow for the identification of single-nucleotide polymorphisms (SNPs) from a given metagenome sample. First, we selected 20 homologous genes with the longest lengths from all EARB E. coli MAGs as the on-target genes for SNP analysis. Next, we used the 20 gene set from the best-quality MAG for building reference and performed variant calling for metagenomics samples which contain EARB E. coli strains. d Allele frequency distributions of SNPs identified in metagenomic samples of host 5 at day 4 (left, n = 805) and day 8 (right, n = 240). We identified two different patterns of major and minor alleles, and also one allele existing in both strains. e SNP analysis was conducted using E. coli AMR genes of host 5 at day 8 as a reference set. We found that two E. coli strains shared same variant positions and different SNP profiles (nucleotide) under different conditions (median of allele frequencies for strain 1 at day 0, 4, and 8 = 0.250, 0.563, 1.000, respectively, and those for strain 2 at day 0, 4, and 8 = 0.750, 0.437, 0.0694, respectively).
Fig. 6
Fig. 6. EARB strains found in different antibiotic-exposed cohorts with the greatest functional impact on the community.
a AMR prevalence comparison between data from healthy adults and data from three different cohorts (recurrent urinary tract infection [RUTI]-causing E. coli, preterm infants, and patients with liver cirrhosis). b Community power analysis applied to the metagenomics samples of liver cirrhosis (left, n = 592) and preterm infant (right, n = 399) study data. Community power analysis was conducted on samples harboring five MAGs and at least one EARB strain (red dot indicates the EARB strain). c Proportion of samples containing EARB strains in three different datasets (E. coli isolate, preterm infant, and liver cirrhosis [saliva and stool]).

References

    1. Browne, A. J. et al. Global antibiotic consumption and usage in humans, 2000–18: a spatial modelling study. Lancet Planet Health5, e893–e904 (2021). - PMC - PubMed
    1. Ventola, C. L. The antibiotic resistance crisis: part 1: causes and threats. P T40, 277–283 (2015). - PMC - PubMed
    1. Abubakar, U., Al-Anazi, M., Alanazi, Z. & Rodriguez-Bano, J. Impact of COVID-19 pandemic on multidrug resistant gram positive and gram negative pathogens: a systematic review. J. Infect. Public Health16, 320–331 (2023). - PMC - PubMed
    1. Sommer, M. O. A., Dantas, G. & Church, G. M. Functional characterization of the antibiotic resistance reservoir in the human microflora. Science325, 1128–1131 (2009). - PMC - PubMed
    1. Gasparrini, A. J. et al. Persistent metagenomic signatures of early-life hospitalization and antibiotic treatment in the infant gut microbiota and resistome. Nat. Microbiol.4, 2285–2297 (2019). - PMC - PubMed

Substances

Grants and funding