. 2025 May 13;15(1):16550.
doi: 10.1038/s41598-025-01185-x.

Development and validation of a cancer-associated fibroblast gene signature-based model for predicting immunotherapy response in colon cancer

Affiliations

Development and validation of a cancer-associated fibroblast gene signature-based model for predicting immunotherapy response in colon cancer

Daoyang Zou et al. Sci Rep. .

Abstract

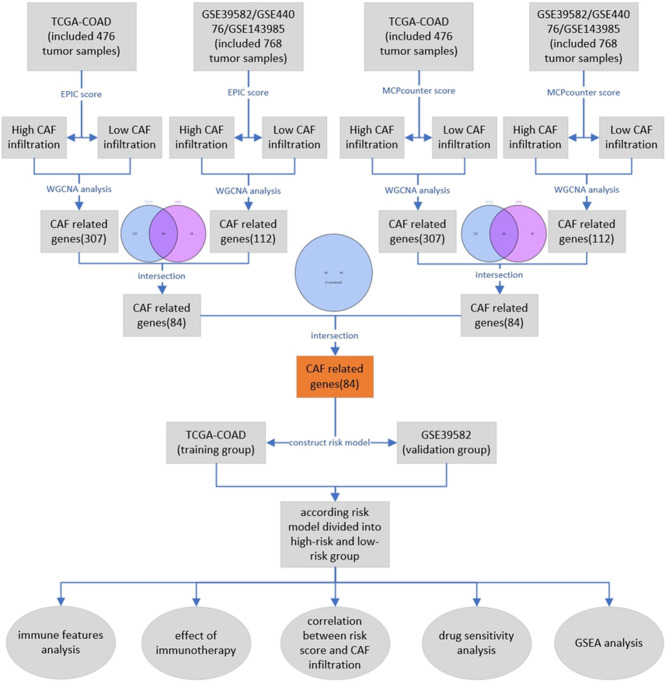
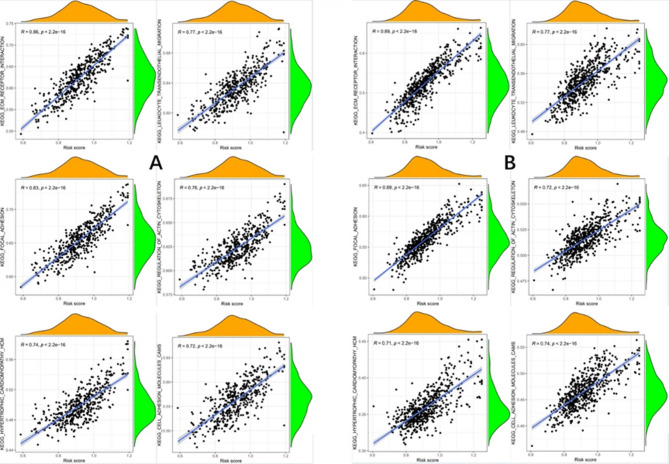
The efficacy of immune checkpoint inhibitors in colon cancer has been established, and there is an urgent need to identify new molecular markers for colon cancer immunotherapy to guide clinical decisions. Using the "EPIC" and "MCPcounter" R packages to conduct cancer-associated fibroblast (CAF) infiltration scoring on colon cancer samples from the TCGA database and the GEO database, the WGCNA analysis was performed on the two databases' samples based on the CAF infiltration scores to screen for CAF-related genes. LASSO regression analysis was used to construct a risk model with these genes. Comprehensive bioinformatics analysis was conducted on the constructed model to evaluate the stability of its prediction of CAF infiltration abundance and the stability of its prediction of immunotherapy efficacy. The newly constructed risk model could well reflect the abundance of CAF infiltration in colon cancer, with a correlation coefficient of 0.91 in the training cohort TCGA-COAD and 0.88 in the validation cohort GSE39582. GSEA analysis revealed that CAF is closely related to functions associated with extracellular matrix remodeling. The constructed risk model can predict the efficacy of immunotherapy in colon cancer well, with the high-risk group showing significantly poorer immunotherapy response than the low-risk group, with an expected effective rate of immunotherapy of 68 vs. 24% in the training group (P < 0.001) and 64 vs. 26% in the validation group (P < 0.001). The AUC value for predicting immunotherapy response by the risk model in the training group was 0.780 (95% CI 0.736-0.820), and in the validation group, the AUC value was 0.774 (95% CI 0.735-0.810). Drug sensitivity analysis showed that the expected chemotherapeutic effect in the low-risk group was superior to that in the high-risk group. CAF is associated with immunosuppression and drug resistance. Predicting the efficacy of immunotherapy in colon cancer based on the abundance of CAF infiltration is a feasible approach. For the high-risk population identified by our model, clinical consideration should be given to prioritizing non-immunotherapy approaches to avoid potential risks associated with immunotherapy.

Keywords: Cancer-associated fibroblasts (CAF); Colon cancer; Immunotherapy response prediction; Risk stratification model; Tumor microenvironment.


Conflict of interest statement

Declarations. Competing interests: The authors declare no competing interests.

Figures

Fig. 1
Fig. 1
The workflow of the study.
Fig. 2
Fig. 2
(A) The topological overlap matrix (TOM) of TCGA samples using weighted gene co-expression network analysis (WGCNA) based on the EPIC score. (B) The heatmap of module-trait correlations. (C) The TOM of GEO samples using WGCNA based on the EPIC score. (D) The heatmap of module-trait correlations. (E) The TOM of TCGA samples using WGCNA based on the MCPcounter score. (F) The heatmap of module-trait correlations. (G) The TOM of GEO samples using WGCNA based on the MCPcounter score. (H) The heatmap of module-trait correlations.
Fig. 3
Fig. 3
Perform GO analysis and KEGG analysis on the screened CAF-related genes. (A) GO analysis bubble chart. (B) KEGG analysis bubble chart. (C) The tuning parameter (λ) in the LASSO model (D) LASSO coefficient distribution of CAF-related genes. The samples were divided into high-risk and low-risk groups based on the constructed risk model. (E) There was a significant difference in the survival curves between the high-risk and low-risk groups in the TCGA-COAD cohort. (P = 0.002). (F) There was a significant difference in the survival curves between the high-risk and low-risk groups in the GSE39582 cohort. (P = 0.018)
Fig. 4
Fig. 4
(A) Correlation between risk scores and CAF infiltration abundance from different scoring software in the TCGA cohort. (B) Correlation between risk scores and CAF infiltration abundance from different scoring software in the GSE39582 cohort. (C) The expression pattern of CAF-related genes reported in previous studies in patients of both high and low-risk groups. (D,E) Validation in the CCLE database shows that the genes involved in model construction are highly expressed in fibroblasts and lowly expressed in large intestine tissues. (F) Risk scores are significantly correlated with most immune-related genes associated with immunotherapy.
Fig. 5
Fig. 5
(A) In the TCGA cohort, the TIDE scores in the low-risk group are significantly lower than those in the high-risk group (P < 0.001 is * * *). (B) In the GSE39582 cohort, the TIDE scores in the low-risk group are significantly lower than those in the high-risk group (P < 0.001 is * * *). Suggesting that the low-risk group exhibits a significantly better response to immunotherapy compared to the high-risk group. (C) Bar graph of expected response rate in TCGA cohort (68 vs. 24%, P < 0.001). (D) Bar graph of expected response rate in GSE39582 cohort (64 vs. 26%, P < 0.001). (E) In the TCGA cohort, the area under the curve (AUC) for predicting the efficacy of immunotherapy based on the risk model is 0.780. (F) In the GSE39582 cohort, the AUC for predicting the efficacy of immunotherapy based on the risk model is 0.774. Different drug sensitivity of the high and low-risk groups. (G) Oxaliplatin. (H) 5-fluorouracil. (I) irinotecan.
Fig. 6
Fig. 6
Similar functional enrichment between the TCGA cohort and the GSE39582 cohort in the high-risk group. (A) TCGA cohort. (B) GSE39582 cohort. Similar pathway enrichment between the TCGA cohort and the GSE39582 cohort in the high-risk group. (C) TCGA cohort. (D) GSE39582 cohort.
Fig. 7
Fig. 7
The TCGA cohort and the GSE39582 cohort have different functional enrichments in the low-risk group. (A) TCGA cohort. (B) GSE39582 cohort. The TCGA cohort and the GSE39582 cohort have different pathway enrichments in the low-risk group. (C) TCGA cohort. (D) GSE39582 cohort.
Fig. 8
Fig. 8
ssGSEA analysis was performed to identify pathways most correlated with the risk score. (A) TCGA cohort. (B) GSE39582 cohort.
Fig. 9
Fig. 9
The ESTIMATE scores of the high-risk and low-risk groups are significantly different. (A) TCGA cohort. (B) GSE39582 cohort. The CIBERSORT algorithm evaluated the infiltration of 22 types of immune cells in both the high-risk and low-risk groups. (C) TCGA cohort. (D) GSE39582 cohort.

Similar articles

References

    1. Sung, H. et al. Global cancer statistics 2020: GLOBOCAN estimates of incidence and mortality worldwide for 36 cancers in 185 countries. CA Cancer J. Clin.71 (3), 209–249 (2021). - PubMed
    1. Siegel, R. L., Miller, K. D., Wagle, N. S. & Jemal, A. Cancer statistics, 2023. CA Cancer J. Clin. 12 (2023). - PubMed
    1. Siegel, R. L., Wagle, N. S., Cercek, A., Smith, R. A. & Jemal, A. Colorectal cancer statistics, 2023. CA Cancer J. Clin. 1 (2023). - PubMed
    1. Vogel, J. D., Eskicioglu, C., Weiser, M. R., Feingold, D. L. & Steele, S. R. The American society of colon and rectal surgeons clinical practice guidelines for the treatment of colon cancer. Dis. Colon Rectum. 60 (10), 999–1017 (2017). - PubMed
    1. Taieb, J. & Gallois, C. Adjuvant chemotherapy for stage III colon cancer. Cancers (Basel)12 (9) (2020). - PMC - PubMed

MeSH terms

Substances

LinkOut - more resources