

Constructing a prediction model for acute pancreatitis severity based on liquid neural network
- PMID: 40360617
- PMCID: PMC12075669
- DOI: 10.1038/s41598-025-01218-5
Constructing a prediction model for acute pancreatitis severity based on liquid neural network
Abstract
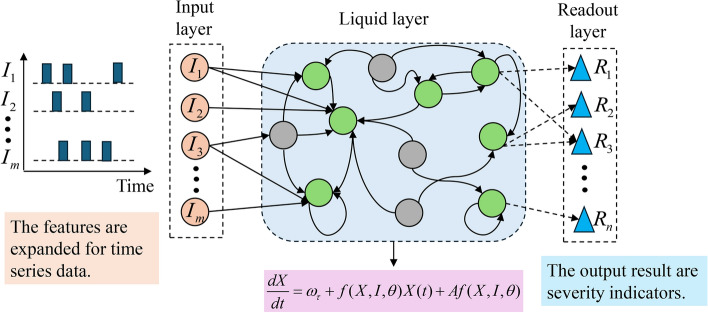
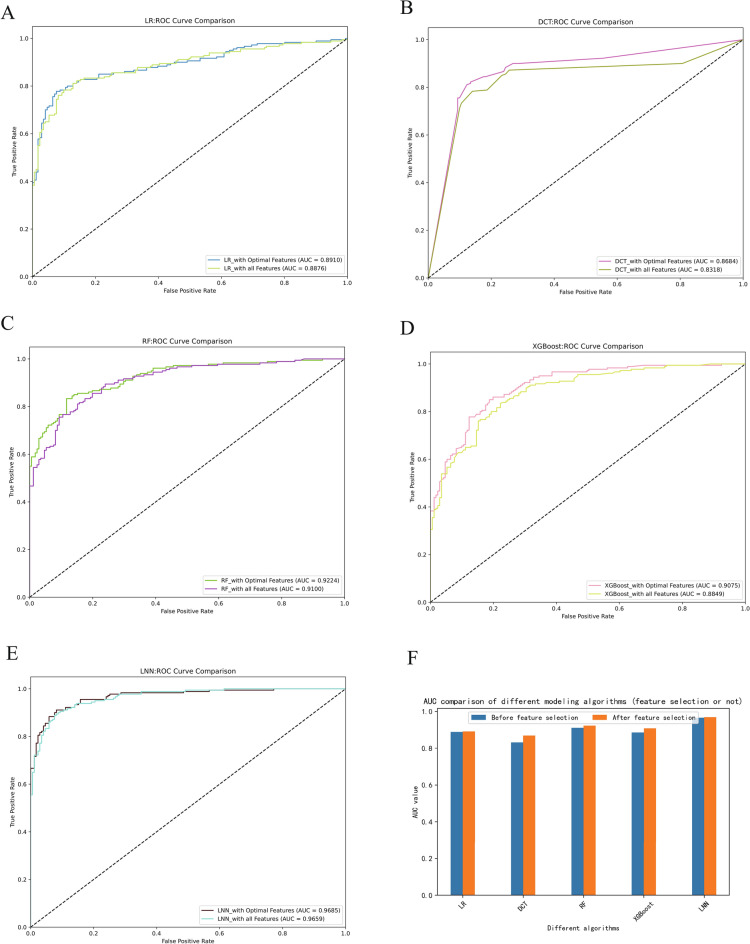
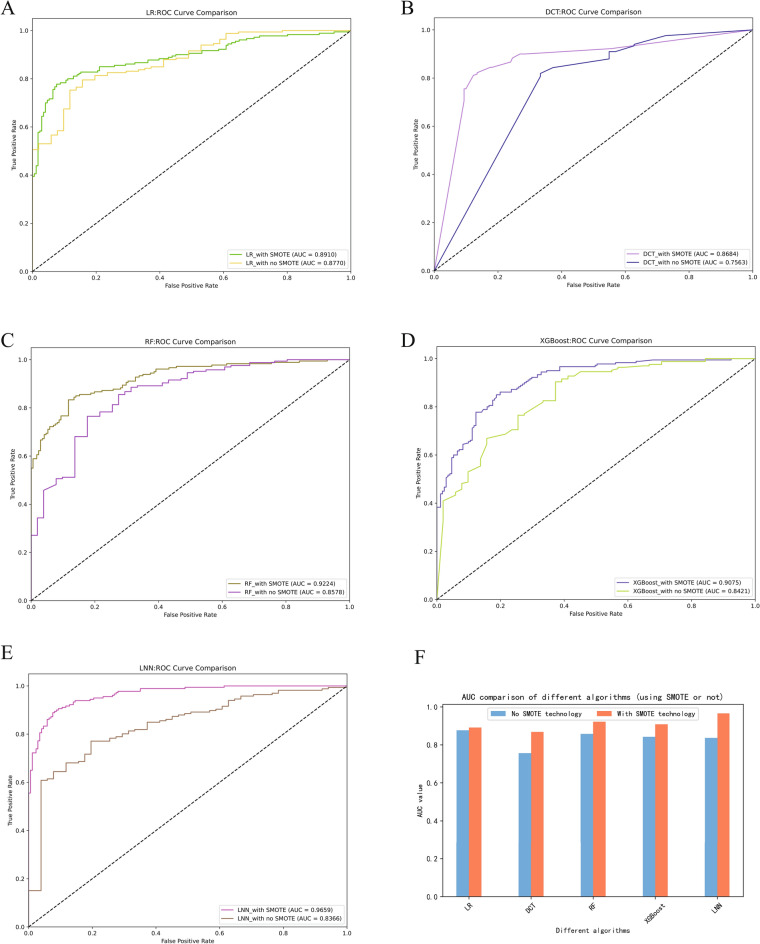
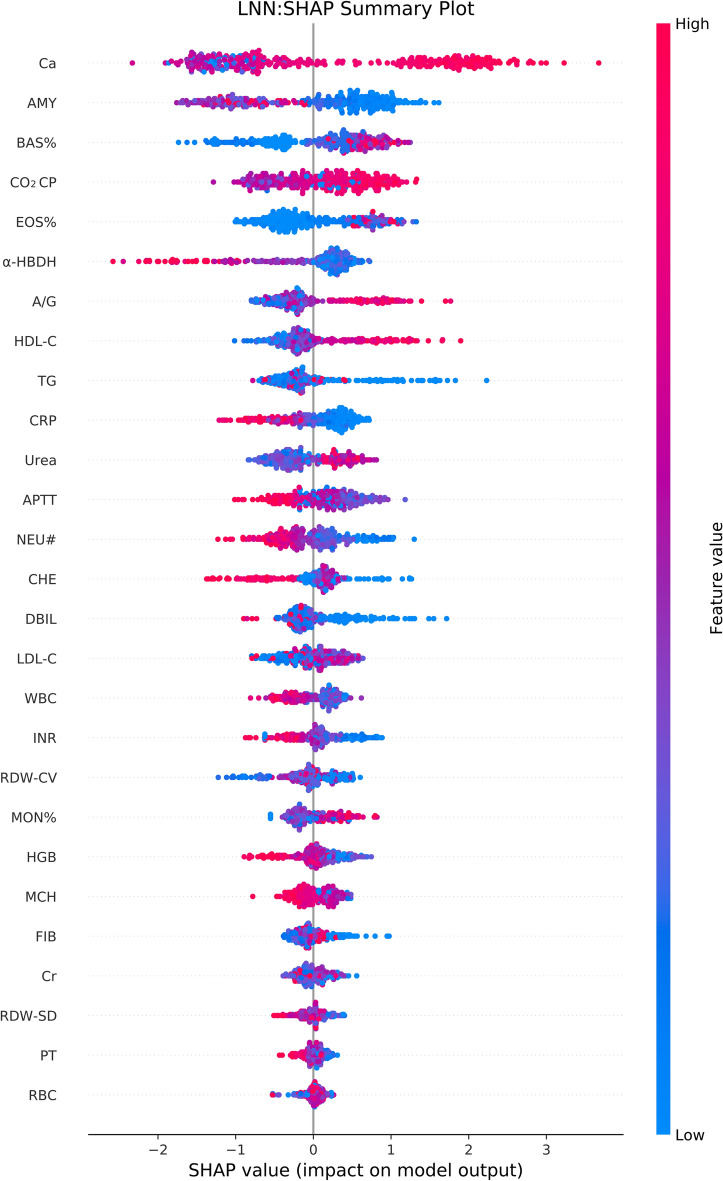
Acute pancreatitis (AP) is a common disease, and severe acute pancreatitis (SAP) has a high morbidity and mortality rate. Early recognition of SAP is crucial for prognosis. This study aimed to develop a novel liquid neural network (LNN) model for predicting SAP. This study retrospectively analyzed the data of AP patients admitted to the Second Affiliated Hospital of Guilin Medical University between January 2020 and June 2024. Data imbalance was dealt with by data preprocessing and using the synthetic minority oversampling technique (SMOTE). A new feature selection method was designed to optimize model performance. Logistic regression (LR), decision tree (DCT), random forest (RF), Extreme Gradient Boosting (XGBoost), and LNN models were built. The model's performance was evaluated by calculating the area under the receiver operating characteristic (ROC) curve (AUC) and other statistical metrics. In addition, SHapley Additive exPlanations (SHAP) analysis was used to interpret the prediction results of the LNN model. The LNN model performed best in predicting AP severity, with an AUC value of 0.9659 and accuracy, precision, recall, F1 score, and specificity higher than 0.90. SHAP analysis revealed key predictors, such as calcium level, amylase activity, and percentage of basophils, which were strongly associated with AP severity. As an emerging machine learning tool, the LNN model has demonstrated excellent performance and potential in AP severity prediction. The results of this study support the idea that LNN models can be applied to early severity assessment of AP patients in a clinical setting, which can help optimize treatment plans and improve patient prognosis.
Keywords: Liquid neural network; Machine learning; Predictive models; Severe acute pancreatitis.
© 2025. The Author(s).
Conflict of interest statement
Declarations. Competing interests: The authors declare that the research was conducted in the absence of any commercial or financial relationships that could be construed as a potential conflict of interest. Ethics approval and consent to participate: Studies involving human participants underwent a review and approval process by the Ethics Committee of the Second Affiliated Hospital of Guilin Medical University. Patients participating in the study signed an informed consent form through themselves and/or their legal guardians. The study was approved by the Ethics Committee of the Second Affiliated Hospital of Guilin Medical University (NO.ZLXM-2024013).
Figures


References
-
- Na Zhang, X. G., Haiyan, Zhang & Liu, L. Meta-analysis of the etiologic changes of acute pancreatitis in china in the last decade. Chin. J. Digest. Dis. Imaging: Electron. Ed.6, 71–75 (2016).
-
- Khan, J. A. Role of crp in monitoring of acute pancreatitis. Clinical Significance of C-reactive Protein, 117–173 (2020).
-
- JH, R. Prognostic signs and the role of operative management in acute pancreatitis. Surg. Gynecol. Obstet.139, 69–81 (1974). - PubMed
MeSH terms
Grants and funding
- Guike ZY23055033/the Central Guided Local Science and Technology Development Fund Project
- 2024GXNXFAA010088/the Guangxi Natural Science Foundation
- 20230116-2/the Guilin Scientific Research and Technology Development Program Projects
- S2023126/the Guangxi medical and health care appropriate technology development and popularization and application project
LinkOut - more resources
Full Text Sources
Other Literature Sources
Medical
Research Materials
Miscellaneous
