

Peri-coronary adipose tissue attenuation and its association with plaque vulnerability and clinical outcomes in coronary artery disease using combined CCTA and OCT
- PMID: 40360624
- PMCID: PMC12075659
- DOI: 10.1038/s41598-025-00023-4
Peri-coronary adipose tissue attenuation and its association with plaque vulnerability and clinical outcomes in coronary artery disease using combined CCTA and OCT
Abstract
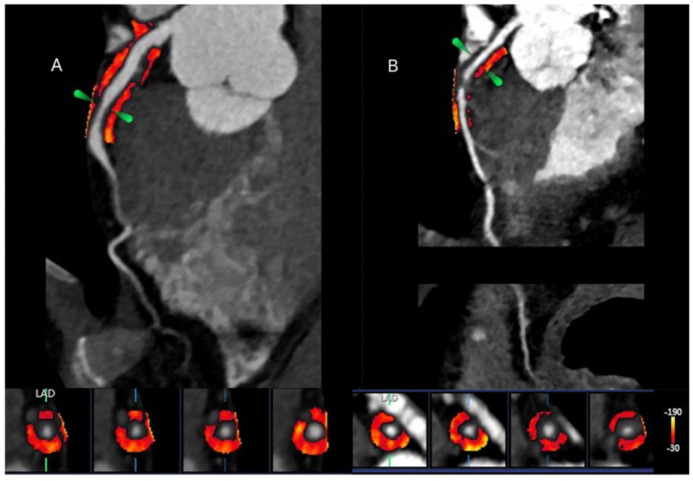
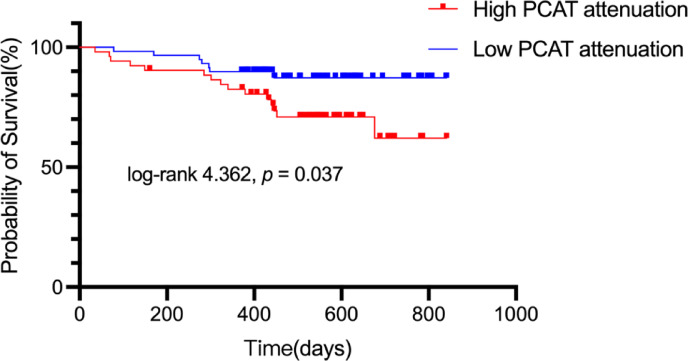
Vascular inflammation plays a pivotal role in the pathogenesis of atherosclerotic plaques, driving their progression from a stable to an unstable phenotype. Previous research has identified a relationship between peri-coronary adipose tissue (PCAT) attenuation, as assessed by coronary computed tomography angiography (CCTA), and the degree of coronary inflammation, which is associated with an elevated risk of cardiovascular mortality. Nevertheless, the interplay between PCAT attenuation, as determined by CCTA, and plaque characterization via optical coherence tomography (OCT), alongside clinical outcomes, remains inadequately explored. In this study, we retrospectively analyzed data from 111 patients with coronary artery disease who underwent a sequential diagnostic workup comprising CCTA, coronary angiography (CAG), and OCT from January 2022 to May 2023. Patients were stratified into two groups based on a PCAT attenuation threshold of -70.1 Hounsfield units (HU): a high-PCAT attenuation group (n = 39) and a low-PCAT attenuation group (n = 72). The cohort was further divided into major adverse cardiac event (MACE) and non-MACE groups, depending on whether a MACE occurred during a median follow-up period of 504 days. Compared to the low-PCAT attenuation group, patients in the high-PCAT attenuation group were younger (55.77 ± 9.33 vs. 60.07 ± 9.88; p < 0.028) and exhibited a higher incidence of acute coronary syndrome (ACS) (30.8% vs. 13.9%; p = 0.033). Additionally, lipid-rich plaques (84.6% vs. 52.8%; p = 0.001), macrophages (79.5% vs. 51.4%; p = 0.004), thin-cap fibrous atherosclerotic plaques (TCFA) (43.6% vs. 25.0%; p = 0.044), and red blood clots (33.3% vs. 15.3%; p = 0.027) were more prevalent in the high-attenuation group. Multivariate logistic regression analysis revealed that high PCAT attenuation was an independent predictor of lipid plaques, macrophage presence, and TCFA. During the follow-up period, 22 patients (19.8%) experienced a primary clinical endpoint event. Patients in the MACE group demonstrated higher levels of PCAT attenuation compared to those in the non-MACE group (- 69.67 [- 74.75, - 65.59] HU vs. - 73.67 [- 76.67, - 69.50] HU, p = 0.037). Multivariate Cox proportional hazards regression modeling further substantiated that elevated PCAT attenuation was independently associated with an increased risk of MACE. In conclusion, the high-attenuation group exhibited more OCT-detected features indicative of vulnerable plaques and a higher frequency of MACE events relative to the low-attenuation group. These findings suggest a significant association between elevated vascular inflammation, as reflected by PCAT attenuation, vulnerable plaque characteristics identified by OCT, and poorer clinical outcomes.
Keywords: Clinical outcomes; Optical coherence tomography; Peri-coronary adipose tissue; Plaque vulnerability.
© 2025. The Author(s).
Conflict of interest statement
Declarations. Competing interests: The authors declare that they have no known competing financial interests or personal relationships that could have appeared to influence the work reported in this paper. Ethical approval: The protocol was approved by the Ethics Committee of the Affiliated Hospital of Zunyi Medical University. Consent to participate: Informed consent was obtained from all individual participants included in the study.
Figures


Similar articles
-
Coronary Inflammation and Plaque Vulnerability: A Coronary Computed Tomography and Optical Coherence Tomography Study.Circ Cardiovasc Imaging. 2023 Mar;16(3):e014959. doi: 10.1161/CIRCIMAGING.122.014959. Epub 2023 Mar 3. Circ Cardiovasc Imaging. 2023. PMID: 36866660
-
Different plaque types and its association with the volume and attenuation of pericoronary adipose tissue as assessed by coronary computed tomography angiography.Clin Radiol. 2025 May;84:106814. doi: 10.1016/j.crad.2025.106814. Epub 2025 Jan 15. Clin Radiol. 2025. PMID: 40069975
-
Relationship of OCT-defined plaque characteristics with CCTA-derived coronary inflammation and CMR-derived global coronary flow reserve in patients with acute coronary syndrome.PLoS One. 2023 May 25;18(5):e0286196. doi: 10.1371/journal.pone.0286196. eCollection 2023. PLoS One. 2023. PMID: 37228044 Free PMC article.
-
Association of Pericoronary Adipose Attenuation With Major Adverse Cardiovascular Events and High-Risk Plaque.JACC Cardiovasc Imaging. 2025 Aug;18(8):884-894. doi: 10.1016/j.jcmg.2025.04.008. Epub 2025 Jul 10. JACC Cardiovasc Imaging. 2025. PMID: 40643422
-
Computed tomography and nuclear medicine for the assessment of coronary inflammation: clinical applications and perspectives.J Cardiovasc Med (Hagerstown). 2023 Apr 1;24(Suppl 1):e67-e76. doi: 10.2459/JCM.0000000000001433. J Cardiovasc Med (Hagerstown). 2023. PMID: 37052223 Review.
References
-
- Ross, R. Atherosclerosis–an inflammatory disease. N Engl. J. Med.340, 115–126. 10.1056/nejm199901143400207 (1999). - PubMed
-
- Antonopoulos, A. S. et al. Detecting human coronary inflammation by imaging perivascular fat. Sci. Transl Med.910.1126/scitranslmed.aal2658 (2017). - PubMed
-
- Antoniades, C., Antonopoulos, A. S. & Deanfield, J. Imaging residual inflammatory cardiovascular risk. Eur. Heart J.41, 748–758. 10.1093/eurheartj/ehz474 (2020). - PubMed
-
- Dweck, M. R., Fayad, Z. A. & Imaging Perivascular fat - an unheralded informant of coronary inflammation. Nat. Rev. Cardiol.14, 573–574. 10.1038/nrcardio.2017.127 (2017). - PubMed
MeSH terms
Grants and funding
LinkOut - more resources
Full Text Sources
Medical
Miscellaneous
