. 2025 Jun;10(6):1447-1462.
doi: 10.1038/s41564-025-02006-7. Epub 2025 May 13.

Intragenic viral silencer element regulates HTLV-1 latency via RUNX complex recruitment

Affiliations

Intragenic viral silencer element regulates HTLV-1 latency via RUNX complex recruitment

Kenji Sugata et al. Nat Microbiol. 2025 Jun.

Abstract

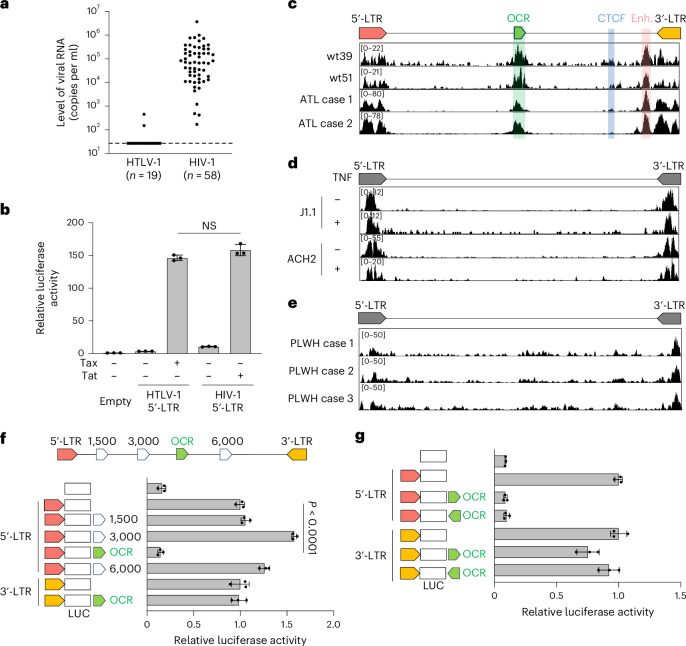
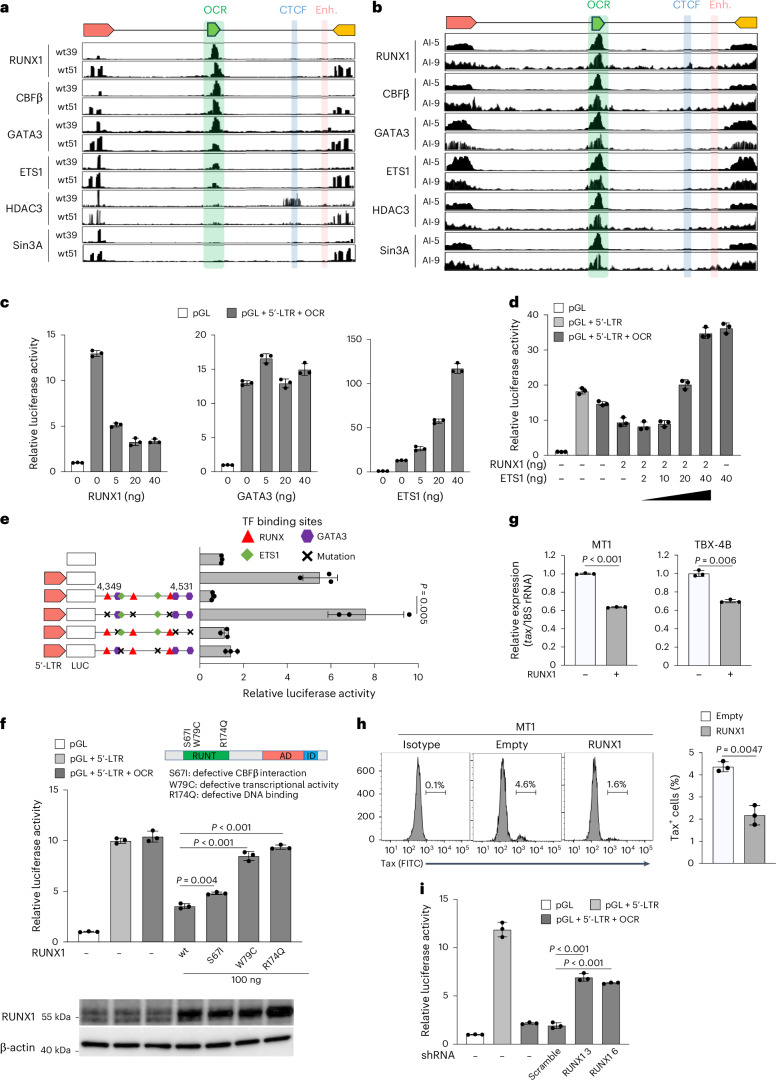
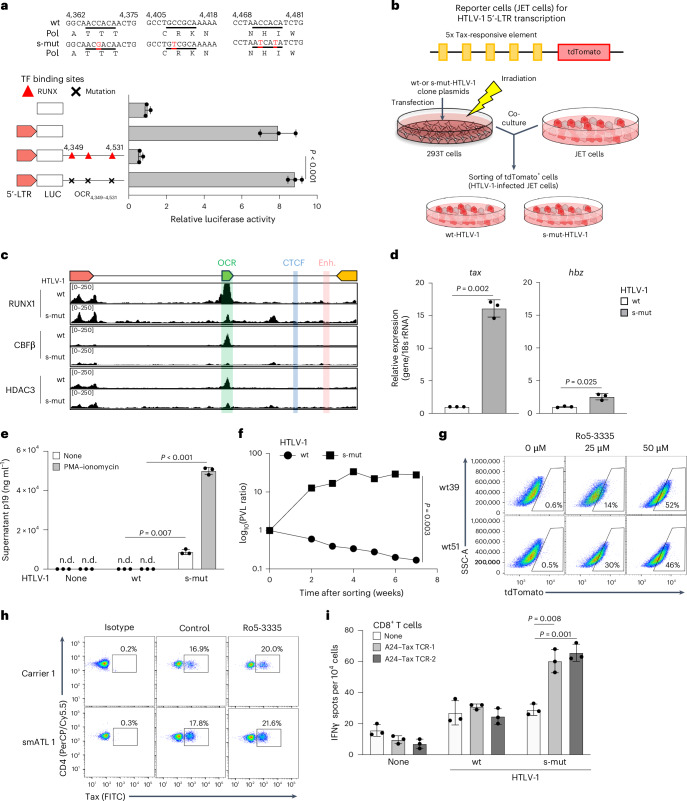
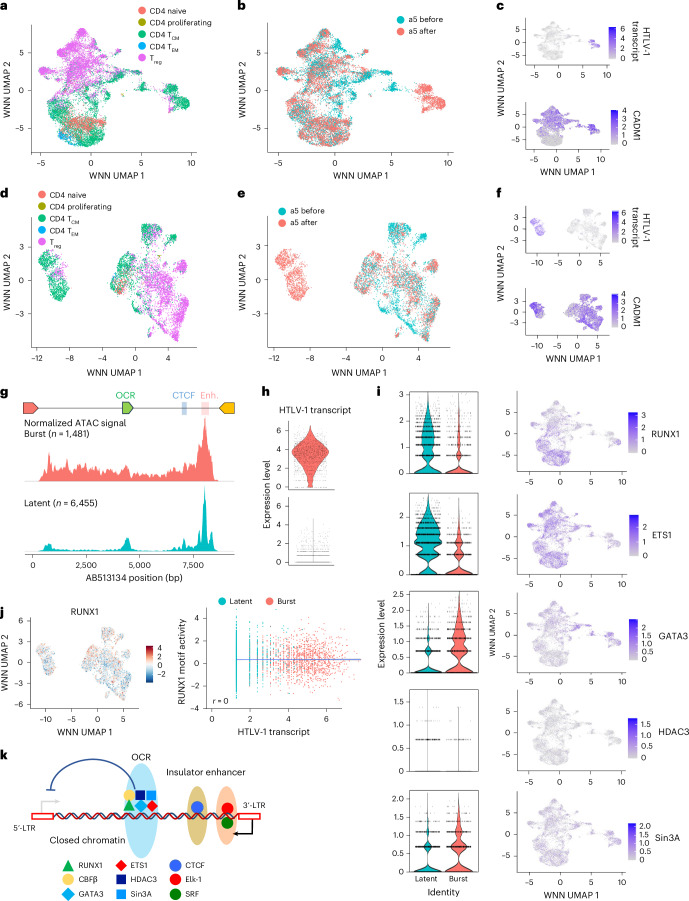
Retroviruses integrate their genetic material into the host genome, enabling persistent infection. Human T cell leukaemia virus type 1 (HTLV-1) and human immunodeficiency virus type 1 (HIV-1) share similarities in genome structure and target cells, yet their infection dynamics differ drastically. While HIV-1 leads to high viral replication and immune system collapse, HTLV-1 establishes latency, promoting the survival of infected cells and, in some cases, leading to leukaemia. The mechanisms underlying this latency preference remain unclear. Here we analyse blood samples from people with HTLV-1 and identify an open chromatin region within the HTLV-1 provirus that functions as a transcriptional silencer and regulates transcriptional burst. The host transcription factor RUNX1 binds to this open chromatin region, repressing viral expression. Mutation of this silencer enhances HTLV-1 replication and immunogenicity, while its insertion into HIV-1 suppresses viral production. These findings reveal a strategy by which HTLV-1 ensures long-term persistence, offering potential insights into retroviral evolution and therapeutic targets.


Conflict of interest statement

Competing interests: The authors declare no competing interests.

Figures

Fig. 1
Fig. 1. Identification of an OCR in the middle of the HTLV-1 proviral genome with a suppressive function on the promoter activity of the HTLV-1 5′-LTR.
a, Plasma viral RNA levels in HTLV-1- or HIV-1-infected individuals. Viral RNA copy numbers were evaluated by reverse-transcription quantitative PCR (RT-qPCR) and ddPCR for HTLV-1 and HIV-1, respectively. b, The transcriptional activity of HTLV-1 or HIV-1 5′-LTRs was assessed by luciferase (LUC) reporter assay in Jurkat T cells with their respective trans-activators (Tax and Tat). ce, ATAC-seq signals in the provirus region (5′-LTR, OCR, CTCF, enhancer (Enh.) and 3′-LTR) of HTLV-1-infected Jurkat T cell clones (wt39 and wt51) and PBMCs from two patients with ATL (c), HIV-1-infected T cell lines (J1.1 and ACH2) with or without TNF stimulation (d) and PBMCs from three HIV-1-infected individuals (people living with HIV-1, PLWH) (e). f,g, Effect of the OCR or three randomly selected proviral regions on the 5′-LTR or the 3′-LTR promoter activity. Jurkat T cells were used for luciferase reporter assay 48 h after transfection (f). The directionality of the OCR did not change the effect on the 5′-LTR or the 3′-LTR promoter activity (g). At least two independent experiments were performed. The bars and error bars represent the mean ± s.d. of results in triplicate experiments. P values were calculated using a two-sided, unpaired Student’s t-test (NS, not significant). Source data
Fig. 2
Fig. 2. Molecular characterization of the silencer complex on the OCR.
a,b, ChIP-seq signals with HTLV-1 DNA-capture analysis for RUNX1, CBFβ, GATA3, ETS1, HDAC3 and Sin3A in HTLV-1-infected Jurkat T cell clones (wt39 and wt51) (a) and PBMCs of patients with ATL (Al-5 and AI-9) (b). c, Effect of overexpression of RUNX1, GATA3 or ETS1 on the 5′-LTR promoter activity with the OCR in 293T cells. d, Effect of overexpression of RUNX1 and/or ETS1 on the 5′-LTR promoter activity with the OCR in 293T cells. e, Changes in OCR-mediated silencing by mutating RUNX, GATA3 and ETS1 binding sites within the OCR in Jurkat T cells. f, Transcriptional regulation of RUNX1 mutants (S67I, W79C and R174Q) in OCR-mediated silencing of HTLV-1 5′-LTR in 293T cells. Protein expression of RUNX1 mutants was confirmed twice by western blot. g, Representative RT-qPCR result of tax mRNA expression in MT1 and TBX-4B cells transduced with RUNX1. h, Measurement of Tax protein levels in RUNX1-overexpressed MT1 cells. RUNX1 was transduced using a retroviral vector system. One representative result from each flow cytometry assay (left) and the cumulative Tax positivity values from a triplicate assay (right) are shown. i, Effect of RUNX1 knockdown via shRNA on OCR-mediated silencing of the HTLV-1 5′-LTR. Molt4 cells carrying shRNA for RUNX1 were used for luciferase assay. Luciferase reporter assays were performed 48 h after transfection. The results are representative of at least two independent experiments. The bars and error bars represent the mean ± s.d. of the results of triplicate experiments. P values were calculated using a two-sided, unpaired Student’s t-test. Source data
Fig. 3
Fig. 3. Virological and immunological significance of the OCR function in HTLV-1 infection.
a, The nucleotide and protein sequences of silent mutations (s-mut) in the RUNX binding site (underlined) within the OCR. Mutated nucleotides are shown in red. Luciferase reporter assays were performed using Jurkat T cells 48 h after transfection. b, Experimental workflow illustrating the establishment of reporter cells (JET cells) infected with wt- or s-mut-HTLV-1. c, Signals from RUNX1, CBFβ or HDAC3 ChIP-seq in the HTLV-1 provirus for wt- and s-mut-HTLV-1-infected JET cells. d, Representative RT-qPCR results showing tax or hbz mRNA expression levels in JET cells infected with wt- or s-mut-HTLV-1. e, Supernatant p19 ELISA results from JET cells infected with wt- or s-mut-HTLV-1 with or without PMA–ionomycin stimulation. f, PVLs during long-term culture in wt- or s-mut-HTLV-1-infected JET cells after tdTomato sorting. The data presented are representative of two independent experiments. g, Tax expression after treatment with RUNX1 inhibitor (Ro5-3335). Tax expression was analysed by expression of the reporter protein tdTomato. h, Effect of RUNX1 inhibitor on ex vivo Tax expression using PBMCs of ACs and patients with ATL. Tax-expressing CD4+ T cells were measured by flow cytometry. i, IFNγ ELISPOT assay results from Tax TCR-transduced CD8+ T cells cocultured with wt- or s-mut-HTLV-1-infected JET cells expressing HLA-A*24:02 (A24). At least two independent experiments were performed. The bars and error bars represent the mean ± s.d. of results in triplicate experiments. P values were calculated using a two-sided, unpaired Student’s t-test (n.d., not detectable). Source data
Fig. 4
Fig. 4. Single-cell multiome analysis of CD4+ T cells from a smouldering ATL case (a5).
a,b, WNN UMAP projection of all cells, both before and after cultivation identified using multimodal neighbours by weighting a combination of ATAC and RNA data. Cells are labelled by cell type (a) and before or after cultivation (b). c, Heatmaps of expression levels of viral RNA and CADM1, a marker of HTLV-1-infected cells. d,e, WNN UMAP projection of only HTLV-1-infected cells, both before and after cultivation identified using multimodal neighbours by weighting a combination of ATAC and RNA data. Cells are labelled by cell type (d) and before or after cultivation (e). f, Heatmaps of expression levels of viral RNA and CADM1, a marker of HTLV-1 infected cells. g, Aggregated and normalized ATAC signals of burst and latent cell clusters in the proviral region. h, Violin plots of viral RNA expression in burst and latent cell clusters. i, Violin plots of infected cells and UMAP projections of all cells with a heatmap showing the RNA expression level of transcription factors related to the OCR in burst and latent cell clusters. j, Heatmaps of RUNX1 motif activity and a correlation plot showing the relationship between the sense transcription of HTLV-1 (horizontal axis) and the motif activity of RUNX1 (vertical axis). The blue line represents the regression line. The plot is labelled for burst and latent clusters. k, Schematic figure of the OCR-mediated silencing in HTLV-1 provirus.
Fig. 5
Fig. 5. Introduction of HTLV-1 OCR into rHIV-1 decreases proviral expression, virus production and cytopathic effect.
a, Schematic representation of the rHIV-1 construction with wt- or mt-OCR derived from HTLV-1. The NL4-3 plasmid was used to generate the rHIV-1 constructs. b, Effect of HTLV-1 wt- or mt-OCR on the HIV-1 5′-LTR promoter activity. Luciferase reporter assays were performed using Jurkat T cells 48 h after transfection. c, Quantification of cell-associated viral DNAs after infection with each rHIV-1. gDNAs were extracted from Jurkat T cells infected with each rHIV-1. d, RUNX1 ChIP–qPCR analysis of Jurkat T cells infected with rHIV-1 with wt- or mt-OCR. Enhancer RUNX1 region (eRUNX1) was used as a positive control for ChIP. e, HIV-1 production in Jurkat T cells infected with rHIV-1. Intracellular HIV-1 p24+ cells were detected using flow cytometry. f, Assessment of the cytopathic effect induced by rHIV-1. Cell viability and dead cell counts were determined using the trypan blue exclusion method. g, A representative workflow and flow cytometry results of the WIPE assay using each rHIV-1 are presented. At least two independent experiments were performed. The bars and error bars represent the mean ± s.d. of results in triplicate experiments. P values were calculated using a two-sided unpaired Student’s t-test. Source data
Extended Data Fig. 1
Extended Data Fig. 1. Correlation between plasma viral RNA and proviral DNA load (PVL) in HTLV-1 infected asymptomatic carriers, characteristics of HTLV-1-infected Jurkat T cell clones (wt39 and wt51), and ATAC-seq result of cell-lines infected with STLV-1, HTLV-2, or BLV.
a, Correlation between plasma viral RNA level and PVL in 19 HTLV-1 asymptomatic carriers. b, tdTomato expression driven by Tax-responsive element from wt39 and wt51 was analyzed by flowcytometry. Uninfected JET cells were used as negative control for gating. c-d, wt39 and wt51 cells contain single integration of intact HTLV-1 provirus, which was determined by HTLV-1 DNA capture seq in previous study. e, Total cell-associated HTLV-1 DNA was measured by primers for tax region. 2-LTR circle was quantified as an episomal form of HTLV-1 DNA. f, ATAC-seq was performed for STLV-1, HTLV-2 or BLV infected cell-lines (Si-2, MoT or FLK-BLV). Source data
Extended Data Fig. 2
Extended Data Fig. 2. Expression profile of RUNX, ETS, and GATA family genes in PBMC subset.
a-c, Single cell multiome (ATAC and GEX) analysis using data from healthy donor. Violin plots of RNA expression levels of RUNX family (a), GATA family (b) and ETS family (c) across different PBMC cell types. d, 5′-LTR transcriptional regulation of HTLV-1 OCR by RUNX family. 293 T cells were used for luciferase reporter assay at 48 hours after transfection. At least 2 independent experiments were performed. Bars and error bars represent the mean ± SD of results in triplicate experiments. p values were calculated using a two-sided, unpaired Student’s t-test. Source data
Extended Data Fig. 3
Extended Data Fig. 3. Molecular characterization of the OCR silencer and conservation of the RUNX-binding site sequence in the OCR among various HTLV-1 strains.
a, Sequence of HTLV-1 OCR4349-4531. RUNX binding sites were shown in bold, GATA3 binding sites are underlined and ETS1 binding sites are highlighted in gray. b, Luciferase assay of reporter plasmids containing essential region for the suppressive effect of 5′-LTR mediated by OCR. Jurkat T cells were used for luciferase assay. c, Effect of overexpression of RUNX1, GATA3 or ETS1 on promoter activity of the HTLV-1 5′-LTR alone in 293 T cells. d, The ratio of relative luciferase values between 5′-LTR + OCR and 5′-LTR is shown using data from Fig. 2c and Extended Data Fig. 3c. e, Effect of mutations in RUNX-binding sites in the OCR on the 5′-LTR promoter activity. Jurkat T cells were used for luciferase reporter assay at 48 hours after transfection. At least 2 independent experiments were performed. Bars and error bars represent the mean ± SD of results in triplicate experiments. f, Sequence analysis of three RUNX-binding sites in the OCR. Reference HTLV-1 sequence was compared with the sequences from AC (n = 24), HAM (n = 29) and ATL (n = 45). Sequence variant in the RUNX binding site was shown in red. g, Conservation of three RUNX-binding motifs within the OCR region, shown in underline, in HTLV-1 strains from different geographic locations. h-i, Characteristics of HTLV-1 provirus obtained in a previous study and additional analysis regarding the OCR. Seven ATL cases showed monoclonal expansion of single infected clone with defective provirus among 45 ATL cases (h). Presence or absence of OCR, highlighted in green, in the selected 7 ATL cases (i). Bars and error bars represent the mean ± SD of results in triplicate experiments. p values were calculated using a two-sided, unpaired Student’s t-test. Source data
Extended Data Fig. 4
Extended Data Fig. 4. Cell type-specificity and molecular mechanisms underlying the OCR function.
a-b, The OCR showed suppressive effect on the 5′-LTR in T cells but not in non-T cell lines. Non-T and T cell lines (a) human primary CD4 + T cells and iPS-ML cells (b) were used for the luciferase assays at 48 hours after transfection. c-d, Effect of the shRNA targeting RUNX1 on RUNX1 expression in Molt4 cells (c) and Jurkat T cells (d). RUNX1 protein levels were analyzed by flow cytometry analysis with anti-RUNX1 mAb. e, Effect of RUNX1 knock down on the OCR function. f, OCR mediated silencing of 5′-LTR by RUNX1 mutants (P187R and F262V) reported in ATL patients. 293 T cells were used for luciferase reporter assay. At least 2 independent experiments were performed. Bars and error bars represent the mean ± SD of results in triplicate experiments. p values were calculated using a two-sided, unpaired Student’s t-test. Source data
Extended Data Fig. 5
Extended Data Fig. 5. Epigenetic characteristics observed in proviral regions infected with wild-type (wt) or silencer-mutated (s-mut) HTLV-1.
a, Quantification of cell-associated HTLV-1, measured by tax as total HTLV-1 and 2-LTR circle as episomal HTLV-1 DNA in JET cells infected with wt- or s-mut- HTLV-1. b, ChIP-quantitative PCR (qPCR) results for H3K4me3 and H3K9Ac of HTLV-1 infected JET cells in the HTLV-1 provirus. c, Schematic representation of Chromatin Conformation Capture (3 C) to evaluate HTLV-1 LTR-OCR proximity. d, Quantification of LTR-OCR proximity in JET cells infected with wt- or s-mut- HTLV-1. A representative data from 2 independent experiments is shown. Bars and error bars represent the mean ± SD of results in triplicate experiments. p value was calculated using a two-sided, unpaired Student’s t-test. Source data
Extended Data Fig. 6
Extended Data Fig. 6. Effect of RUNX1 inhibitor (Ro 5-3335) on proviral expression and immunogenicity against anti-Tax CTL.
a, Cell viabilities of HTLV-1-infected clones (wt39 and wt51) and HIV-1-infected clones (J-Lat10.6 and J-Lat9.2) were analyzed by the trypan blue exclusion method after treatment with RUNX1 inhibitor for 24 hours. b, Effect of the RUNX1 inhibitor on the HIV-1 or the HTLV-1 LTR activity. Both infected clones were treated with RUNX1 inhibitor for 24 hours and HTLV-1 Tax expression and HIV-1 5′-LTR transcription activity were analyzed using tdTomato and GFP, respectively. c, GFP expression levels in HIV-1 infected clones after treated with RUNX1 inhibitor for 24 hours was analyzed by flow cytometry. d, Effect of the RUNX1 inhibitor treatment on PBMC from HTLV-1 carriers and ATL patients. Expression of CD4 and Tax was measured by flow cytometry after 24 hours of RUNX1 inhibitor treatment. Characteristics of infected individuals analyzed were shown in Supplementary Table 4. e-f, Effect of the RUNX inhibitor on the susceptibility against anti-Tax CTL. Two HLA-A24/Tax-specific TCR-transduced Jurkat T cells were cocultured with HLA-A24-transduced K562 cells pulsed with Tax301-309 for 24 hours. IL-2 production was analyzed by ELISPOT assay (e). HTLV-1-infected clone (wt51) expressing HLA-A24 were treated with the RUNX inhibitor for 24 hours and then cocultured with TCR-transduced primary CD8 + T cells. IFN-g production was analyzed by ELISPOT assay after 24 hours coculture (f). g, HTLV-1-infected Jurkat T cells treated with Ro 5-3335 showed increased susceptibility to killing by Tax-specific CTLs. HTLV-1-infected Jurkat T cells expressing HLA-A24 were treated with the RUNX inhibitor for 24 hours and then cocultured with TCR-transduced primary CD8 + T cells. Two independent experiments were performed. Bars and error bars represent the mean ± SD of results in triplicate experiments. P values were calculated using a two-sided, paired Student’s t-test (n.s., not significant). Source data
Extended Data Fig. 7
Extended Data Fig. 7. Characteristics of three smoldering ATL (smATL) cases.
a, Clonality of HTLV-1-infected cells obtained by Ligation-Mediated PCR (LM-PCR) sequencing. The pie chart illustrates the relative abundance of each individual clone with a distinct integration site. Each slice of the pie represents one clone with the same integration site, and the size of each slice in the pie chart is proportional to the relative frequency of each clone. b-c, HTLV-1-infected CD4 + T cells in PBMCs from smATL patients were analyzed by flow cytometry (HAS flow) (b) and Tax staining (c).
Extended Data Fig. 8
Extended Data Fig. 8. Single Cell Multiome analysis of CD4 + T cells from a smoldering ATL case (a6).
a-b, WNN UMAP projection of all cells, both before and after cultivation identified using multimodal neighbors by weighting a combination of ATAC and RNA data. Cells are labeled for cell types (a) and before or after cultivation (b). c, Heatmaps of expression levels of viral RNA and CADM1, a marker of HTLV-1 infected cells. d-e, WNN UMAP projection of only HTLV-1 infected cells, both before and after cultivation identified using multimodal neighbors by weighting a combination of ATAC and RNA data. Cells are labeled for cell types (d) and before or after cultivation (e). f, Heatmaps of expression levels of viral RNA and CADM1, a marker of HTLV-1 infected cells. g, Aggregated and normalized ATAC signals of burst and latent cell clusters in the proviral region. h, Violin plots of viral RNA expression in burst and latent cell clusters. i, Violin plots of infected cells and UMAP projections of all cells with a heatmap showing RNA expression level of transcription factors related with the OCR in burst and latent cell clusters. j, Heatmaps of RUNX1 motif activity and a correlation plot showing the relationship between the transcription level of HTLV-1 (horizontal axis) and the motif activity of RUNX1 (vertical axis). The blue line represents the regression line. Plot is labeled for burst and latent clusters.
Extended Data Fig. 9
Extended Data Fig. 9. Single Cell Multiome analysis of CD4 + T cells from a smoldering ATL case (a9).
a-b, WNN UMAP projection of all cells, both before and after cultivation identified using multimodal neighbors by weighting a combination of ATAC and RNA data. Cells are labeled for cell types (a) and before or after cultivation (b). c, Heatmaps of expression levels of viral RNA and CADM1, a marker of HTLV-1 infected cells. d-e, WNN UMAP projection of only HTLV-1 infected cells, both before and after cultivation identified using multimodal neighbors by weighting a combination of ATAC and RNA data. Cells are labeled for cell types (d) and before or after cultivation (e). f, Heatmaps of expression levels of viral RNA and CADM1, a marker of HTLV-1 infected cells. g, Aggregated and normalized ATAC signals of burst and latent cell clusters in the proviral region. h, Violin plots of viral RNA expression in burst and latent cell clusters. i, Violin plots of infected cells and UMAP projections of all cells with a heatmap showing RNA expression level of transcription factors related with the OCR in burst and latent cell clusters. j, Heatmaps of RUNX1 motif activity and a correlation plot showing the relationship between the transcription level of HTLV-1 (horizontal axis) and the motif activity of RUNX1 (vertical axis). The blue line represents the regression line. Plot is labeled for burst and latent clusters.
Extended Data Fig. 10
Extended Data Fig. 10. A scheme illustrating the molecular mechanisms underlying HTLV-1 latency.
At steady state, HTLV-1 sense expression is silenced, while antisense expression persists. Upon extracellular stimulation, promoter activity overrides silencing, triggering a transcriptional burst. Most cells are eliminated, but some revert to latency, sustaining viral persistence. Upregulation of Sin3A and GATA-3, or downregulation of EST-1, may reinforce silencing and promote latency re-establishment.

References

    1. Wolf, D. & Goff, S. P. TRIM28 mediates primer binding site-targeted silencing of murine leukemia virus in embryonic cells. Cell131, 46–57 (2007). - PubMed
    1. Matsui, T. et al. Proviral silencing in embryonic stem cells requires the histone methyltransferase ESET. Nature464, 927–931 (2010). - PubMed
    1. Seczynska, M., Bloor, S., Cuesta, S. M. & Lehner, P. J. Genome surveillance by HUSH-mediated silencing of intronless mobile elements. Nature601, 440–445 (2022). - PMC - PubMed
    1. Poiesz, B. J. et al. Detection and isolation of type C retrovirus particles from fresh and cultured lymphocytes of a patient with cutaneous T-cell lymphoma. Proc. Natl Acad. Sci. USA77, 7415–7419 (1980). - PMC - PubMed
    1. Proietti, F. A., Carneiro-Proietti, A. B., Catalan-Soares, B. C. & Murphy, E. L. Global epidemiology of HTLV-I infection and associated diseases. Oncogene24, 6058–6068 (2005). - PubMed

MeSH terms

LinkOut - more resources