. 2025 May 13;8(1):745.
doi: 10.1038/s42003-025-08162-0.

AI-guided laser purification of human iPSC-derived cardiomyocytes for next-generation cardiac cell manufacturing

Affiliations

AI-guided laser purification of human iPSC-derived cardiomyocytes for next-generation cardiac cell manufacturing

Prakaimuk Saraithong et al. Commun Biol. .

Abstract

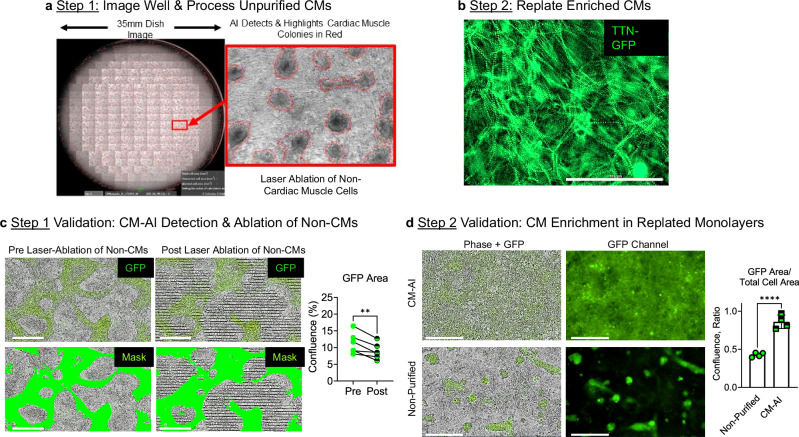
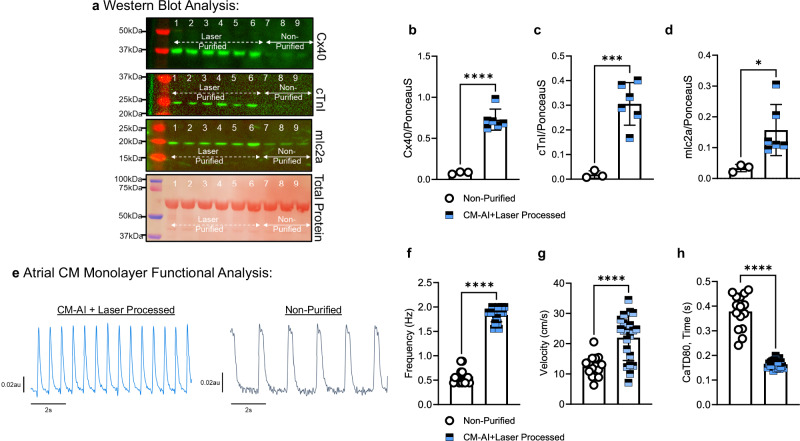
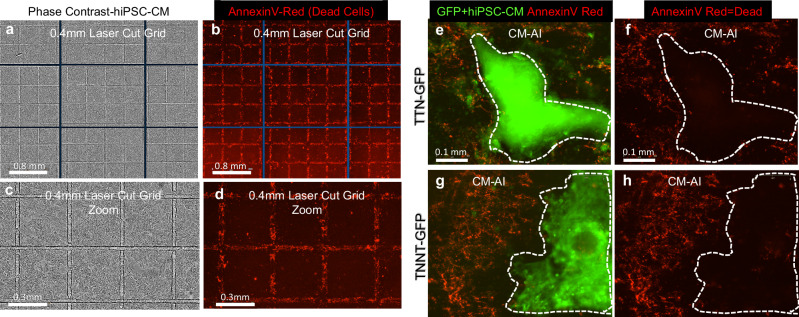
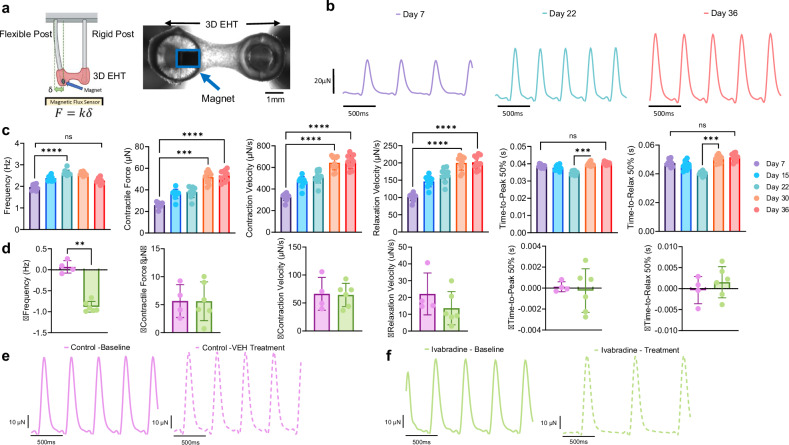
Current methods for producing cardiomyocytes from human induced pluripotent stem cells (hiPSCs) using 2D monolayer differentiation are often hampered by batch-to-batch variability and inefficient purification processes. Here, we introduce CM-AI, a novel artificial intelligence-guided laser cell processing platform designed for rapid, label-free purification of hiPSC-derived cardiomyocytes (hiPSC-CMs). This approach significantly reduces processing time without the need for chronic metabolic selection or antibody-based sorting. By integrating real-time cellular morphology analysis and targeted laser ablation, CM-AI selectively removes non-cardiomyocyte populations with high precision. This streamlined process preserves cardiomyocyte viability and function, offering a scalable and efficient solution for cardiac regenerative medicine, disease modeling, and drug discovery.


Conflict of interest statement

Competing interests: T.J.H. declares employment at Greenstone Biosciences, consultant and scientific advisory board member of StemBioSys, Inc. D.-H.K. is a co-founder and scientific advisory board member of Curi Bio. M.M.N. is an employee of StemBioSys, Inc. Y.K., M.Y., and J.M. are employees of Kataoka Corporation. All other authors declare no competing interests.

Figures

Fig. 1
Fig. 1. CM-AI automated detection of CMs and laser ablation of non-myocytes in 2D monolayers.
a Step 1 in this hiPSC-CM enrichment process is to acquire a phase contrast image of a well of cardiac differentiation with AI detection of CM colonies (red). b Step 2 in this easy-to-use process is replating enriched hiPSC-CMs. c Phase contrast and fluorescent imaging of GFP+ CMs enrichment in 2D monolayers. Successful AI recognition of CMs in phase contrast images was validated using time-lapse imaging of monolayers pre-AI laser processing and post-AI laser processing. The overall GFP confluence did decrease significantly in six independent wells processed using CM-AI-laser ablation of the non-myocyte (GFP-) cell population (Pre GFP confluence = 11.23 ± 3.2%; Post GFP confluence = 8.88 ± 2.4%; n = 6 paired t-test, **P = 0.009). The green Mask was used for quantification of the GFP confluence area before and after CM-AI laser processing. d Validation of CM enrichment in replated monolayers. Following CM-AI laser processing and CM enrichment, CMs were replated on CELLvo™ MatrixPlus human ECM-coated plates for analysis. CM-AI laser-processed wells reached purity (>85%) levels significantly greater than unprocessed wells. (n = 4 monolayers per group; unpaired t-test; ****P < 0.0001).
Fig. 2
Fig. 2. Validation of hiPSC-CM purity after CM-AI processing of two separate cell lines by flow cytometry.
a Flow cytometry plots of GFP + TTN-GFP hiPSC-CMs following CM-AI purification stained for cardiac troponin T (cTnT-APC). b Flow cytometry of untagged 19.9.11 hiPSC-CMs stained with cTnT-APC following CM-AI purification. c Summary of cTnT+ cell percentages from three independent differentiations using TTN-GFP and 19.9.11 hiPSC lines (n = 3 per line). Average purity was 92.0 ± 1.0% and 94.3 ± 7.2%, respectively. No residual expression of pluripotency markers (NANOG, POU5F1) detected post-CM-AI processing (qRT-PCR; Supplementary Table 1). Data are mean ± s.d.
Fig. 3
Fig. 3. Acute structural and electrical functional analysis of CM-AI purified hiPSC-CM monolayers.
a Western blot analysis of atrial-specific CM proteins in purified versus unpurified monolayers. CM-AI + Laser purified monolayers (n = 6, Lanes 1–6) showed significant enrichment of Cx40, cTnI, and mlc2a protein expression compared to time and batch-matched non-purified monolayers. b Cx40 protein expression was significantly enriched in laser-purified hiPSC-CM monolayers compared to non-purified monolayers (0.73 ± 0.13au; n = 6 vs. 0.08 ± 0.01au; n = 3; ****P < 0.0001, unpaired t-test). c cTnI protein expression was significantly greater in laser-purified monolayers compared to non-purified hiPSC-CM atrial monolayers (0.31 ± 0.09au; n = 6 vs. 0.02 ± 0.01au; n = 3; ***P = 0.0009, unpaired t-test). d mlc2a myofilament protein expression was significantly enriched in laser-purified hiPSC-CM monolayers compared to non-purified monolayers (0.16 ± 0.08au; n = 6 vs. 0.03 ± 0.01; n = 3; *P = 0.04, unpaired t-test). e Atrial hiPSC-CM monolayer function was quantified using calcium-sensitive dye (Calbryte 520AM, 5 μM) and high-resolution optical mapping. Representative spontaneous calcium flux traces from re-plated CM-AI + laser processed monolayers (blue) and replated non-purified monolayers (black). f CM-AI  + laser processed monolayers had faster spontaneous beat rate compared to non-purified monolayers (1.84 ± 0.14 Hz; n = 21 monolayers vs. 0.58 ± 0.14 Hz; n = 16 monolayers; ****P < 0.0001, unpaired t-test). g Calcium wave propagation velocity was faster in CM-AI laser processed monolayers compared to non-purified monolayers (22.0 ± 7.6 cm/s; n = 21 monolayers vs. 12.5 ± 3.5 cm/s; n = 15 monolayers; ****P < 0.0001). h Calcium transient duration 80 (CaTD80) was significantly shorter in CM-AI laser processed monolayers compared to non-purified monolayers (0.164 ± 0.02 s; n = 21 vs. 0.379 ± 0.07 s; n = 15; ****P < 0.0001, unpaired t-test).
Fig. 4
Fig. 4. Precision and safety of CM-AI laser ablation.
ad hiPSCs (19-9-11 hiPSC line) were plated as a monolayer on Kataoka Plates and differentiated to CMs. On day 7 hiPSC-CM monolayers were laser cut to make grids (0.4 mm2). a, c phase contrast images show where laser grids were made. b, d Staining with AnnexinV (red apoptosis reagent) shows dead cells are limited to the laser ablated areas. eh AnnexinV (red) staining following CM-AI and laser processing to purify hiPSC-CMs using two different GFP-tagged cell lines. For each cell line tested, GFP+ CMs are outlined with white dotted line to enhance visualization in (f, h).
Fig. 5
Fig. 5. Functional validation of CM-AI processed cardiomyocytes.
ac Phase contrast images of custom programmed laser ablation test using a purified hiPSC-CM monolayer. The laser was programmed to kill cells in the shape of the block “M” × 2. d Spontaneous calcium activations were recorded using a calcium-sensitive probe (Calbryte520AM) and high-speed imaging system. Spontaneous activation waves navigated around the laser-ablated hiPSC-CMs and through the live hiPSC-CMs. Representative data shown from ≥3 replicates. Supplementary Movie 3 illustrates continuous contraction of live CM networks.
Fig. 6
Fig. 6. Post-thaw function and viability of cryopreserved CM-AI processed hiPSC-CMs.
a Post-thaw viability was similar between two hiPSC lines tested (TTN-GFP hiPSC-CM = 74.3 ± 7.4; 19.9.11 hiPSC-CM = 61.7 ± 2.9%, n = 3 separate batches per group). b Time-lapse imaging was used to quantify hiPSC-CM 2D monolayer formation kinetics following thaw, data is mean ± standard deviation at each time point. c Phase contrast and GFP images for each cell line tested in panel b on day 3.5 post thaw. d, e Representative calcium transient recordings from each hiPSC line at baseline and with isoproterenol (ISO, 200 nM) treatment. f Each cell line hiPSC-CMs responded to ISO with increased beat rate (TTN-GFP hiPSC-CM baseline = 68.9 ± 8.1; +ISO = 93.3 ± 10.3 bpm, n = 6) (19.9.11 hiPSC-CM baseline = 100.3 ± 15.6; +ISO = 130.0 ± 20.6bpm, n = 6). Paired t-test, ***P = 0.0001. g Each cell line hiPSC-CMs responded to 200 nM ISO with increased calcium wave propagation velocity (TTN-GFP hiPSC-CM baseline = 33.7 ± 5.9; +ISO = 46.9 ± 4.6 cm/s, n = 6) (19.9.11 hiPSC-CM baseline = 30.1 ± 3.4; +ISO = 37.2 ± 6.3 cm/s, n = 6). Paired t-test, ***P = 0.0003; **P = 0.04.
Fig. 7
Fig. 7. Pharmacologic response of CM-AI cryopreserved hiPSC-CMs to PDE4 inhibition in 96-well high-throughput electrophysiology screen.
a Cryopreserved TTN-GFP atrial hiPSC-CMs phase contrast and GFP images, 20×. b Zoomed image of sarcomere structures in hiPSC-CMs. c Representative time-space plots indicate functional monolayer electrophysiological activations across the width of each well of the 96-well plate (9 mm diameter). Rolipram increased hiPSC-CM monolayer beat rate. d Representative calcium transient traces indicating the effect of rolipram to increase calcium transient amplitude. e Rolipram increased 2D monolayer beat rate (VEH = 80.0 ± 11.8; 1.0 µM Rolipram = 113.3 ± 33.0; 10.0 µM Rolipram = 129.2 ± 9.4 bpm, n = 8 per group). One way ANOVA, multiple comparisons, *P = 0.01; ***P = 0.0004. f Rolipram increased calcium transient amplitude (VEH = 0.53 ± 0.17; 1.0 µM Rolipram = 0.72 ± 0.40; 10.0 µM Rolipram=1.22 ± 0.50 ∆F/F0, n = 8 per group). One way ANOVA, multiple comparisons, **P = 0.004. g Rolipram increased calcium impulse conduction velocity (VEH = 23.5 ± 4.1; 1.0 µM Rolipram = 30.3 ± 17.6; 10.0 µM Rolipram = 47.9 ± 20.4 cm/s, n = 8 per group). One way ANOVA, Brown-Forsythe and Welch tests, multiple comparisons, *P = 0.02.
Fig. 8
Fig. 8. Functional assessment of 3D engineered heart tissues (3D EHTs) derived from CM-AI-processed, cryopreserved hiPSC-derived atrial CMs.
aTop: Schematic illustration of the 3D EHT platform used to evaluate contractile function of CM-AI laser-processed hiPSC-derived atrial CMs. Right: Representative 10× brightfield image of a 3D EHT. The embedded magnet for force sensing is outlined in blue. Created in https://BioRender.comb Representative contractile force traces recorded from the same 3D EHT over time, demonstrating maturation of contractile performance. c Quantitative analysis of 3D EHT contractile function across multiple time points (Day 7, 22, and 36). Contraction frequency increased over time (Day 7 = 1.97 ± 0.13; Day 22 = 2.63 ± 0.12; Day 36 = 2.27 ± 0.12 Hz, n = 10). Peak contractile force increased over time (Day 7 = 25.9 ± 2.5; Day 22 = 38.0 ± 4.9; Day 36 = 53.3 ± 5.0 µN, n = 10). Contraction velocity increased over time (Day 7 = 327.3 ± 33.0; Day 22 = 516.4 ± 60.9; Day 36 = 650.5 ± 63.5 µN/s, n = 10). Relaxation velocity increased over time (Day 7 = 102.1 ± 10.6; Day 22 = 164.9 ± 19.7; Day 36 = 201.8 ± 18.9 µN/s, n = 10). Time to 50% peak of contraction (TTP 50%) increased from day 22 to 36 (Day 7 = 0.039 ± 0.0009; Day 22 = 0.034 ± 0.001; Day 36 = 0.040 ± 0.0008 s, n = 10). Time to 50% relaxation increased between days 22 and 36 (Day 7 = 0.048 ± 0.002; Day 22 = 0.040 ± 0.001; Day 36 = 0.051 ± 0.003 s, n = 10). All data represent repeated measurements from the same 10 3D EHTs at each time point. One way ANOVA; Friedman test; multiple comparisons; ****P < 0.0001; ***P = 0.0001. d Ivabradine treatment (0.3 nM) significantly reduced spontaneous beat rate (**P = 0.009, unpaired t-test and Kolmogorov–Smirnov test), while other contractile parameters remained unaffected. e Representative 3D EHT force traces at baseline and after vehicle control (VEH, dashed lines) treatment. f Representative force traces showing ivabradine treatment slowed the spontaneous beat rate of 3D EHTs as quantified in (d).

References

    1. Sharma, A., Wu, J. C. & Wu, S. M. Induced pluripotent stem cell-derived cardiomyocytes for cardiovascular disease modeling and drug screening. Stem Cell Res. Ther.4, 150 (2013). - PMC - PubMed
    1. Burridge, P. W. et al. Chemically defined generation of human cardiomyocytes. Nat. Methods11, 855–860 (2014). - PMC - PubMed
    1. Zhang, J. et al. Functional cardiomyocytes derived from human induced pluripotent stem cells. Circ. Res.104, e30–e41 (2009). - PMC - PubMed
    1. Lian, X. et al. Robust cardiomyocyte differentiation from human pluripotent stem cells via temporal modulation of canonical Wnt signaling. Proc. Natl. Acad. Sci. USA109, E1848–E1857 (2012). - PMC - PubMed
    1. Zhang, J. et al. Extracellular matrix promotes highly efficient cardiac differentiation of human pluripotent stem cells: the matrix sandwich method. Circ. Res.111, 1125–1136 (2012). - PMC - PubMed

LinkOut - more resources