. 2025 May;7(5):966-984.
doi: 10.1038/s42255-025-01276-z. Epub 2025 May 13.

Metabolic reprogramming of interleukin-17-producing γδ T cells promotes ACC1-mediated de novo lipogenesis under psoriatic conditions

Affiliations

Metabolic reprogramming of interleukin-17-producing γδ T cells promotes ACC1-mediated de novo lipogenesis under psoriatic conditions

Yu-San Kao et al. Nat Metab. 2025 May.

Abstract

Metabolic reprogramming determines γδ T cell fate during thymic development; however, the metabolic requirements of interleukin (IL)-17A-producing γδ T cells (γδT17 cells) under psoriatic conditions are unclear. Combining high-throughput techniques, including RNA sequencing, SCENITH, proteomics and stable isotope tracing, we demonstrated that psoriatic inflammation caused γδT17 cells to switch toward aerobic glycolysis. Under psoriatic conditions, γδT17 cells upregulated ATP-citrate synthase to convert citrate to acetyl-CoA, linking carbohydrate metabolism and fatty acid synthesis (FAS). Accordingly, we used a pharmacological inhibitor, Soraphen A, which blocks acetyl-CoA carboxylase (ACC), to impair FAS in γδT17 cells, reducing their intracellular lipid stores and ability to produce IL-17A under psoriatic conditions in vitro. We pinpointed the pathogenic role of ACC1 in γδT17 cells in vivo by genetic ablation, ameliorating inflammation in a psoriatic mouse model. Furthermore, ACC inhibition limited human IL-17A-producing γδT17 cells. Targeting ACC1 to attenuate pathogenic γδT17 cell function has important implications for psoriasis management.


Conflict of interest statement

Competing interests: R.J.A. is a scientist and co-founder of GammaOmics, a startup that holds the exclusive license (patent PCT/EP2020/060486) to commercialize and provide services for SCENITH, a technology used in this study. The other authors declare no competing interests.

Figures

Fig. 1
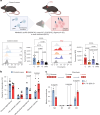
Fig. 1. γδT17 cells undergo metabolic reprogramming toward aerobic glycolysis under psoriatic conditions.
In vitro-expanded γδT17 cells (lineageγδTCR+CD27) were re-seeded on day 9 and stimulated with IL-7 in the presence (psoriatic conditions) or absence (homeostatic conditions) of IL-1β and IL-23 for 3 h. a, RNA-seq heatmap showing the upregulated (red) and downregulated (blue) genes (fold change > 12) in γδT17 cells under psoriatic versus homeostatic conditions. b, MsigDB pathway analysis of genes upregulated in γδT17 cells under psoriatic conditions. c, Jensen Compartment analysis of genes upregulated in γδT17 cells under psoriatic conditions. P values are obtained by the Benjamini–Hochberg-corrected t-test for b and c. d,e, In vitro-expanded γδT17 cells were sorted on day 6 and cultured with IL-7 for 3 days in the presence or absence of 1,000 nM SorA. On day 9, cells were re-seeded and stimulated with IL-7 either alone or combined with IL-1β and IL-23 for 24 h and treated with DMSO or 1,000 nM SorA. Representative flow cytometry histograms (left) and a summary graph (right) showing MitoTracker Green staining (d) and MitoTracker Red CM-H2Xros staining (e) in γδT17 cells under indicated conditions. Pooled means of normalized mean fluorescence intensities (MFIs) from three independent experiments are shown. Error bars, s.d. P values were obtained using two-way ANOVA for d and e.
Fig. 2
Fig. 2. γδT17 cells display distinct metabolic profiles in the mouse model of IMQ-induced psoriasis.
The ears of mice were treated topically with control cream or IMQ for five consecutive days. a, MFI of puromycin staining was analysed in CD3+Vγ4+γδT17 cells isolated from the IMQ model using SCENITH under control conditions and negative control or after the addition of 2-DG, oligomycin or both inhibitors. The illustration was created in BioRender.com. b, Percentages of glucose dependence, mitochondrial dependence, glycolytic capacity or fatty acid and amino acid oxidation (FAO and AAO) capacity. c, Mass isotopomer distributions of lactate. Data were collected from WT mice treated with control cream (n = 9) and IMQ (n = 10). In vitro-expanded γδT17 cells were sorted on day 6 and cultured with IL-7 for 3 days. On day 9, cells were re-seeded and stimulated with either IL-7 (homeostatic conditions) or a combination of IL-1β and IL-23 (psoriatic conditions) in the presence of U-[13C6]-glucose in the last 48 h of the experiment. Pooled means from three independent experiments are shown. Error bars, s.d. P values were obtained from one-way ANOVA in a and two-way ANOVA in b and c.
Fig. 3
Fig. 3. γδT17 cells enrich proteins required for signalling pathways and biosynthetic processes under psoriatic conditions.
On day 9, in vitro-expanded γδT17 cells were re-seeded and stimulated with IL-7 alone (homeostatic conditions) or combined with IL-1β and IL-23 (psoriatic conditions) for 24 h before proteomic analysis. a, Proteins significantly upregulated or downregulated (log2(fold change) > 0.5) under psoriatic versus homeostatic conditions. Data from four independent experiments were collected for the proteomic analysis. P values were obtained using the two-sided Benjamini–Hochberg-corrected t-test; P < 0.01 indicates statistically significant differences. bd, KEGG (b) and Gene Ontology (GO) pathway enrichment analyses of biological (c) and metabolic processes (d) with proteins upregulated (red) under psoriatic versus homeostatic conditions. e,f, The bar graphs show the four proteins involved in glycolytic–lipogenic metabolic processes, including ME1 and ACLY (e) and ACC1 and FASN (f), which were differentially expressed in γδT17 cells exposed to psoriatic (red) versus homeostatic (blue) conditions. g, Schematic model of upregulated proteins under psoriatic versus homeostatic conditions, created in BioRender.com. The mean of technical triplicates from four independent experiments is been shown; error bars, s.d. P values were determined using t-tests. The enrichment scores and false discovery rate (FDR) were estimated using STRING.
Fig. 4
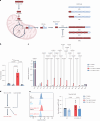
Fig. 4. Psoriatic conditions upregulate de novo FAS in γδT17 cells.
On day 9, in vitro-expanded γδT17 cells were re-seeded and stimulated with IL-7 alone (homeostatic conditions) or in combination with IL-1β and IL-23 (psoriatic conditions) for 24 h or 48 h in the presence or absence of indicated SorA concentration. a, Schematic outcome diagram with stable isotope tracing of U-[13C]-glucose into FAS; created in BioRender.com. b,c, Isotopic palmitate enrichment (b) and fractional contribution (c) in γδT17 cells were assessed after 48 h of U-[13C]-glucose treatment. The means of technical replicates from three independent experiments are shown in b and c. d, Schematic diagram of palmitate usage. e, Intracellular neutral lipid content was evaluated by LipidTOX Red. Pooled means of LipidTOX Red MFIs were normalized to those of the IL-7/DMSO condition, obtained from independent experiments of n = 5 for DMSO-treated and n = 4 for SorA-treated conditions. Error bars, s.d. P values were obtained using one-way ANOVA for b and the two-way ANOVA for c and e.
Fig. 5
Fig. 5. FAS is required for IL-17A expression in γδT17 cells under psoriatic conditions.
On day 9, in vitro-expanded γδT17 cells were re-seeded and stimulated with IL-7 alone (homeostatic conditions) or in combination with IL-1β and IL-23 (psoriatic conditions) for 24 h in the presence or absence of 1,000 nM SorA concentration and palmitate (PA) supplementation. a, Flow cytometry gating strategy for IL-17A. b, Viability of γδT17 cells. c, Normalized MFI of lipid uptake measured by BODIPY C16. d, Percentages of IL-17A+ in γδ T cells. e, IL-17A secretion in the supernatant of cultured γδT17 cells on day 10 of the indicated conditions. f, Representative images of LD and IL-17A expression, evaluated by LipidTOX and anti-IL-17A antibody, respectively. g,h, MFIs of IL-17A (g) and LipidTOX (h) were determined in each individual cell under psoriatic conditions (IL-7 + IL-1β/IL-23) for 24 h. Pooled means from independent experiments: n = 5 for DMSO and n = 3 for SorA-treated conditions in b and d; n = 4 for DMSO and n = 3 for SorA-treated conditions in c; n = 3 in e. One set of representative image analysis from three independent experiments is shown in g and h. Error bars, s.d. P values were obtained using two-way ANOVA for b–e and the one-way ANOVA for g and h.
Fig. 6
Fig. 6. Genetic ablation of ACC1 in RORγt+ γδ T cells attenuates IMQ-induced skin inflammation.
a, Ears and back skin of WT or RorcACC1KO model mice were treated topically with IMQ for six consecutive days. bd, The clinical scores of erythema (b), thickness of ear skin (c) and clinical scores of scaling (d) were measured daily during the IMQ treatment period. e, Flow cytometry gating strategy for identifying γδT17 cells (CD3+γδTCRintIL-17A+) within skin samples of the treated ear areas on day 6. f,g, Percentages and cell numbers of dermal γδ T cells (CD3+γδTCRint) (f) and γδT17 cells (CD3+γδTCRintIL-17A+ (g) in the ear skin of WT or RorcACC1KO mice. h, Flow cytometry gating strategy for identifying γδ T cells and IL-17A-producing cells within skin-draining LNs on day 6. i,j, Percentages and cell numbers of γδ T cells (CD3+γδTCR+) (i) and γδT17 cells (CD3+γδTCR+IL-17A+) (j) in the skin-draining LNs of WT or RorcACC1KO mice. The means of pooled data from three independent experiments are shown. Error bars, s.d. P values were determined using two-way ANOVA to compare IMQ-treated WT and RorcACC1KO mice in bd; a two-sided t-test was used in ej.
Fig. 7
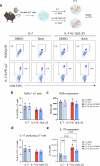
Fig. 7. SorA treatment reduces the frequencies of human IL-17A-producing Vδ2+γδ T cells.
a, Human peripheral blood mononuclear cells (PBMCs) were stimulated with zoledronate, rhIL-6, rhIL-23, rhIL-1β and rhTGF-β for 6 days. On day 6, half of the old media was removed and replaced with fresh media containing IL-2 in the presence or absence of the indicated concentration of SorA for another 6 days. b, Flow cytometry gating strategy of total and IL-17A-producing Vδ2+γδ T cells. c,d, The cells were re-stimulated with PMA/ionomycin for 4 h in the presence of BFA for the last 2 h; percentages of Vδ2+γδ T cells (CD3+Vδ2+) (c) and IL-17A+Vδ2+γδ T cells (CD3+Vδ2+IL-17A+) (d) are shown. The means of one representative set of three independent experiments are shown. Error bars, s.d. P values were determined using two-way ANOVA.
Extended Data Fig. 1
Extended Data Fig. 1. γδT17 cells undergo metabolic reprogramming, reducing mitochondrial metabolism under psoriatic conditions.
In vitro-expanded γδT17 cells (Lineage-γδTCR+CD27-) were re-seeded on day 9 and stimulated with IL-7 in the presence (psoriatic conditions) or absence (homeostatic conditions) of IL-1β and IL-23 for 3 h. a, RNA-seq heatmap showing the upregulated (red) and downregulated (blue) genes ( > 6 fold-change) in γδT17 cells under psoriatic versus homeostatic conditions. The black frame indicates the highest-ranked differentially expressed genes ( > 12 fold-change), listed in Fig. 1a. Data from four independent experiments were collected. For statistical analysis, CLC’s count-based ‘Empirical analysis of Differential Gene Expression’ implementing the ‘Exact Test’ for two-group comparisons and p < 0.05 indicates statistically significant differences. b, Heatmap of mitochondrial-metabolism-related gene expression. c, Heatmap showing the expression of genes associated with the glycolytic-lipogenic pathway. d, Schematic model of differentially expressed genes under psoriatic versus homeostatic conditions identified by RNA-seq analysis was created in BioRender. Kao, Y. (2025) https://BioRender.com/x17k361.
Extended Data Fig. 2
Extended Data Fig. 2. Stable isotope tracing of glucose usage reveals γδT17 cells engage in glycolysis and maintain mitochondrial metabolism under psoriatic conditions.
In vitro-expanded γδT17 cells were sorted on day 6 and cultured with interleukin (IL)-7 for 3 days. On day 9, cells were re-seeded and stimulated with IL-7 either alone (homeostatic conditions) or combined with IL-1β and IL-23 (psoriatic conditions) for 48 h. The isotopic enrichment of lactate and tricarboxylic acid (TCA) cycle metabolites in γδT17 cells on day 11 was determined by incubating the cells with U-[13C6]-glucose in the last 48 h of the experiment. Metabolite abundance (left-hand graphs) and fractional glucose contribution analysis (right-hand graphs) revealed the levels of lactate a and TCA cycle intermediates and associated metabolites, including citrate b, glutamate c, succinate d, and malate e in the γδT17 cells cultured under psoriatic versus homeostatic conditions. Pooled means from three independent experiments are shown. Error bars represent standard deviation (SD), and p-values were obtained using a two-sided t test. The graphic was created in BioRender. Kao, Y. (2025) https://BioRender.com/s40a656.
Extended Data Fig. 3
Extended Data Fig. 3. Stable isotope tracing of glucose usage reveals that γδT17 cells maintain mitochondrial metabolism under psoriatic conditions.
In vitro-expanded γδT17 cells were sorted on day 6 and cultured with IL-7 for 3 days. On day 9, cells were re-seeded and stimulated with either IL-7 (homeostatic conditions) or a combination of IL-1β and IL-23 (psoriatic conditions) for 48 h. a, b, Schematic representation of U-[13C6]-glucose labeling of central carbon metabolism and resulting atom transitions. M2 isotopologues of TCA cycle metabolites result from pyruvate dehydrogenase (PDH) flux in a, while M3 isotopologues result from pyruvate flux into oxaloacetate through pyruvate carboxylase (PC) in b. M2 oxaloacetate condensing with M2 Acetyl-CoA yields M4 isotopologues, which indicate the cycling of TCA cycle metabolites. c-f, Mass isotopomer distributions of TCA cycle metabolites, including citrate c, glutamate d, succinate e, and malate f in γδT17 cells on day 11 were determined by incubating the cells with U-[13C6]-glucose in the last 48 h of the experiment. The means of three independent experiments are shown. Error bars represent standard deviation (SD), and p-values were obtained using the two-sided t test.
Extended Data Fig. 4
Extended Data Fig. 4. Stable isotope tracing of palmitate usage reveals that γδT17 cells decrease their fatty acid oxidation flux under psoriatic conditions.
In vitro-expanded γδT17 cells were sorted on day 6 and cultured with IL-7 for 3 days. On day 9, cells were re-seeded and stimulated with either IL-7 (homeostatic conditions) or a combination of IL-1β and IL-23 (psoriatic conditions) for 24 h. a, Schematic model of potential palmitate usage was created in BioRender. Kao, Y. (2025) https://BioRender.com/l79h895. b, Schematic representation of U-[13C16]-palmitate labeling of central carbon metabolism into the cycling of TCA cycle metabolites. c, d, Mass isotopomer distributions of TCA cycle metabolites, including citrate c and glutamate d in γδT17 cells on day 10 were determined by incubating the cells with U-[13C6]-glucose in the last 24 h of the experiment. The means of three independent experiments are shown. Error bars represent standard deviation (SD), and p-values were obtained using the two-way ANOVA. ns p > 0.05.
Extended Data Fig. 5
Extended Data Fig. 5. Glycolysis fuels IL-17A production in γδT17 cells from the mouse model of imiquimod-induced psoriasis.
a, the ears of mice were treated topically with control cream or imiquimod (IMQ) for 5 consecutive days. IL-17A expression was analyzed in CD3+Vγ4+γδT17 cells isolated from the IMQ model under control conditions (C) and negative control (NC) or after the addition of 2-DG (DG), oligomycin (O), or both inhibitors (DGO), and SorA for 45 minutes (Created in BioRender. Kao, Y. (2025) https://BioRender.com/y77u034) b, Representative flow cytometry dot plots and b, percentages showing the IL-17A-expressing γδ T cells obtained under the indicated conditions. Data obtained from 10 mice for the groups of control (C), 2-DG, oligomycin (O), and both inhibitors (DGO), as well as 5 mice for the SorA condition, were shown. Error bars represent standard deviation (SD). p-values were obtained using the one-way ANOVA.
Extended Data Fig. 6
Extended Data Fig. 6. 24-h FAS inhibition decreases IL-17A expression in γδT17 cells isolated from LNs without affecting RORγt expression.
a, Murine γδ T cells isolated from lymphoid organs cultured with IL-7 or IL-7, IL-23, IL-1β for 24 h in the presence or absence of 1000 nM SorA. Cells were re-stimulated with PMA/Ionomycin in the last 4 h (Created in BioRender. Kao, Y. (2025) https://BioRender.com/q70s671). Representative gating strategy of RORγt and IL-17A expression in γδ T cells. b, c, percentage (b) and MFI (c) of RORγt within purified γδ T cells. d, e, percentages (d) and MFI (e) showing the IL-17A-expressing γδ T cells obtained under the indicated conditions. Pooled means from three independent experiments are shown and error bars represent SD. p-values were obtained using the two-way ANOVA.
Extended Data Fig. 7
Extended Data Fig. 7. 24 h-FAS inhibition limits IL-17A and LipidTOX levels in the in vitro culture of γδT17 cells from IL-17A reporter mice.
In vitro-expanded γδT17 cells from IL-17A-GFP-reporter (C57BL/6-Il17atm1Bcgen/J) mice were sorted on day 6 and cultured with IL-7 for 3 days. On day 9, cells were re-seeded and stimulated with either IL-7 (homeostatic conditions) or a combination of IL-1β and IL-23 (psoriatic conditions) for 24 h. a, Representative immunofluorescence images of Lipid droplets (LipidTOX, red), IL-17A-GFP (green), and nuclei (Hoechst 33342, blue) by confocal microscopy. Scale bars represent 5 μm. b, mean fluorescence intensities (MFIs) of IL-17A-GFP were shown. c, MFIs of LipidTOX were shown. The means of pooled data from 2 mice are shown. At least 10 cells were shown in each condition from one set of the independent experiment. Error bars represent standard deviation (SD), and p-values were obtained using the one-way ANOVA.
Extended Data Fig. 8
Extended Data Fig. 8. RNA-seq and proteomic analysis demonstrate that γδT17 cells downregulated lipid storage upon FAS inhibition in vitro.
In vitro-expanded γδT17 cells (Lineage-γδTCR+CD27-) were sorted on day 6 and cultured with IL-7 for 3 days. On day 9, cells were re-seeded and stimulated with IL-7, IL-1β, and IL-23 (psoriatic conditions) in the presence or absence of the indicated concentration of SorA for 3 h (for RNA-seq analysis) or 24 h (for proteomic analysis); γδT17 cells treated with SorA or DMSO (control) were compared. a, Heatmap of genes upregulated (red) and downregulated (blue) in bulk RNA-seq analysis of γδT17 cells in the presence of SorA or DMSO under psoriatic conditions. b, Significantly upregulated (red) and downregulated (blue) proteins with >0.35 log2 fold-change (FC) values were identified in the proteomic analysis comparing γδT17 cells treated with SorA and DMSO. c, Gene ontology (GO) enrichment analysis shows the biological processes and pathways associated with the downregulated proteins, as shown in b. The proteomic analysis results were obtained from four independent experiments, and p-values were generated using the two-sided Benjamini-Hochberg corrected t-test. p < 0.05 indicates statistically significant differences. d, Schematic model of the pathway analysis with downregulated proteins comparing SorA versus DMSO control under psoriatic conditions was created in BioRender. Kao, Y. (2025) https://BioRender.com/x09m732.
Extended Data Fig. 9
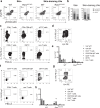
Extended Data Fig. 9. Genetic ablation of ACC1 in RORγt+ T cells limits IL-17A production mainly from the Vγ4+γδ T cells in the IMQ model.
The ears and back skin of wild-type (WT) or RorcACC1KO model mice were treated topically with imiquimod (IMQ) for six consecutive days. a, Flow cytometry gating strategy for identifying IL-17A-producing cells within skin samples of the treated ear areas and skin-draining LNs on day 6. b, Percentages of Vγ4+γδ T cells (γδTCR+ Vγ4+), Vγ4-γδ T cells (γδTCR+ Vγ4-), and non- γδ T cells in the ear skin and skin-draining LNs of WT or RorcACC1KO mice (gated on IL-17A+ cells). c, Flow cytometry gating strategy for analyzing IL-17A+ in CD4+ T cells (CD45+αβTCR+CD4+γδTCR-), CD8+ T cells (CD45+αβTCR+CD8+γδTCR-), double-negative αβ T cells (CD45+αβTCR+CD4-CD8-γδTCR-), DETC (CD45+γδTCRhigh), γδT17 cells (CD45+γδTCRint) and non-T cells within treated-skin. d, Flow cytometry gating strategy for IL-17A+Vγ4+γδ T cells and IL-17A+Vγ4-γδ T cells from the treated skin. e, Percentages of IL-17A in indicated cell types in the treated skin. f, Flow cytometry gating strategy for analyzing IL-17A+ in CD4+ T cells (CD45+αβTCR+CD4+γδTCR-), CD8+ T cells (CD45+αβTCR+CD8+γδTCR-), double-negative αβ T cells (CD45+αβTCR+CD4-CD8-γδTCR-), γδT17 cells (CD45+γδTCRint) and non-T cells in the skin-draining lymph node (LN) on day 6. g, Flow cytometry gating strategy for IL-17A+Vγ4+γδ T cells and IL-17A+Vγ4-γδ T cells from the skin-draining LNs. h, Percentages of IL-17A in indicated cell types in the skin-draining LNs. The data were from WT (n = 2) or RorcACC1KO mice (n = 2).
Extended Data Fig. 10
Extended Data Fig. 10. The overview of metabolic reprogramming of γδT17 cells under psoriatic inflammation and SorA-mediated FAS inhibition.
γδT17 cells upregulated aerobic glycolysis while reducing mitochondria dependence to support de novo FAS to meet their high lipid demand under psoriatic conditions (IL-7 + IL-1β/IL-23) compared to homeostatic conditions (IL-7). Pyruvate produced by the glycolytic pathway is converted into acetyl-CoA in the mitochondria before entering the tricarboxylic acid (TCA) cycle as citrate. Without entering the TCA cycle, citrate can be transported to the cytosol. Upon psoriatic inflammation, γδT17 cells increased the expression of ATP-citrate lyase (ACLY) to link glucose metabolism to FAS by converting citrate to acetyl-CoA and a byproduct, oxaloacetate in the cytosol. Acetyl-CoA can then be used for de novo FAS mediated by the rate-limiting enzyme acetyl-CoA carboxylase (ACC1) to synthesize palmitate. Cytoplasmic oxaloacetate is converted to malate and then to pyruvate by malic enzyme 1 (ME1) to rejoin the glycolytic pathway. Meanwhile, ME1, an NADP-dependent enzyme, generates the NADPH required for FAS. FAS-derived palmitate is required for maintaining mitochondrial mass, neutral lipid synthesis, lipid droplet formation (mainly consisting of triacylglycerol, TAG), and IL-17A expression in γδT17 cells in response to psoriatic conditions. FAS inhibition using ACC inhibitor Soraphen A (SorA) reduces mitochondrial mass, intracellular lipid stores, lipid droplet formation, trans-Golgi network, and IL-17A expression while increasing compensatory lipolysis. The illustration was created in BioRender. Kao, Y. (2025) https://BioRender.com/e31v719.

References

    1. Jin, L. & Wang, G. Keratin 17: a critical player in the pathogenesis of psoriasis. Med. Res. Rev.34, 438–454 (2014). - PubMed
    1. Albanesi, C., Madonna, S., Gisondi, P. & Girolomoni, G. The interplay between keratinocytes and immune cells in the pathogenesis of psoriasis. Front. Immunol.9, 1549 (2018). - PMC - PubMed
    1. Griffiths, C. E. M., Armstrong, A. W., Gudjonsson, J. E. & Barker, J. N. W. N. Psoriasis. Lancet397, 1301–1315 (2021). - PubMed
    1. Jostins, L. et al. Host–microbe interactions have shaped the genetic architecture of inflammatory bowel disease. Nature491, 119–124 (2012). - PMC - PubMed
    1. Lande, R. et al. The antimicrobial peptide LL37 is a T-cell autoantigen in psoriasis. Nat. Commun.5, 5621 (2014) (published correction appears in Nat. Commun.6, 6595 (2015)). - PubMed