. 2025 Sep;9(9):1531-1546.
doi: 10.1038/s41551-025-01390-z. Epub 2025 May 13.

Focused ultrasound-microbubble treatment arrests the growth and formation of cerebral cavernous malformations

Affiliations

Focused ultrasound-microbubble treatment arrests the growth and formation of cerebral cavernous malformations

Delaney G Fisher et al. Nat Biomed Eng. 2025 Sep.

Abstract

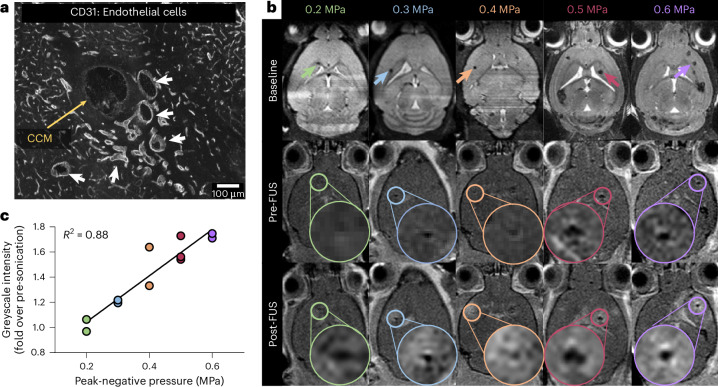
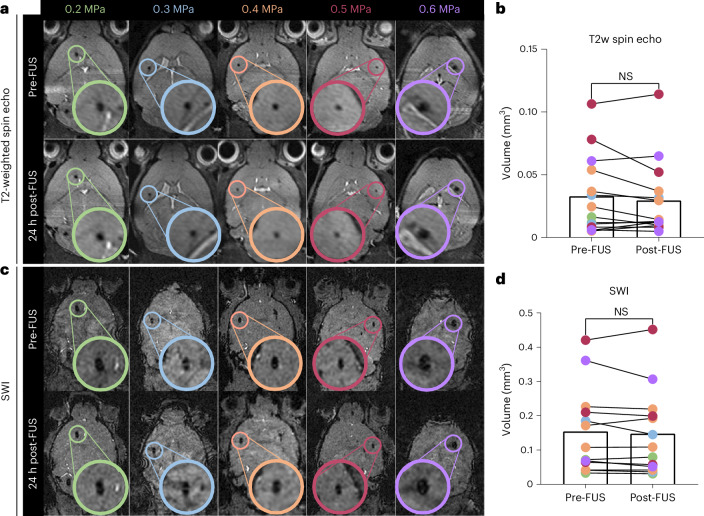
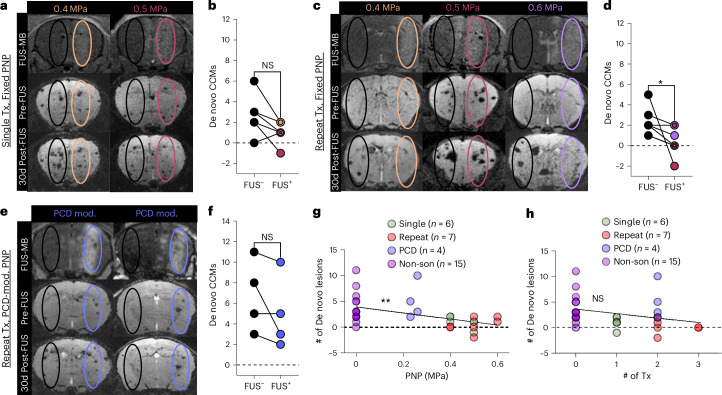
Cerebral cavernous malformations (CCMs) are vascular lesions within the central nervous system that cause debilitating neurological symptoms. Currently, surgical excision and stereotactic radiosurgery, the primary treatment options, pose risks to some patients. Here we tested whether pulsed, low intensity, focused ultrasound-microbubble (FUS-MB) treatments control CCM growth and formation in a clinically representative Krit1 null murine model. FUS-MB under magnetic resonance imaging (MRI) guidance opened the blood-brain barrier, with gadolinium contrast agent deposition most evident at perilesional boundaries. Longitudinal MRI revealed that, at 1 month after treatment, FUS-MB halted the growth of 94% of treated CCMs. In contrast, untreated CCMs grew ~7-fold in volume. FUS-MB-treated CCMs exhibited a marked reduction in Krit1 null endothelial cells. In mice receiving multiple FUS-MB treatments with fixed peak-negative pressures, de novo CCM formation was reduced by 81%, indicating a prophylactic effect. Our findings support FUS-MB as a minimally invasive treatment modality that can safely arrest murine CCM growth and prevent de novo CCM formation in mice. If proven safe and effective in clinical trials, FUS-MB treatment may enhance therapeutic options for CCM patients.


Conflict of interest statement

Competing interests: The authors declare no competing interests.

Figures

Fig. 1
Fig. 1. FUS-MB treatment opens the BBB within the CCM microenvironment.
a, Confocal image of a CCM (in the absence of FUS) stained with CD31 for endothelial cells. Image depicts the grossly enlarged CCM core (yellow arrow) and moderately dilated perilesional vasculature (white arrows). b, Top row: baseline, high-resolution T2-weighted spin echo images used for selecting CCMs for FUS targeting. Arrowheads indicate selected CCMs. Middle row: T1-weighted spin echo images acquired following gadolinium contrast agent injection but immediately before FUS-MB application. Circles indicate targeted CCMs and insets display magnified views of the targeted CCMs. Bottom row: T1-weighted spin echo images acquired following gadolinium contrast agent injection and FUS application. Columns indicate PNPs used for sonication. T1 contrast enhancement is visible following FUS-MB treatment and localized to perilesional boundaries of the sonicated CCM. c, Line graph of T1 contrast enhancement as the fold change in greyscale intensity of sonicated CCMs in the post image over the pre image (as seen in a). Slope of linear regression is significantly different (P < 0.0001) from 0 by F-test. Source data
Fig. 2
Fig. 2. Acute stability of CCMs exposed to FUS-MB treatment.
a, High-resolution T2-weighted spin echo images displaying either CCMs before sonication (top row) or 24 h following sonication (bottom row). Circles denote targeted CCMs and insets display magnified views of the targeted CCMs. b, Targeted CCM volumes before sonication and 24 h following sonication on T2-weighted spin echo images with colour indicating applied PNP. CCM volume does not significantly demonstrate changes in volume following sonication. NS, not significant; P = 0.41; two-tailed Wilcoxon matched-pairs signed-rank test. c, High-resolution susceptibility-weighted images of the same mice in a, displaying either CCMs before sonication (top row) or 24 h following sonication (bottom row). d, Targeted CCM volumes before sonication and 24 h following sonication on susceptibility-weighted images with colour indicating applied PNP. CCM volume does not significantly demonstrate changes in bleeding following sonication. P = 0.34; two-tailed Wilcoxon matched-pairs signed-rank test. Source data
Fig. 3
Fig. 3. Comparison of FUS-MB treatment contrast enhancement and acoustic emission signatures between C57BL/6 and CCM mice.
a, Representative T1-weighted spin echo images acquired following gadolinium contrast agent injection and FUS-MB in C57BL/6 mice or CCM mice for PNPs of 0.4–0.6 MPa. b, Bar graph of T1 contrast enhancement. Data are means ± s.d. Enhancement is comparable in C57BL/6 (n = 7, 6 and 3 mice for 0.4, 0.5 and 0.6 MPa, respectively) and CCM (n = 6, 6 and 3 mice for 0.4, 0.5 and 0.6 MPa, respectively) mice for PNPs of 0.4–0.6 MPa. P = 0.92 for 0.4 MPa, P = 0.9998 for 0.5 MPa and P = 0.96 for 0.6 MPa; two-way analysis of variance (ANOVA) with Šidák’s multiple comparison test. c, Spectrograms of the frequency response for each burst during the FUS-MB application averaged over cohorts of C57BL/6 and CCM mice at PNPs of 0.4–0.6 MPa (n = 3 mice per group and 2–3 sonication replicates per mouse). d, Subharmonic, first ultraharmonic and broadband emissions for C57BL/6 (n = 3 per group) and CCM (n = 3 per group) mice at PNPs of 0.4–0.6 MPa. Data are means ± s.d. P > 0.4 for all PNPs; two-way ANOVA with Šidák’s multiple comparisons test. e, Second, third and fourth harmonic emissions for C57BL/6 (n = 3 per group) and CCM (n = 3 per group) mice at PNPs of 0.4–0.6 MPa. Data are means ± s.d. Stable cavitation-associated signatures between C57BL/6 and CCM mice are comparable at 0.4 MPa and 0.5 MPa, but significantly increased in CCM mice at 0.6 MPa. P > 0.7 for 0.4–0.5 MPa and 2nd–4th harmonics; ****P < 0.0001, ***P = 0.0006 and ****P < 0.0001 for 0.6 MPa and 2nd, 3rd and 4th harmonics, respectively; two-way ANOVA with Šidák’s multiple comparisons test. Source data
Fig. 4
Fig. 4. CCM mice are not differentially sensitive to adverse effects generated by FUS-MB treatment at high PNPs.
a, Representative high-resolution, T2-weighted spin echo images of C57BL/6 and CCM mice at 1, 7 and 30 days post sonication at PNPs of 0.4–0.6 MPa in either a single sonication (Tx) or repeat sonication treatment regimen. Ovals denote focal column. White arrows denote hyperintensities associated with oedema. Yellow arrows denote hypointensities associated with haemosiderin deposition. b, Scatterplot of ipsilateral-to-contralateral greyscale intensity at 1 day post FUS (when oedema is visible) of C57BL/6 and CCM mice for PNPs of 0.4–0.6 MPa. *P = 0.047; comparison of fits with F-test for a 2nd-order polynomial regression. c, Scatterplot of ipsilateral-to-contralateral greyscale intensity at 30 days post FUS (when haemosiderin is visible) of C57BL/6 and CCM mice for PNPs of 0.4–0.6 MPa. P = 0.77; comparison of fits with F-test for a 2nd-order polynomial regression. d, Line graphs of ipsilateral-to-contralateral greyscale intensities over the 1-month imaging period for all PNPs within a mouse model and treatment arm. Oedema on day 1 is generally followed by haemosiderin on days 7 and 30. n = 3 for all groups. Data are means ± s.d. e, Ipsilateral-to-contralateral greyscale intensities over the 1-month imaging period for all PNPs within a mouse model and treatment arm, indicating no significant differences when comparing models at individual PNPs within a treatment arm. n = 3 for all groups. Data are means ± s.d. P = 0.1368 and P = 0.5386 for both PNPs in the single treatment arm for oedema and haemosiderin, respectively; P > 0.7 for PNPs of 0.4 MPa and 0.5 MPa, and P = 0.0923 for PNP of 0.6 MPa in the repeat treatment arm for oedema; P > 0.5 for all PNPs in the repeat treatment arm for haemosiderin; two-way ANOVA with Holm–Šidák’s multiple comparisons test. Source data
Fig. 5
Fig. 5. Real-time PCD modulation of PNP ensures the safety of sonicated brain tissue without compromising gadolinium delivery.
a, Applied PNP versus time during PCD feedback-controlled approach. Each line indicates the average applied PNP across two sonication targets for the same mouse during a single FUS sonication period. b, Representative T1-weighted contrast images before and after FUS-MB with PCD-modulated PNPs. c, T1 contrast enhancement as the fold change in greyscale intensity of sonicated CCMs in the post image over the pre image. n = 7. Data are means ± s.d. *P = 0.016; two-tailed Wilcoxon matched-pairs signed-rank test. d, T1 contrast enhancement as the fold change in greyscale intensity of sonicated CCMs in the post image over the pre image for CCM mice. Data are means ± s.d. n = 7, 8, 9 and 4 for PCD, 0.4 MPa, 0.5 MPa and 0.6 MPa groups, respectively. *P = 0.0293; one-way ANOVA with Dunnett’s multiple comparison’s test. e, Spectrogram of the frequency response for each burst during the FUS application averaged over CCM mice with PCD-modulated PNP (n = 4 mice and 2 sonication replicates per mouse). Dotted line indicates time of microbubble injection. f, Acoustic emissions for CCM mice. Data are means ± s.d. n = 8, 3, 3 and 3 for PCD, 0.4 MPa, 0.5 MPa and 0.6 MPa groups, respectively. **P = 0.003 for all comparisons; two-way ANOVA with Šidák’s multiple comparisons test. g, Representative T2-weighted spin echo images of CCM mice at 1, 7 and 30 days post sonication with PCD-modulated PNP. h, Line graphs of ipsilateral-to-contralateral greyscale intensities over the 1-month imaging period for CCM mice and all PNP regimens. n = 6, 6, 3 and 4 for 0.4 MPa, 0.5 MPa, 0.6 MPa and PCD-mod groups, respectively. Data are means ± s.d. i, Scatterplot of ipsilateral-to-contralateral greyscale intensity versus time-averaged PNP for CCM with single treatments and fixed PNP, repeat treatments and fixed PNP, or repeat treatments and PCD-modulated PNP mice on day 1 (left) or day 30 post FUS (right). For oedema, there is no correlation. *P = 0.0163 for haemosiderin; linear regression with F-test. jm, BBB opening duration in CCM mice after FUS-MB treatment with PCD-modulated PNP. j, Representative high-resolution T2-weighted baseline (left; 24 h pre FUS), low-resolution T1 contrast (middle; immediately post FUS) and high-resolution T1 RARE (right; 5 h post FUS) MRIs. Yellow outline denotes FUS application region. k, Contrast enhancement immediately post FUS (left; **P = 0.0025) and 5 h post FUS (right; **P = 0.0092). n = 3 per group. Two-tailed paired t-tests. l, Representative high-resolution T2-weighted baseline (left; 24 h pre FUS), low-resolution T1 contrast (middle; immediately post FUS) and high-resolution T1 RARE (right; 24 h post FUS) MRIs. Yellow outline denotes FUS application region. m, Contrast enhancement immediately post FUS (left; **P = 0.0039) and 24 h post FUS (right; P = 0.4136). n = 3 per group. Two-tailed paired t-tests. Source data
Fig. 6
Fig. 6. FUS-MB treatment arrests the growth of CCMs.
a,c,e, Longitudinal T2-weighted spin echo images for representative mice in the (a) single sonication with fixed PNP arm, (c) repeat sonication with fixed PNP arm or (e) repeat sonication with PCD-modulated PNP arm. Black circles indicate non-sonicated control lesions and coloured circles indicate sonicated lesions corresponding to PNP applied. White arrows denote new lesions formed in non-sonicated hemisphere. b,d,f, Left: summary plots comparing the natural log transform of CCM volume between sonicated CCMs and non-sonicated CCMs for mice in the (b) single sonication with fixed PNP arm, (d) repeat sonication with fixed PNP arm or (f) repeat sonication with PCD-modulated PNP arm. Data are means ± s.d. Right: line graphs of CCM volume for individual CCMs for each treatment group. At 30 days, sonicated CCMs are significantly smaller than non-sonicated control CCMs for all treatment arms. ***P = 0.0002, ****P < 0.0001 and *P = 0.0131 for the single fixed PNP, repeat fixed PNP and repeat PCD-mod. PNP arms, respectively; linear mixed-effect model and pairwise comparison with Tukey’s adjustment. At 7 days, sonicated CCMs are significantly smaller than non-sonicated CCMs in the repeat FUS and fixed PNP arm. **P = 0.0021, linear mixed-effect model and pairwise comparison with Tukey’s adjustment. Source data
Fig. 7
Fig. 7. FUS-MB treatment with fixed PNP and repeat sonications can prevent de novo lesion formation.
a,c,e, Top rows: T1-weighted spin echo images taken immediately following FUS-MB treatment with hyperintense signal denoting the focal column. Middle and bottom rows: minimum intensity projection images of longitudinal T2-weighted spin echo images to visualize through 1 mm of the focal column for representative mice in the (a) single sonication with fixed PNP arm, (c) repeat sonication with fixed PNP arm or (e) repeat sonication with PCD-modulated PNP arm. Black ovals denote contralateral non-sonicated ROIs for de novo quantification, while coloured ovals represent sonicated ROIs. b,d,f, Paired line graphs comparing the change in CCM number 1 month following FUS-MB between the sonicated brain region and the contralateral non-sonicated brain region for mice in the (b) single sonication with fixed PNP arm (n = 6 CCM mice), (d) repeat sonication with fixed PNP arm (n = 6 CCM mice) or (f) repeat sonication with PCD-modulated PNP arm (n = 4 CCM mice). Concentric circles indicate multiple mice with the same number of de novo CCMs. Colours indicate applied PNP. For mice receiving the repeat FUS regimen with fixed PNP, the number of new lesions formed in the sonicated brain region is significantly reduced compared with the contralateral brain region. *P = 0.0312; two-tailed Wilcoxon matched-pairs signed-rank test. g, Plot of de novo CCM formation and PNP for all treatment conditions. **P = 0.0064; linear regression indicates that de novo CCM formation and PNP are inversely correlated. h, Plot of de novo CCM formation and number of FUS applications (that is, # of Tx) for all treatment conditions. P = 0.0914; linear regression indicates that de novo CCM formation and # of Tx are not inversely correlated. Source data
Fig. 8
Fig. 8. FUS-MB treatment restores endothelial morphology to the mutated CCM vasculature and remodels CCM immune landscape.
a, Immunofluorescence images of non-sonicated and sonicated CCMs at 30 d post FUS-MB with staining for mutated vasculature (Krit1KO), microglia/macrophages (Iba1) and erythrocytes (Ter119). b, Graph of average Krit1KO area at 1, 7 and 30 days post FUS-MB for non-sonicated and sonicated CCMs, indicating reduced area in sonicated CCMs at 30 days. *P = 0.0199; linear mixed-effect model and pairwise comparison with Tukey’s adjustment. c, Immunofluorescence images of non-sonicated and sonicated CCMs at 1 and 7 d post FUS-MB with staining for mutated vasculature (Krit1KO), microglia/macrophages (Iba1) and proliferation (Ki67). d, Graph of density of microglia/macrophages at 1, 7 and 30 days post FUS-MB for non-sonicated and sonicated CCMs, revealing a reduced number in sonicated lesions at 1 day. ***P = 0.0003; linear mixed-effects model and pairwise comparison with Tukey’s adjustment. e, Graph of the natural log of the average microglia/macrophage area at 1, 7 and 30 days post FUS-MB for non-sonicated and sonicated CCMs, demonstrating an increase in microglia/macrophage size in sonicated lesions at 1 day. *P = 0.0106; linear mixed-effect model and pairwise comparison with Tukey’s adjustment. f, Immunofluorescence images of non-sonicated and sonicated CCMs at 1 day post FUS-MB with staining for mutated vasculature (Krit1KO), microglia/macrophages (Iba1), lysosomes (CD68) and erythrocytes (Ter119). Insets display ×63 maximum intensity projections of the corresponding ×20 image. Arrows denote macrophages. g, Graph of the natural log of phagocyte density at 1, 7 and 30 days post FUS-MB for non-sonicated and sonicated CCMs, revealing a reduced number in sonicated lesions at 1 day. ***P = 0.0009; linear mixed-effects model and pairwise comparison with Tukey’s adjustment. h, Graph of the natural log of the percent of erythrocytes co-localized in microglia/macrophages at 1, 7 and 30 days post FUS-MB for non-sonicated and sonicated CCMs, indicating a smaller amount in sonicated lesions at 7 days. *P = 0.0303; linear mixed-effects model and pairwise comparison with Tukey’s adjustment. Data are means ± s.d. (b,d,e,g,h). For FUS, n = 13, 37 and 24 CCMs at 1, 7 and 30 days, respectively. For FUS+, n = 40, 42 and 35 CCMs at 1, 7 and 30 days, respectively. Source data

Update of

References

    1. Snellings, D. A. et al. Cerebral cavernous malformation: from mechanism to therapy. Circ. Res.129, 195–215 (2021). - PMC - PubMed
    1. Detter, M. R., Snellings, D. A. & Marchuk, D. A. Cerebral cavernous malformations develop through clonal expansion of mutant endothelial cells. Circ. Res.123, 1143–1151 (2018). - PMC - PubMed
    1. Tanriover, G. et al. Ultrastructural analysis of vascular features in cerebral cavernous malformations. Clin. Neurol. Neurosurg.115, 438–444 (2013). - PubMed
    1. Wei, S. et al. Cerebral cavernous malformation proteins in barrier maintenance and regulation. Int. J. Mol. Sci.21, 675 (2020). - PMC - PubMed
    1. Peyre, M. et al. Somatic PIK3CA mutations in sporadic cerebral cavernous malformations. N. Engl. J. Med.385, 996–1004 (2021). - PMC - PubMed

MeSH terms

LinkOut - more resources