. 2025 May 13;8(1):148.
doi: 10.1038/s42004-025-01525-y.

Dual fragmentation via collision-induced and oxygen attachment dissociations using water and its radicals for C=C position-resolved lipidomics

Affiliations

Dual fragmentation via collision-induced and oxygen attachment dissociations using water and its radicals for C=C position-resolved lipidomics

Hiroaki Takeda et al. Commun Chem. .

Abstract

Oxygen attachment dissociation (OAD) is a tandem mass spectrometry (MS/MS) technique for annotating the positions of double bonds (C=C) in complex lipids. Although OAD has been used for untargeted lipidomics, its availability has been limited to the positive ion mode, requiring the independent use of a collision-induced dissociation (CID) method. In this study, we demonstrated the OAD MS/MS technique in the negative-ion mode for profiling phosphatidylserines, phosphatidylglycerols, phosphatidylinositols, and sulfatides, where the fragmentation mechanism remained consistent with that in the positive ion mode. Furthermore, we proposed optimal conditions for the simultaneous acquisition of CID- and OAD-specific fragment ions, termed OAciD, where oxygen atoms and hydroxy radicals facilitate C=C position-specific fragmentation, while residual water vapor induces cleavage of low-energy covalent bonds as observed in CID. Finally, theoretical fragment ions were implemented in MS-DIAL 5 to accelerate C=C position-resolved untargeted lipidomics. The OAciD methodology was used to illuminate brain region-specific marmoset lipidomes with C=C positional information, including the estimation of C=C positional isomer ratios. We also characterized the profiles of polyunsaturated fatty acid-containing lipids, finding that lipids containing omega-3 fatty acids were enriched in the cerebellum, whereas those containing omega-6 fatty acids were more abundant in the hippocampus and frontal lobe.


Conflict of interest statement

Competing interests: M.O. and H. Takahashi are research scientists at Shimadzu, Inc., Japan. All the other authors declare that they have no competing interests.

Figures

Fig. 1
Fig. 1. Characteristics of OAciD MS/MS.
a Major fragmentation of OAD MS/MS. b Fragmentation difference between positive and negative ion modes. c Appropriate collision energy in Ar gas and H2O vapor. The area value of MS2 peak was normalized to the maximum peak detected under the collision energy range of 5‒60 eV. All lipid subclasses are summarized in Fig. S2. d Fragmentation at the C=C position by increasing the collision energy. In the left panel, the orange and blue bars represent the MS2 peak areas of fragments at the C=C position, derived from the residual precursor and polar head loss ions, respectively. The ion at m/z 467.37 originated from the neutral loss of the polar head group (m/z 570.55); however, the notation “755.56 > 467.37” is used, as m/z 467.37 is a product ion generated from the precursor m/z 755.56. The green line plot indicates fragments from fatty acyl chains, also observed in CID mode using Ar gas. Error bars represent the standard deviations of four analytical replicates. Relative peak areas (%) denote the ion intensities in the product ion spectrum, with the most intense peak set to 100%. A summary of all lipid subclasses is provided in Fig. S3. The middle panels show the MS2 peak areas of fragments at the C=C position from residual precursor and polar head loss ions. A summary of all lipid subclasses is provided in Fig. S4. The right panels display the MS/MS spectra at 10, 20, and 30 eV.
Fig. 2
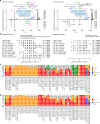
Fig. 2. Automated annotation of lipid standards using MS-DIAL 5 software.
a Summary of MS/MS spectra by setting 30 eV of collision energy in both positive and negative ion modes. b Calibration curve of each lipid subclass in positive and negative ion modes (n = 4). Data-dependent MS/MS mode was used for evaluation. Circles represent the linear range of the MS1 peak with R2 > 0.9800 (Supplementary Data 3). The fully filled circles represent concentrations where the C=C position could be determined, with two major fragments detected simultaneously in at least two out of four analyses. The half-filled circle for SM indicates that the C=C position was determined only on the N-acyl chain, not the long chain base. Annotation depth was assessed using the EquiSPLASH mixture containing deuterium-labeled standards. c Automated annotation results of 69 synthetic lipid standards using the optimized MS-DIAL 5 software. The UltimateSPLASH standard mixture was diluted 10, 20, 50, 100, 200, 500, 1000, and 2000 times with MeOH. For example, “x10” indicates a dilution 10 times less concentrated than the original, denoted as “x1”. Colors represent the structural depth of the automatic annotation: red indicates both fatty acyl composition and C=C position (MSL + DB); orange indicates fatty acyl composition only (MSL); green indicates species level annotation only (SL); blue indicates the misannotation of C=C position (DB_misannotation). If the MS/MS spectrum was not assigned to the precursor ion by data-dependent acquisition, a square shape with a black color is used (noMS2) The representative annotation was determined as follows: if the same lipid name was annotated in at least two of the four replicates, that name was used as the representative annotation. If the annotation results differed across all four replicates, the lipid with the highest score was adopted as the representative. In this study, fragment ions corresponding to the sphingobase Δ4 C=C positions were not detected under the applied collision energy settings. However, C=C position-specific fragment ions from N-acyl chains were detected, as confirmed using UltimateSPLASH standards. Therefore, the label “MSL + DB” was assigned to sphingolipids when the N-acyl chain C=C positions were determined. Lysophospholipids such as LPC, LPE, LPG, lyso-PI (LPI), and lyso-PS (LPS) are out of range for C=C position determination due to their saturated fatty acyl moieties. d Annotation results using the MS-DIAL 5 program when the MSL annotations were carried out before the C=C positional annotations were performed. The definitions of color and symbol are the same as used in Fig. 2c.
Fig. 3
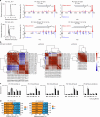
Fig. 3. Untargeted lipidomics of marmoset brain sections.
a Scatter plot of lipid molecules detected in marmoset brain section. b Number of lipids detected at the structural depth of fatty acyl compositions or C=C positions. c Hierarchical clustering analysis using the correlation coefficient between lipid subclasses. A total of 40 samples were used for the correlation analysis without discriminating between different regions and ages to characterize lipid subclasses. Correlation analyses were performed using Pearson correlation coefficient. The p values obtained from these analyses were adjusted for multiple comparisons using the false discovery rate method. Adjusted p-values were classified into significance levels and displayed using symbols: *** for p < 0.001, ** for p < 0.01, and * for p < 0.05. d Total amounts of representative lipid subclasses in each region and age. Five regions including frontal lobe (FL), hippocampus (HC), midbrain (MB), cerebellum (CB), and medulla (MD) were analyzed. Error bars indicate the standard deviations of the four biological replicates in each group.
Fig. 4
Fig. 4. Characterization of lipid molecules at the structural depth of the C=C position.
a Chromatograms and MS/MS spectra of structural isomers with different C=C positions. b Hierarchical clustering analysis using the correlation coefficient between PC molecules. Saturated FA (SFA) and n-9 MUFA, n-6 PUFA, and n-3 PUFA were analyzed using the same methods as in Fig. 3c. c Total amounts of constituent molecules in each region and age. Error bars indicate the standard deviations of the four biological replicates in each group. d The ratios of PC 16:0_16:1(Δ7) and PC 16:0_16:1(Δ9) and ratio of PC 16:0_18:1(Δ9) and PC 16:0_18:1(Δ11) among tissues. Error bars indicate the standard deviations of the biological replicates in each group where both young- and aged marmosets were included. Due to the limit of detection in the data-dependent acquisition mode for PC 16:0_16:1, total three samples containing one midbrain and two medulla samples were excluded. PC 14:0_18:1 isomers may be present as minor contaminants within the peak at 10.1 min; however, their contribution is negligible in marmoset brain regions. Further details are shown in Fig. S7.

Similar articles

References

    1. Harayama, T. & Riezman, H. Understanding the diversity of membrane lipid composition. Nat. Rev. Mol. Cell Biol.19, 281–296 (2018). - PubMed
    1. Olzmann, J. A. & Carvalho, P. Dynamics and functions of lipid droplets. Nat. Rev. Mol. Cell Biol.20, 137–155 (2019). - PMC - PubMed
    1. Cartier, A. & Hla, T. Sphingosine 1-phosphate: lipid signaling in pathology and therapy. Science366, eaar5551 (2019). - PMC - PubMed
    1. Liebisch, G. et al. Update on LIPID MAPS classification, nomenclature, and shorthand notation for MS-derived lipid structures. J. Lipid Res.61, 1539–1555 (2020). - PMC - PubMed
    1. Han, X. Lipidomics for studying metabolism. Nat. Rev. Endocrinol.12, 668–679 (2016). - PubMed

LinkOut - more resources