. 2025 May 14;14(1):17.
doi: 10.1186/s13619-025-00231-3.

Morphological segmentation with tiling light sheet microscopy to quantitatively analyze the three-dimensional structures of spinal motoneurons

Affiliations

Morphological segmentation with tiling light sheet microscopy to quantitatively analyze the three-dimensional structures of spinal motoneurons

Huijie Hu et al. Cell Regen. .

Abstract

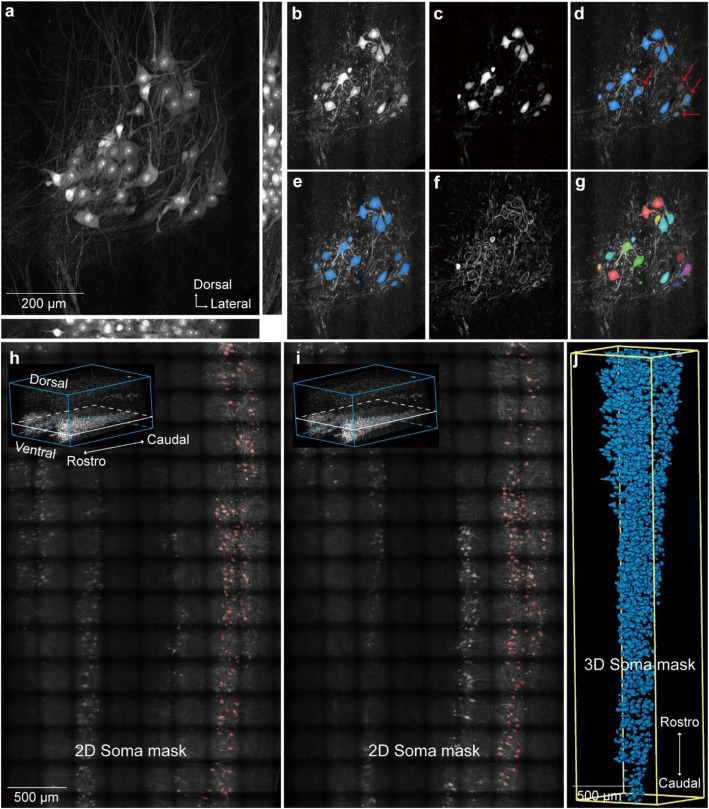
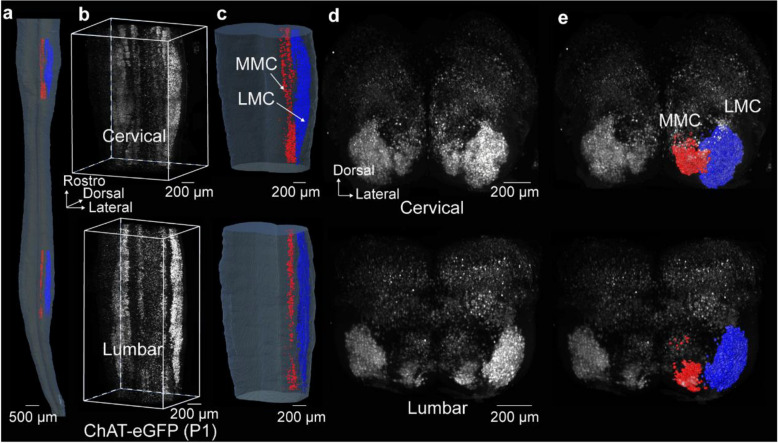
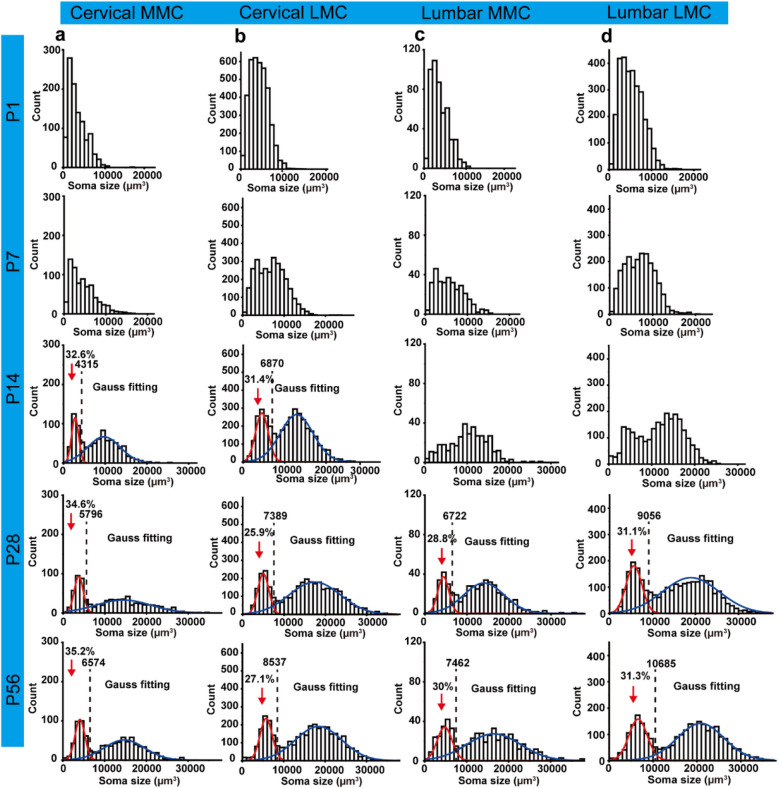
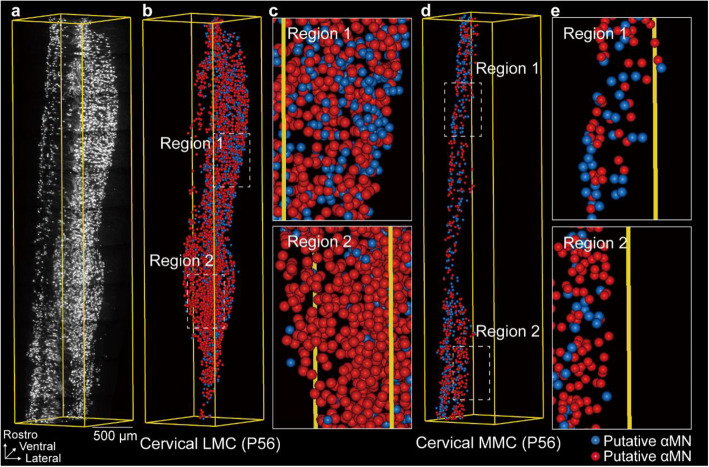
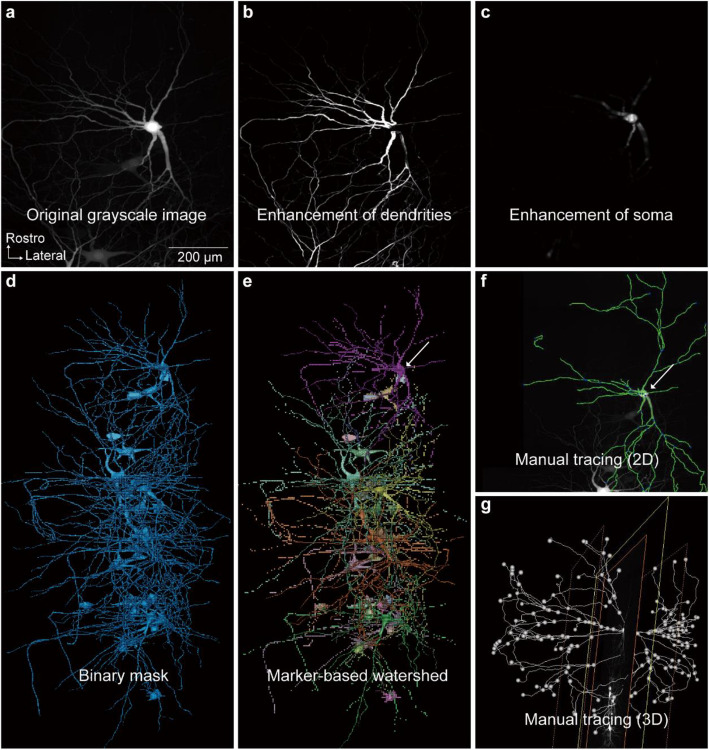
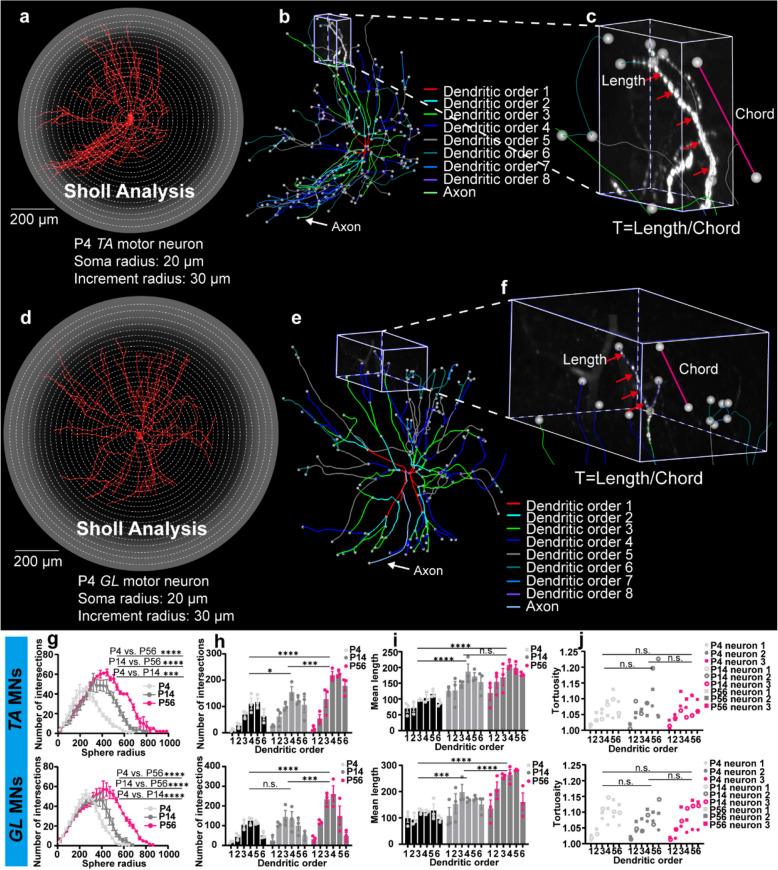
Spinal motoneurons control muscle fibers contraction and drive all motor behaviors in vertebrates. Although spinal motoneurons share the fundamental role of innervating muscle fibers, they exhibit remarkable diversity that reflects their specific identities. Defining the morphological changes during postnatal development is critical for elucidating this diversity. However, our understanding of the three-dimensional (3D) morphology of spinal motoneurons at these stages remains limited, largely due to the lack of high-throughput imaging tools. Using tiling light sheet microscopy combined with tissue clearing methods, we imaged motoneurons of the lateral and median motor column in the cervical and lumbar cord during postnatal development. By analyzing their soma size, we found that motoneurons innervating the upper limbs differentiate into two subpopulations with distinct soma size by postnatal day 14 (P14), while differentiation of motoneurons innervating the lower limbs is delayed. Furthermore, coupling adenovirus labeling with 3D volumetric reconstruction, we traced and measured the number and lengths of dendrites of flexor and extensor motoneurons in the lumbar cord, finding that the number of dendrites initially increases and subsequently declines as dendritic order rises. Together, these findings provide a quantitative analysis of the 3D morphological changes underlying spinal motoneuron diversity.

Keywords: 3D volumetric reconstruction; Dendritic arborization; Soma size; Spinal motoneurons; Tiling light sheet microscopy; Tissue clearing methods.


Conflict of interest statement

Declarations. Ethics approval and consent to participate: The collection of mice tissues used in this study was approved by the Institutional Animal Care and Use Committee of the Westlake University (Approval No: 19 - 035-GL). Consent for publication: Not applicable. Competing interests: The authors declare no competing interests.

Figures

Fig. 1
Fig. 1
The semi-automatic cell segmentation workflow utilizing the deep learning algorithm. a Grayscale image of a small 3D block with a data size of approximately 30 MB, with a scale bar of 200 μm. b A single slice extracted from (a). c Grayscale image after processing with the Median Filter command. d Automatically extracted soma boundaries obtained using the Hysteresis Thresholding command. e Soma boundaries predicted by the deep learning-trained model, with a scale bar of 500 μm. f Grayscale image after the Image Gradient command processing. g Soma segmentation achieved through the Marker-based Watershed inside Mask command. h, i Soma boundaries in the 3D image predicted by the deep learning-trained model, with a scale bar of 500 μm. j 3D rendering of the soma boundaries, with a scale bar of 500 μm
Fig. 2
Fig. 2
Reconstructed MMC and LMC neurons of P1 ChAT-eGFP. a The frontal view of the reconstructed MMC and LMC neurons of P1 ChAT-eGFP, with a scale bar of 500 μm. The red surface represented the reconstructed MMC, and the deep blue surface represented the reconstructed LMC. b Grayscale image of cervical cord (top), and the grayscale image of lumbar cord (bottom), with a scale bar of 200 μm. c Reconstructed LMC and MMC neurons of cervical cord (top), and lumbar cord (bottom), with a scale bar of 200 μm. d The transverse plane view of C5-T1 (top), and the transverse plane view of L1-L6 (bottom), with a scale bar of 200 μm. e The transverse plane view of C5-T1 (top), overlaid with the reconstructed MMC (depicted in red) and LMC (depicted in deep blue) neurons, with a scale bar of 200 μm. The transverse plane view of L1-L6 (bottom), overlaid with the reconstructed lumbar MMC (depicted in red) and LMC (depicted in deep blue), with a scale bar of 200 μm
Fig. 3
Fig. 3
Histograms of the soma size distribution of MNs. a Histograms of the soma size distribution of MNs in the cervical MMC of P1, P7, P14, P28, and P56 ChAT-eGFP. b Histograms of the soma size distribution of MNs in the cervical LMC of P1, P7, P14, P28, and P56 ChAT-eGFP. c Histograms of the soma size distribution of MNs in the lumbar MMC of P1, P7, P14, P28, and P56 ChAT-eGFP. d Histograms of the soma size distribution of MNs in the lumbar LMC of P1, P7, P14, P28, and P56 ChAT-eGFP. The volume distribution histograms of MNs are analyzed using Gaussian fitting. The volume range is 0~38,000 µm3, with intervals of 1,000 µm3. n = 1 animal per group
Fig. 4
Fig. 4
Spatial distribution pattern of putative γMNs and αMNs in the cervical cord. a Grayscale image of the cervical MNs of P56 ChAT-eGFP, with a scale bar of 500 μm. b Spatial distribution pattern of the putative γMNs and αMNs of the cervical LMC. c A magnified view of two regions in (c). d Spatial distribution pattern of the putative γMNs and αMNs of the cervical MMC. e A magnified view of two regions in (d)
Fig. 5
Fig. 5
The semi-automatic method for dendritic tree extraction. a Grayscale image of P14 TA MNs retrogradely labeled by AdV, with a scalebar of 200 μm. b Dendritic structure was enhanced by Structure Enhancement Filter (Rod Model) command. c Somatic structure was enhanced by the Structure Enhancement Filter (Ball Model) command. d The Interactive Thresholding command was employed to transform grayscale images into binary image. e The Marker-based Watershed inside Mask command assigned distinct labels to each MN. f The Centerline Tree command generated the dendritic skeleton. g Manual tracing and editing were performed with the Filament Editor
Fig. 6
Fig. 6
Quantitative analysis of the dendritic structures of the TA and GL MNs at P4, P14 and P56. a 3D surface reconstruction of a single TA MN, obtained using the Amira software, with a scalebar of 200 μm. b Skeletonize of a single TA MN, with dendritic branches color-coded by branch order. c Tortuosity of a single dendritic branch of a TA MN. The magenta line represents the chord length, and the red arrows indicate the 3D length of the dendritic branch. d 3D surface reconstruction of a single GL MN, obtained using the Amira software, with a scalebar of 200 μm. e Skeletonize of a single GL MN, with dendritic branches color-coded by branch order. f Schematization of tortuosity of a single dendritic branch of a GL MN. g Quantitative comparison for Sholl analysis of TA (top) and GL (bottom) MNs at P4, P14, and P56. h The number of crossings of each branch of TA (top) and GL (bottom) MNs with concentric circles for each branch order at P4, P14 and P56. i The mean length of the first six dendritic orders of TA (top) and GL (bottom) MNs at P4, P14, and P56. j The tortuosity of the first six dendritic orders of TA (top) and GL (bottom) MNs at P4, P14, and P56. All data are presented as mean ± SEM. p-values were obtained from two-way ANOVA with Tukey’s multiple comparisons test. Significance levels are indicated as follows: *p < 0.05, **p < 0.01, ***p < 0.001, ****p < 0.0001. Error bars represent standard error of mean. n = 3 neurons, from two animals

Similar articles

References

    1. Agalliu D, Takada S, Agalliu I, McMahon AP, Jessell TM. Motor neurons with axial muscle projections specified by Wnt4/5 signaling. Neuron. 2009;61(5):708–20. 10.1016/j.neuron.2008.12.026. - PMC - PubMed
    1. Arber S. Motor circuits in action: specification, connectivity, and function. Neuron. 2012;74(6):975–89. 10.1016/j.neuron.2012.05.011. - PubMed
    1. Arber S, Costa RM. Connecting neuronal circuits for movement. Science. 2018;360(6396):1403–4. 10.1126/science.aat5994. - PubMed
    1. Arnberg N. Adenovirus receptors: implications for targeting of viral vectors. Trends Pharmacol Sci. 2012;33(8):442–8. 10.1016/j.tips.2012.04.005. - PubMed
    1. Ashrafi S, Lalancette-Hébert M, Friese A, Sigrist M, Arber S, Shneider NA, et al. Wnt7A identifies embryonic γ-motor neurons and reveals early postnatal dependence of γ-motor neurons on a muscle spindle-derived signal. J Neurosci. 2012;32(25):8725–31. 10.1523/jneurosci.1160-12.2012. - PMC - PubMed

LinkOut - more resources