. 2025 May 13;8(1):746.
doi: 10.1038/s42003-025-08106-8.

Malnutrition exacerbates pathogenesis of Lutzomyia longipalpis sand fly-transmitted Leishmania donovani

Affiliations

Malnutrition exacerbates pathogenesis of Lutzomyia longipalpis sand fly-transmitted Leishmania donovani

Eva Iniguez et al. Commun Biol. .

Abstract

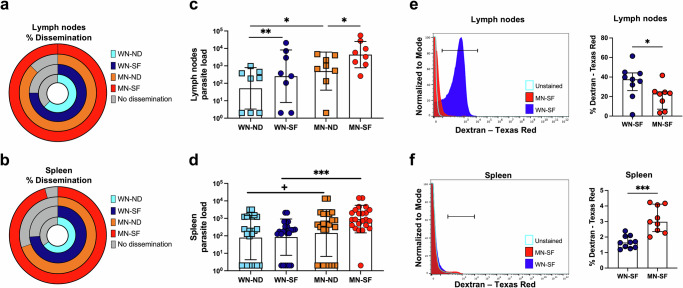
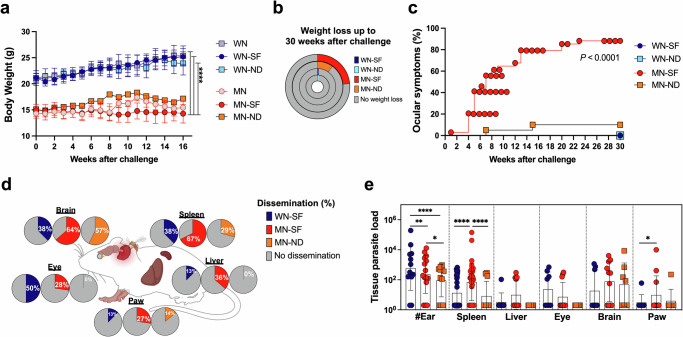
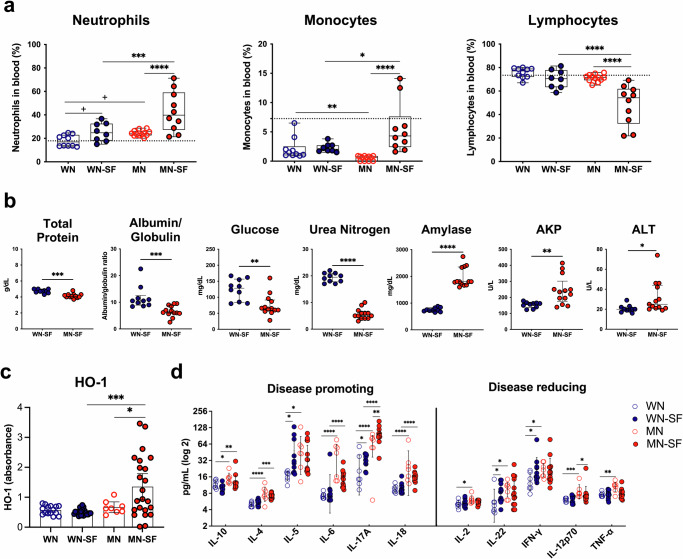
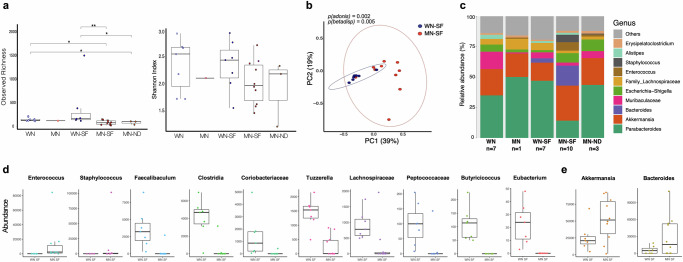
Visceral leishmaniasis (VL) is transmitted by Leishmania-infected sand fly bites and malnutrition is a known risk factor in human VL. Models using sand fly transmission or malnutrition promote parasite dissemination. By investigating features of L. donovani-Lutzomyia longipalpis transmission to malnourished mice, we show that a comparable IL1-β-driven acute inflammation is maintained in malnourished (MN-SF) and well-nourished (WN-SF) sand fly-infected mice. However, parasite dissemination was more pronounced in MN-SF that had a significantly higher acute (P ≤ 0.001) and chronic (P ≤ 0.0001) splenic parasite burden compared to WN-SF. Compared to WN-SF, MN-SF exhibited chronic clinical symptoms (P ≤ 0.0001), neutrophilia (P ≤ 0.001), lymphocytopenia (P ≤ 0.0001), increased heme oxygenase-1 (P ≤ 0.001) and IL17-A (P ≤ 0.0001) levels, dysregulation of liver enzymes, lymph node barrier dysfunction, and augmented dysbiosis, all associated with enhanced VL severity. Combining vector-transmission and malnutrition provides an improved model to study VL pathogenesis and host defense.


Conflict of interest statement

Competing interests: The authors declare no competing interests.

Figures

Fig. 1
Fig. 1. Malnourished animals produce a sustained IL1-β driven inflammatory response in ear skin following Leishmania donovani-infected sand fly bites.
a Representative inflammatory infiltrate of live cells gated on CD11b+ myeloid skin cells, then neutrophils (Ly6C+Ly6G+) and monocytes (Ly6C+Ly6G) at 24 h post-challenge. Number of CD11b+ cells, neutrophils, and inflammatory monocytes at 24 h (b) and 72 h (c) post-challenge. d Representative inflammatory infiltrate of neutrophils and inflammatory monocytes expressing IL1-β on CD11b+ cells at 24 h post-challenge. Number of CD11b+ cells, neutrophils, and monocytes expressing IL1-β at 24 h (e) and 72 h (f) post-challenge. g Heme oxygenase 1 (HO-1) expression in skin tissue lysate 72 h post-infected bites by Western blot. HSP90, loading control. h Log 2-fold change of HO-1 density relative to WN-unchallenged controls. All groups were first normalized against the HSP90 loading control from (g). WN well-nourished, MN Malnourished, SF sand fly, ND needle. Data are representative of two experiments, n = 5 animals per group, and each data point represents a pool of 2 ears per animal (af). g, h Western blots from three independent experiments, n = 5–10 pooled ears per group. Data shows the median with interquartile range (IQR) (b, c, e, f), and mean (h). p ≤ 0.05 was considered significant. +p ≤ 0.09, *p ≤ 0.05, **p ≤ 0.01, ***p ≤ 0.001, and ****p ≤ 0.0001. Significance was calculated by pairwise comparison by linear contrast expression (b, c, e, f) and Dunn’s test (h). Refer to Supplementary Data 2 file for the full statistical analysis report. All experiments were blinded.
Fig. 2
Fig. 2. Malnourished animals exhibit early parasite visceralization after L. donovani-infected sand fly bites.
Frequency of parasite dissemination to the lymph node (a) and spleen (b). Lymph node (c) and spleen (d) parasite load 72 h post-challenge. Accumulation of dextran-Texas red fluorescence in the lymph nodes (e) and spleen (f) of WN and MN animals at 72 h post-challenge. Flow cytometry gates were set up with unstained samples from lymph nodes and spleen collected from a WN animal injected with 1xPBS as control. WN well-nourished, MN Malnourished, SF sand fly, ND needle. Cumulative frequency of n = 8 animals per group (a), or n = 23 animals per group (b). Cumulative data of 2 experiments (a, c) and 5 experiments (b, d), n = 3–5 samples per group per experiment. Cumulative data of 2 experiments, n = 4–5 samples per group per experiment (e, f). Data shows the median with IQR (cf); p ≤ 0.05 was considered significant. +p ≤ 0.09, *p ≤ 0.05, **p ≤ 0.01, ***p ≤ 0.001, and ****p ≤ 0.0001. Significance was calculated by Fisher’s exact test (a), pairwise Chi-square test (b), and pairwise comparison based on estimated marginal means (cf). Refer to Supplementary Data 2 file for full the statistical analysis report. All experiments were blinded.
Fig. 3
Fig. 3. Sand fly-infected malnourished animals exhibit a chronic distinct VL pathogenicity and enhanced parasite dissemination.
a Animal body weight up to 16 weeks after challenge. b Percent of animals reaching 20% of body weight loss up to 30 weeks after challenge. c Percent of animals showing ocular symptoms. d Frequency of animals with parasite dissemination to the spleen, liver, eye, brain, and paw. e Tissue parasite load by qPCR up to 30 weeks after challenge. #Ear site of infected bites, WN well-nourished, MN Malnourished, SF sand fly, ND needle. Cumulative data of 2 experiments. n = 4–5 animals per group (a). Cumulative data of 5 experiments. n = 4–5 animals per group (b, c). Cumulative data of 2–5 experiments. n = 4–5 animals per group (d, e). Data shows the mean with 95% CI (a), and the median with IQR (e). p ≤ 0.05 was considered significant. *p ≤ 0.05, **p ≤ 0.01, and ****p ≤ 0.0001. Significance was calculated by pairwise comparison by Linear Contrast Expression (a), pairwise Fisher’s Exact test (b), pairwise Log-rank Mantel–Cox test (c), Fisher’s Exact test or Chi-square for the spleen (d), and pairwise comparison based one estimated marginal means (e). Refer to Supplementary Data 2 file for the full statistical analysis report. All experiments were blinded.
Fig. 4
Fig. 4. Systemic inflammatory and metabolic mediators are altered in sand fly-infected malnourished animals in the chronic stage of VL.
ad WN and MN animals were followed up to 30 weeks post-infected sand fly bites. a Percent of circulating neutrophils, monocytes, and lymphocytes, b Serum chemistry panel analytes, c Serum HO-1 levels, and d Serum cytokine levels. Unchallenged WN and MN animals were included as baseline controls. Dotted line in (a), hematology normal reference levels in unchallenged mice. WN well-nourished, MN Malnourished, SF sand fly challenge. Cumulative data of 2 (a, b, d, e) or 4 (c) independent experiments, n ≥ 3 animals per group. Data shows the mean with min and max points (a), median with IQR (b), and mean with 95% CI (c, d). p ≤ 0.05 was considered significant. +p ≤ 0.09, *p ≤ 0.05, **p ≤ 0.01, ***p ≤ 0.001, and ****p ≤ 0.0001. Significance was calculated by pairwise comparison based on estimated marginal means (a, c, d), and estimated marginal means for total protein, albumin, globulin, glucose, and urea nitrogen or linear contrast expression for ALT, ALP and amylase (b). Refer to Supplementary Data 2 file for the full statistical analysis report. All experiments were blinded.
Fig. 5
Fig. 5. Enhanced gut dysbiosis is observed in sand fly-infected malnourished animals in the chronic stage of VL.
ae Microbes in fecal matter from animals at baseline (WN and MN), after infected vector bites (WN-SF and MN-SF), or needle challenge (MN-ND) were compared. a Box plots showing the alpha diversity among groups calculated using observed richness and Shannon index values. b Principal coordinate analysis (PCoA) plot showing the beta diversity of WN-SF and MN-SF animals generated using a Bray–Curtis distance matrix. c Relative abundance bar plot of the top ten genera across groups. d Raw abundance box plots showing the top statistically significant differentially abundant bacteria for WN-SF compared to MN-SF. e Raw abundance plots for Akkermansia and Bacteroides, enriched in some MN-SF animals, but not significantly. Cumulative data of 2 experiments, n ≥ 3 animals per group, except for MN baseline where only one sample was analyzed. Data shows the mean with min and max points (a, d, e); *p ≤ 0.05 was considered significant, calculated by Wilcoxon test (a); differential abundance and significance were calculated using the ANCOM-BC tool (FDR adjusted p value ≤ 0.05) (d, e). All experiments were blinded.

References

    1. World Health Organization. WHO: Leishmaniasis Fact Sheet. https://www.who.int/news-room/fact-sheets/detail/leishmaniasis (2024).
    1. UNICEF. One third of children in the developing world are stunted by malnutrition. (2009).
    1. Badaro, R., Carvalho, E. M., Rocha, H., Queiroz, A. C. & Jones, T. C. Leishmania donovani: an opportunistic microbe associated with progressive disease in three immunocompromised patients. Lancet1, 647–649 (1986). - PubMed
    1. Cerf, B. J. et al. Malnutrition as a risk factor for severe visceral leishmaniasis. J. Infect. Dis.156, 1030–1033 (1987). - PubMed
    1. Dye, C., Vidor, E. & Dereure, J. Serological diagnosis of leishmaniasis: on detecting infection as well as disease. Epidemiol. Infect.110, 647–656 (1993). - PMC - PubMed

LinkOut - more resources