. 2025 Jul;32(7):1268-1281.
doi: 10.1038/s41594-025-01555-z. Epub 2025 May 13.

CTCF depletion decouples enhancer-mediated gene activation from chromatin hub formation

Affiliations

CTCF depletion decouples enhancer-mediated gene activation from chromatin hub formation

Magdalena A Karpinska et al. Nat Struct Mol Biol. 2025 Jul.

Abstract

Enhancers and promoters interact in three-dimensional (3D) chromatin structures to regulate gene expression. Here we characterize the mechanisms that drive the formation and function of these structures in a lymphoid-to-myeloid transdifferentiation system. Based on analyses at base pair resolution, we demonstrate a close correlation between binding of regulatory proteins, formation of chromatin interactions and gene expression. Multi-way interaction analyses and computational modeling show that tissue-specific gene loci are organized into chromatin hubs, characterized by cooperative interactions between multiple enhancers, promoters and CTCF-binding sites. While depletion of CTCF strongly impairs the formation of these chromatin hubs, the effects of CTCF depletion on gene expression are modest and can be explained by rewired enhancer-promoter interactions. These findings demonstrate a role for enhancer-promoter interactions in gene regulation that is independent of cooperative interactions in chromatin hubs. Together, these results contribute to our understanding of the structure-function relationship of the genome during cellular differentiation.


Conflict of interest statement

Competing interests: The authors declare no competing interests.

Figures

Fig. 1
Fig. 1. Chromatin architecture through lymphoid-to-myeloid transdifferentiation.
a, Schematic overview of the BLaER1 lymphoid-to-myeloid transdifferentiation system. b, TRIB1 expression through transdifferentiation, derived from TT-seq data. Bars represent the average of two biological replicates; corresponding data points are shown as dots. c, MYB expression through transdifferentiation, as in b. d, Chromatin landscape of the TRIB1 locus (chr8:125,079,965–125,739,965; 660 kb; hg38) through transdifferentiation. From top to bottom: gene annotation, CTCF ChIP–seq, ATAC–seq, Mediator complex subunit 26 (MED26) ChIPmentation, structural maintenance of chromosomes 1A (SMC1A) ChIPmentation, MCC data from the viewpoint of the TRIB1 promoter. Axes are scaled to signal with the following ranges: CTCF, 0–12,178; accessibility, 0–8,276; Mediator, 0–5,726; cohesin, 0–2,129; MCC, 0–40. Orientations of CTCF motifs are indicated by arrowheads (forward in red, reverse in blue). MCC interactions with CBSs, enhancers and promoters are annotated with cyan, magenta and orange triangles, respectively. e, Chromatin landscape of the MYB locus (chr6:134,992,474–135,472,474; 480 kb; hg38), as in d, with MCC interactions with transient enhancers annotated with blue triangles and the following axis ranges: CTCF, 0–6,052; accessibility, 0–3,506; Mediator, 0–2,277; cohesin, 0–1,247; MCC, 0–30. f, Interaction frequencies of promoters of iMac-specific genes with enhancers, promoters and CBSs through transdifferentiation. Data are derived from three biological replicates; the number of data points (n) in each category is shown in the figure. Box plots show the interquartile range and median of the data; whiskers indicate the minima and maxima within 1.5 × interquartile range; asterisks indicate statistical significance (two-sided paired Wilcoxon signed-rank test, 96 h versus 0 h); enhancer, P < 2.2 × 10−16; promoter, P = 5.6 × 10−5; CBS, P < 2.2 × 10−16. g, Interaction frequencies of promoters of B cell-specific genes, as in f; enhancer, P = 5.0 × 10−10; promoter, P = 0.83; CBS, P = 0.21. NS, not significant. h, Correlation between differential enhancer–promoter interaction frequencies and differential Mediator binding levels at the interacting elements (24 h versus 0 h and 96 h versus 0 h), based on Spearman’s correlation test. FC, fold change. i, Correlation between differential enhancer–promoter interaction frequencies and differential cohesin binding levels, as in h. Source data
Fig. 2
Fig. 2. Interaction patterns across classes of cis-regulatory elements.
a, Chromatin landscape of the NFKBIZ locus (chr3:101,795,424–102,255,424; 460 kb; hg38), as in Fig. 1d, with MCC data from the viewpoint of the promoter, ppCBS and bCBS. Axes are scaled to signal with the following ranges: CTCF, 0–5,547; accessibility, 0–4,883; Mediator, 0–2,252; cohesin, 0–1,773; MCC, 0–40. b, NFKBIZ expression through transdifferentiation, as in Fig. 1b. c, Distribution of enhancer–promoter distances of promoters with and without a ppCBS (±5 kb from the promoter). The gray line marks the 150-kb threshold used to classify distal enhancers in Extended Data Fig. 2c. d, Interaction frequencies of ppCBSs of iMac-specific genes, as in Fig. 1f; enhancer, P < 2.2 × 10−16; promoter, P = 2.7 × 10−5; CBS, P < 2.2 × 10−16. e, Interaction frequencies of bCBSs of iMac-specific genes, as in Fig. 1f; enhancer, P < 2.2 × 10-16; promoter, P = 6.4 × 10−10; CBS, P < 2.2 × 10−16. f, Comparison of the proportion of interactions of promoters, ppCBSs and bCBSs with enhancers, promoters and CBSs in iMac-specific gene loci. g, Correlation between differential interaction frequencies between ppCBS and CBSs and differential cohesin binding levels, as in Fig. 1h. h, Correlation between differential interaction frequencies between bCBS and CBSs and differential cohesin binding levels, as in Fig. 1h. Source data
Fig. 3
Fig. 3. Dynamic chromatin hub formation and dissolution during differentiation.
a, Schematic overview of Tri-C data visualization. Viewpoint (VP)-specific contact matrices show the frequencies at which two regions interact simultaneously with the viewpoints. Proximity signals around the viewpoint are excluded. Quantified regions for enhancer viewpoints include three-way interactions involving two enhancers and a promoter (E–E–P hubs) and three-way interactions involving an enhancer, a CBS and any other cis-regulatory element (E–C–X hubs). Quantified regions for the CBS viewpoints include three-way interactions involving three CBSs (C–C–C hubs) and three-way interactions involving a CBS and any combination of enhancers and/or promoters (C–E/P hubs). b, CCR1 expression through transdifferentiation, as in Fig. 1b. c, RAG2 expression through transdifferentiation, as in Fig. 1b. d, Tri-C contact matrices of the CCR1 locus (chr3:45,902,299–46,427,299; 525 kb; 2.5-kb resolution; hg38) through transdifferentiation. The top right matrix shows Tri-C data from the viewpoint of an enhancer; the bottom left matrix shows the viewpoint of a bCBS. Viewpoints are indicated with white triangles and black arrows. E–E–P contacts are highlighted with cyan circles, E–C–X and C–E/P contacts are shown with magenta circles, and C–C–C contacts are shown with dark blue circles. Profiles below show CTCF ChIP–seq, MED26 ChIPmentation and SMC1A ChIPmentation. Axes are scaled to signal with the following ranges: CTCF, 0–10,069; cohesin, 0–2,960; Mediator, 0–6,075. e, Tri-C contact matrices of the RAG2 locus (chr11:36,486,822–36,756,822; 170 kb; 1.5-kb resolution; hg38), as in d, with the following axis ranges: CTCF, 0–14,993; cohesin, 0–2,868; Mediator, 0–2,831. f, Multi-way interaction frequencies of E–E–P and E–C–X hubs in iMac-specific loci through transdifferentiation, as in Fig. 1f; E–E–P hubs, P = 1.2 × 10−8; E–C–X hubs, P = 4.5 × 10−14. g, Multi-way interaction frequencies of C–E/P and C–C–C hubs in iMac-specific loci, as in Fig.1f; C–E/P hubs, P = 6.1 × 10−5; C–C–C hubs, P = 0.14. h, Multi-way interaction frequencies of E–E–P and E–C–X hubs in B cell-specific loci, as in Fig. 1f; E–E–P hubs, P = 2.4 × 10−4; E–C–X hubs, P = 1.3 × 10−4. i, Multi-way interaction frequencies of C–E/P and C–C–C hubs in B cell-specific loci, as in Fig. 1f; C–E/P hubs, P = 0.64; C–C–C hubs, P = 0.031. Source data
Fig. 4
Fig. 4. CTCF is not required for pairwise enhancer–promoter interactions.
a, Schematic overview of CTCF depletion during lymphoid-to-myeloid transdifferentiation. IAA, indole-3-acetic acid. b, Chromatin interactions in the CCR1 locus (chr3:45,902,299–46,427,299; 525 kb; hg38) in control and CTCF-depleted cells at 96 h after differentiation induction. From top to bottom: gene annotation, ATAC–seq, MED26 ChIPmentation, SMC1A ChIPmentation, CTCF ChIPmentation, MCC data from the viewpoint of the promoter. Axes are scaled to signal with the following ranges: accessibility, 0–1,565; Mediator, 0–1,463; cohesin, 0–975; CTCF, 0–468; MCC, 0–40. Annotation as in Fig. 1d. c, Chromatin interactions in the NFKBIZ locus (chr3:101,766,932–102,266,932; 500 kb; hg38), as in b, with the following axis ranges: accessibility, 0–4,883; Mediator, 0–760; cohesin, 0–367; CTCF, 0–286; MCC, 0–40. d, Chromatin interactions in the TRIB1 locus (chr8:125,079,965–125,739,965; 660 kb; hg38), as in b, with the following axis ranges: accessibility, 0–8,276; Mediator, 0–1,858; cohesin, 0–1,660; CTCF, 0–468; MCC, 0–40. e, Chromatin interactions in the SRGN locus (chr10:68,884,514–69,234,514; 350 kb; hg38), as in b, with the following axis ranges: accessibility, 0–5,900; Mediator, 0–1,430; cohesin, 0–777; CTCF, 0–318; MCC, 0–50. f, Interaction frequencies of promoters of iMac-specific genes with enhancers, promoters and CBSs at 0 h and at 96 h in control and CTCF-depleted cells, as in Fig. 1f; enhancer, P = 4.1 × 10−7; promoter, P = 8.9 × 10−7; CBS, P = 7.2 × 10−16. Source data
Fig. 5
Fig. 5. CTCF supports the formation of chromatin hubs.
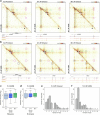
a, Tri-C contact matrices of the CCR1 locus (chr3:45,902,299–46,427,299; 525 kb; 2.5-kb resolution; hg38) from the viewpoint of an enhancer in control (top right matrix) and CTCF-depleted (bottom left matrix) cells at 96 h after differentiation induction, as in Fig. 3d. b, Tri-C contact matrices of the NFKBIZ locus (chr3:101,699,405–102,350,405; 651 kb; 3.5-kb resolution; hg38), as in a, with the following axis ranges: CTCF, 0–5,547; cohesin, 0–1,773; Mediator, 0–2,252. c, Tri-C contact matrices of the TRIB1 locus (chr8:124,988,732–125,788,732; 800 kb; 4-kb resolution; hg38), as in a, with the following axis ranges: CTCF, 0–12,178; cohesin, 0–2,129; Mediator, 0–5,726. d, Tri-C contact matrices of the CCR1 locus generated with molecular dynamics simulations, as in a. The profile below shows cohesin flow (net number of cohesin molecules moving through the locus per minute) in control and CTCF-depleted conditions. Positive values indicate cohesin movement in the sense direction; negative values indicate the antisense direction; extreme values imply less constrained cohesin movement. e, Tri-C contact matrices of the NFKBIZ locus generated with molecular dynamics simulations, as in b,d. f, Tri-C contact matrices of the TRIB1 locus generated with molecular dynamics simulations, as in c,d. g, Cohesin cluster size frequencies, measured as the fraction of the total number of molecules from the simulations of the CCR1 locus. h, Cohesin cluster size frequencies in the NFKBIZ locus, as in g. i, Cohesin cluster size frequencies in the TRIB1 locus, as in g. j, Frequencies of three-way interactions involving two enhancers and a promoter (E–E–P hub) and three-way interactions involving an enhancer, a CBS and any other cis-regulatory element (E–C–X hub) in iMac-specific loci at 0 h and at 96 h in control and CTCF-depleted (depl.) cells, as in Fig. 1f; E–E–P hubs, P = 7.1 × 10−8; E–C–X hubs, P = 9.3 × 10−14. Source data
Fig. 6
Fig. 6. Pairwise enhancer–promoter interactions correlate with gene expression levels.
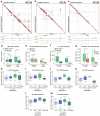
a, Heatmap showing the Z score of normalized RNA counts of B cell-specific genes (n = 2,968) and iMac-specific genes (n = 3,341) at 0 h and at 96 h in control-treated and CTCF-depleted cells. RNA-seq experiments were performed in two biological replicates. b, Chromatin interactions in the LMO2 locus (chr11:33,804,269–34,154,269; 350 kb; hg38) in control and CTCF-depleted cells at 96 h after differentiation induction. From top to bottom: gene annotation, ATAC–seq, MED26 ChIPmentation, SMC1A ChIPmentation, CTCF ChIPmentation, MCC data from the viewpoint of the promoter. Axes are scaled to signal with the following ranges: accessibility, 0–4,018; Mediator, 0–7,353; cohesin, 0–1,875; CTCF, 0–12,417; MCC, 0–40. Annotation as in Fig. 1d, with ectopic interactions in CTCF-depleted cells highlighted in light blue. c, Chromatin interactions in the KDM7A locus (chr7:139,961,429–140,511,429; 550 kb; hg38), as in b, with the following axis ranges: accessibility, 0–3,566; Mediator, 0–7,621; cohesin, 0–2,469; CTCF, 0–7,069; MCC, 0–40. d, CAPRIN1 expression levels at 0 h and at 96 h in control-treated and CTCF-depleted cells, derived from RNA-seq data. Bars represent the average of two biological replicates; corresponding data points are shown as dots. e, SLC37A3 expression levels, as in d. f, Correlation between differential expression levels and total enhancer–promoter interaction (EPI) frequencies (24 h versus 0 h and 96 h versus 0 h) based on Spearman’s correlation test. g, Correlation between differential expression levels and the product of total EPI frequencies and promoter accessibility levels, as in f. h, Graphical summary: extruding cohesin molecules are stalled at CBSs, promoters and enhancers; in the presence of CTCF (left), this leads to detectable clustering of these elements in chromatin hubs; in the absence of CTCF (right), these clusters form less frequently; however, enhancers still interact with their cognate promoters in a pairwise manner (example only shown for one of the two enhancers) and thereby maintain gene expression levels. TFs, transcription factors. Source data
Extended Data Fig. 1
Extended Data Fig. 1. Characterization of the BLaER1 lymphoid-to-myeloid transdifferentiation system.
(a) Expression of marker genes through transdifferentiation, measured with RT-qPCR. Expression of B-cell marker genes (IGJ, VPREB3) is shown as fold change (FC) relative to the 0 h timepoint; expression of iMac marker genes (CD14, FCGR1B) is shown relative to 168 h. Bars represent the average of 2 biological replicates; corresponding data points are shown as dots. (b) Changes in cell surface markers during lymphoid-to-myeloid transdifferentiation, measured by flow cytometry. A representative example of 2 biological replicates is shown. Gating based on froward scatter height (FSC-H) and forward scatter area (FSC-A) was used to exclude doublets (panel 1); gating based on side scatter height (SSC-H) and FSC-A was used to exclude debris (panel 2); GFP + , alive cells were selected (panel 3); quadrant gates were set on the 0 h sample, which is CD19+ and CD11b- (panel 4). (c) Chromatin landscape of the TRIB1 locus (chr8:125,079,965-125,739,965; 660 kb; hg38) through transdifferentiation. From top to bottom: Hi-C contact matrix (5 kb resolution), gene annotation, TT-seq, H3K27ac ChIP-seq, H3K27me3 ChIP-seq, CTCF ChIP-seq, Capture-C data from the viewpoint of the TRIB1 promoter. Axes are scaled to signal with the following ranges: RNA synthesis = 0–10455; H3K27ac = 0–5311; H3K27me3 = 0–100; CTCF = 0–12178; Capture-C = 0–1800. Annotation as in Fig. 1d. (d) Chromatin landscape of the MYB locus (chr6:134,992,474-135,472,474; 480 kb; hg38), as in panel c and Fig. 1e, with the following axes ranges: RNA synthesis = 0–12791; H3K27ac = 0–3930; H3K27me3 = 0–100; CTCF = 0–6052; Capture-C = 0–2500. (e) Correlation between ATAC-seq signals ( ± 500 kb from the viewpoint) and MCC interaction frequencies, based on Spearman’s correlation test. (f) Correlation between differential enhancer-promoter interaction frequencies and differential H3K27ac levels at the interacting elements (24 h vs 0 h), based on Spearman’s correlation test. (g) Correlation between differential enhancer-promoter interaction frequencies and differential eRNA levels (24 h vs 0 h and 96 h vs 0 h), derived from TT-seq, as in panel f. (h-j) Histogram showing the distribution of the number of enhancer (h), promoter (i) and CBS (j) interactions with the promoter viewpoints per locus as detected by MCC. (k) Overview of the average number of enhancer, promoter, and CBS interactions with the promoter viewpoints as detected by MCC. Source data
Extended Data Fig. 2
Extended Data Fig. 2. Interaction patterns of promoters and CTCF-binding sites through lymphoid-to-myeloid transdifferentiation.
(a) Chromatin landscape of the ARLC4 locus (chr2:233,966,201-234,566,201; 600 kb; hg38) through transdifferentiation, as in Fig. 2a, with the following axes ranges: CTCF = 0–9200; Accessibility = 0–3204; Mediator = 0–5636; Cohesin = 0–2515; MCC = 0–40. (b) ARLC4 expression through transdifferentiation, as in Fig. 1b. (c) Comparison of enhancer-promoter interaction frequencies of iMac-specific genes with and without a ppCBS ( ± 5 kb from the promoter), as in Fig. 1f. Analysis is performed for all interacting enhancers and distal ( > 150 kb) enhancers only and shows that iMac genes with a ppCBS have lower baseline interactions with all enhancers compared to genes without a ppCBS but increased interactions specifically with distal enhancers at 96 h. (d) Interaction frequencies of ppCBSs of B-cell-specific genes with enhancers, promoters, and CBSs, as in Fig. 1f; enhancer: p = 8.8 × 10⁻⁴; promoter: p = 0.88; CBS: p = 4.0 × 10⁻⁴. (e) Interaction frequencies of bCBSs of B-cell-specific genes, as in Fig. 1f; enhancer: p = 9.7 × 10⁻⁶; promoter: p = 0.82; CBS: p = 4.0 × 10⁻⁴. (f) Comparison of the proportion of interactions of promoters, ppCBSs, and bCBSs with enhancers, promoters, and CBSs in B-cell-specific gene loci (g) Correlation between differential interaction frequencies between ppCBS and CBSs and differential CTCF binding levels at the interacting elements (24 h vs 0 h and 96 h vs 0 h), based on Spearman’s correlation test. (h) Correlation between differential interaction frequencies between bCBS and CBSs and differential CTCF binding levels, as in panel g. Source data
Extended Data Fig. 3
Extended Data Fig. 3. Dynamic chromatin hub formation during lymphoid-to-myeloid transdifferentiation.
(a) Tri-C contact matrices of the NFKBIZ locus (chr3:101,699,405-102,350,405; 651 kb; 3.5 kb resolution; hg38) through transdifferentiation, as in Fig. 3d, with E-E-P contacts highlighted in cyan circles, E-C-X and C-E/P contacts in magenta circles, C-C-C contacts in dark blue circles, and CBS stripes in grey rectangles, and with the following axes ranges: CTCF = 0–5547; Cohesin = 0–1773; Mediator = 0–2252. (b) Tri-C contact matrices of the TRIB1 locus (chr8:124,988,732-125,788,732; 800 kb; 4 kb resolution; hg38) through transdifferentiation, as in panel a, with the following axes ranges: CTCF = 0–12178; Cohesin = 0–2129; Mediator = 0–5726. (c) Multi-way interaction frequencies of stripes involving a CBS viewpoint and an interacting CBS in iMac-specific loci through transdifferentiation, as in Fig. 1f; p = 7.5 × 10⁻⁷. (d) Multi-way interaction frequencies of CBS stripes in B-cell-specific loci, as in panel 1 f; p = 0.30. (e-f) Histogram showing the distribution of the number of multi-way interactions with the enhancer viewpoints (e) and bCBS viewpoints (f) per locus as detected by Tri-C. Source data
Extended Data Fig. 4
Extended Data Fig. 4. Characterization of CTCF depletion during lymphoid-to-myeloid transdifferentiation.
(a) Comparison of CTCF occupancy in control-treated and CTCF-depleted cells at 96 h after differentiation induction, measured by ChIPmentation. Data are represented in heatmaps of ± 1 kb regions surrounding CTCF-binding sites (CBSs), with units in the gradient color key indicating coverage scores per genomic region. Merged data of 2 biological replicates are shown. (b) Expression of marker genes through transdifferentiation upon CTCF depletion, as in Extended Data Fig. 1a. Bars represent the average of 2 biological replicates, except for the 0 h condition, which shows 1 biological replicate; corresponding data points are shown as dots. (c) Correlation between differential enhancer-promoter interaction frequencies and differential Mediator binding levels at the interacting elements during lymphoid-to-myeloid transdifferentiation (grey datapoints; 24 h vs 0 h and 96 h vs 0 h) and upon CTCF depletion (red datapoints; 96 h control vs 96 h CTCF depletion), based on Spearman’s correlation test. (d) Correlation between differential enhancer-promoter interaction frequencies and differential cohesin binding levels, as in panel c. Source data
Extended Data Fig. 5
Extended Data Fig. 5. CTCF supports the formation of enriched multi-way interactions in chromatin hubs.
(a) Triplet correlation coefficients of multi-way interactions with the enhancer viewpoint, generated with molecular dynamics simulations of the CCR1 locus in control and CTCF-depleted conditions, as in Fig. 5a. Correlated (red) regions show a higher propensity for cooperative interactions with the viewpoint than expected based on their pair-wise interaction frequencies (white). (b) Triplet correlation coefficients of multi-way interactions with the enhancer viewpoint in the NFKBIZ locus in control and CTCF-depleted cells at 96 h, as in panel a and Fig. 5b. (c) Triplet correlation coefficients of multi-way interactions with the enhancer viewpoint in the TRIB1 locus in control and CTCF-depleted cells at 96 h, as in panel a and Fig. 5c. (d) Interaction frequencies of the promoters of modelled gene loci (CCR1, NFKBIZ, and TRIB1) with enhancers and CBSs at 96 h in control and CTCF-depleted cells, derived from experimental MCC data, as in Fig. 1f; enhancer: p = 0.84; CBS: p = 0.0019). (e) Interaction frequencies of the promoters of modelled gene loci (CCR1, NFKBIZ, and TRIB1) with enhancers and CBSs at 96 h in control and CTCF-depleted cells, extracted from the models, as in Fig. 1f; enhancer: p = 0.24; CBS: p = 1.7 × 10⁻⁴. (f) Multi-way interaction frequencies of E-E-P and E-C-X hubs in the modelled gene loci at 96 h in control and CTCF-depleted cells, derived from experimental Tri-C data, as in Fig. 1f; E-E-P hubs: p = 4.9 × 10⁻⁴; E-C-X hubs: p = 6.1 × 10⁻⁵. (g) Multi-way interaction frequencies of E-E-P and E-C-X hubs in the modelled gene loci at 96 h in control and CTCF-depleted cells, extracted from the models, as in Fig. 1f; E-E-P hubs: p = 4.9 × 10⁻⁴; E-C-X hubs: p = 6.1 × 10⁻⁵. (h-m) Frequencies of three-way interactions involving two enhancers and a promoter (E-E-P hubs), three-way interactions involving three enhancers (E-E-E hubs), three-way interactions involving one enhancer and two promoters (E-P-P hubs), and three-way interactions involving an enhancer, CTCF-binding site, and any other cis-regulatory element (E-C-X hubs) in iMac-specific loci at 0 h and 24 h and at 96 h in control and CTCF-depleted cells, as in Fig. 1f. Source data
Extended Data Fig. 6
Extended Data Fig. 6. Changes in gene expression following CTCF depletion can be explained by rewired pair-wise enhancer-promoter interactions.
(a) Volcano plot showing differentially expressed genes between control-treated and CTCF-depleted cells at 96 h after differentiation induction, as measured by RNA-seq in 2 biological replicates. The x-axis shows the fold change (FC) in expression; the y-axis shows the adjusted p-value. The horizontal line and vertical lines indicate the significance threshold of adjusted p-value < 0.01 and effect size threshold of log2FC > 0.6 or < -0.6, respectively. Statistical significance is assessed with DESeq2 using the Wald test (two-sided). P-values are adjusted for multiple comparisons using the Benjamini-Hochberg method to control the false discovery rate (FDR). Targeted genes are highlighted and those that are significantly changed upon CTCF depletion are labelled. Targeted genes described in the text that are not labelled (for example, CCR1 and NFKBIZ) are not significantly up- or down-regulated upon CTCF depletion. (b) Comparison of the proportion of B-cell-specific genes, iMac-specific genes, and genes that are stably expressed during lymphoid-to-myeloid-transdifferentiation among the genes that are downregulated, unchanged, or upregulated upon CTCF depletion. (c) Distribution of CBS-promoter distances (of the nearest CBS) of genes that are unchanged, upregulated, or downregulated upon CTCF depletion. (d) Distribution of enhancer-promoter distances (of all paired enhancers, see Methods) of genes that are unchanged, upregulated, or downregulated upon CTCF depletion. (e) Distribution of enhancer-promoter distances of increased and decreased enhancer-promoter interactions upon CTCF depletion in targeted iMac-specific loci as identified by MCC. The grey line marks the 150 kb threshold used to classify distal enhancers in Extended Data Fig. 2c. (f) Chromatin interactions in the IRF8 locus (chr16:85,769,160-86,069,160; 300 kb; hg38) in control and CTCF-depleted cells, as in Fig. 6b, with the following axes ranges: Accessibility = 0–1776; Mediator = 0–4261; Cohesin = 0–3315; CTCF = 0–12417; MCC = 0–40. (g) Chromatin interactions in the MAFB locus (chr20:40,156,606-40,976,606; 820 kb; hg38) in control and CTCF-depleted cells, as in Fig. 6b, with the following axes ranges: Accessibility = 0–3567; Mediator = 0–5231; Cohesin = 0–2232; CTCF = 0–10212; MCC = 0–30. Source data

Similar articles

Cited by

  • 3D Genome Engineering: Current Advances and Therapeutic Opportunities in Human Diseases.
    Jiang X, Wang X, Shen S, Hou S, Yu C. Jiang X, et al. Research (Wash D C). 2025 Sep 1;8:0865. doi: 10.34133/research.0865. eCollection 2025. Research (Wash D C). 2025. PMID: 40901634 Free PMC article. Review.
  • Multiscale information processing in the immune system.
    Navarro Quiroz R, Villarreal Camacho J, Zarate Peñata E, Bello Lemus Y, López-Fernández C, Gomez Escorcia L, Fernández-Ponce C, Rebolledo Cobos M, Fandiño Moreno J, Fiorillo-Moreno O, Navarro Quiroz E. Navarro Quiroz R, et al. Front Immunol. 2025 Jul 21;16:1563992. doi: 10.3389/fimmu.2025.1563992. eCollection 2025. Front Immunol. 2025. PMID: 40761781 Free PMC article. Review.

References

    1. Long, H. K., Prescott, S. L. & Wysocka, J. Ever-changing landscapes: transcriptional enhancers in development and evolution. Cell167, 1170–1187 (2016). - PMC - PubMed
    1. Cramer, P. Organization and regulation of gene transcription. Nature573, 45–54 (2019). - PubMed
    1. Oudelaar, A. M. & Higgs, D. R. The relationship between genome structure and function. Nat. Rev. Genet.22, 154–168 (2021). - PubMed
    1. Furlong, E. E. M. & Levine, M. Developmental enhancers and chromosome topology. Science361, 1341–1345 (2018). - PMC - PubMed
    1. Symmons, O. et al. Functional and topological characteristics of mammalian regulatory domains. Genome Res.24, 390–400 (2014). - PMC - PubMed

LinkOut - more resources