. 2025 Jun;44(12):3327-3359.
doi: 10.1038/s44318-025-00441-0. Epub 2025 May 13.

Early coordination of cell migration and cardiac fate determination during mammalian gastrulation

Affiliations

Early coordination of cell migration and cardiac fate determination during mammalian gastrulation

Shayma Abukar et al. EMBO J. 2025 Jun.

Abstract

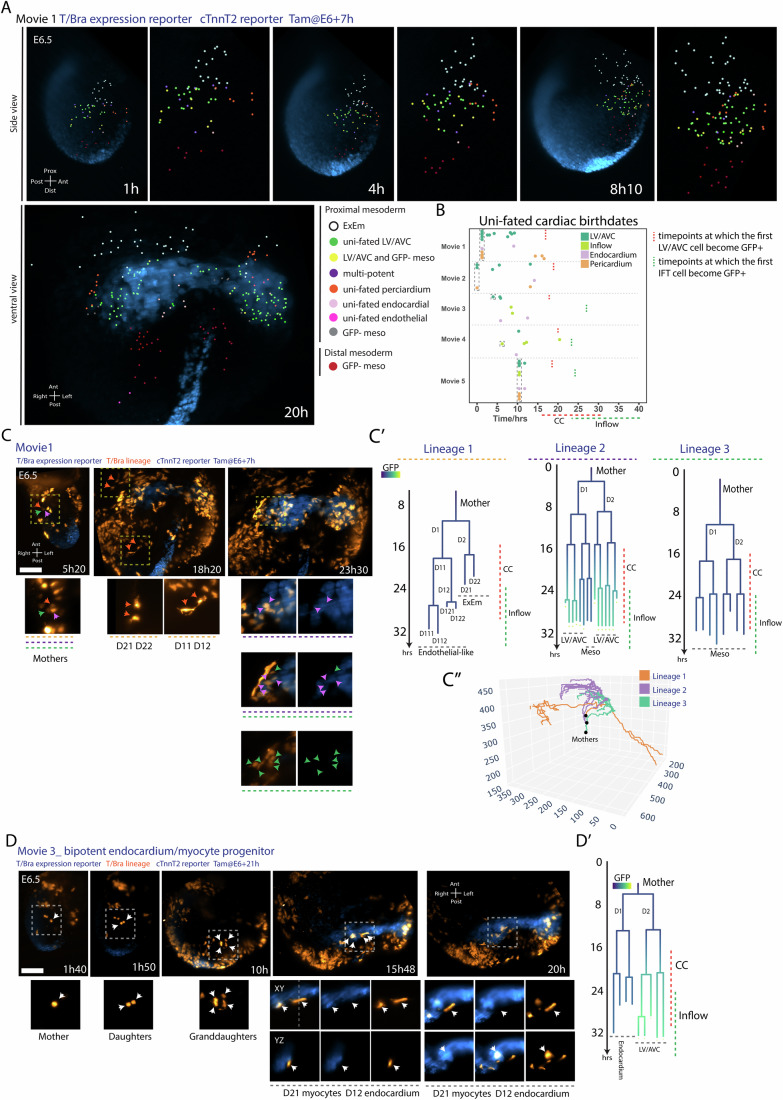
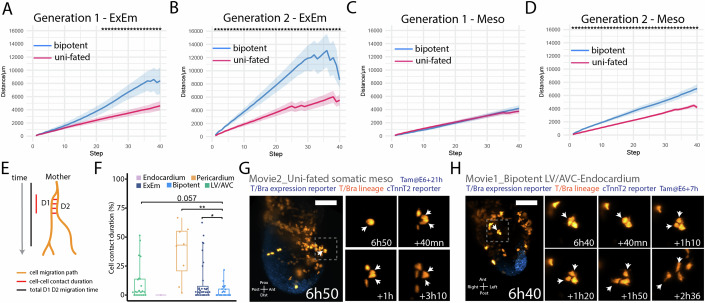
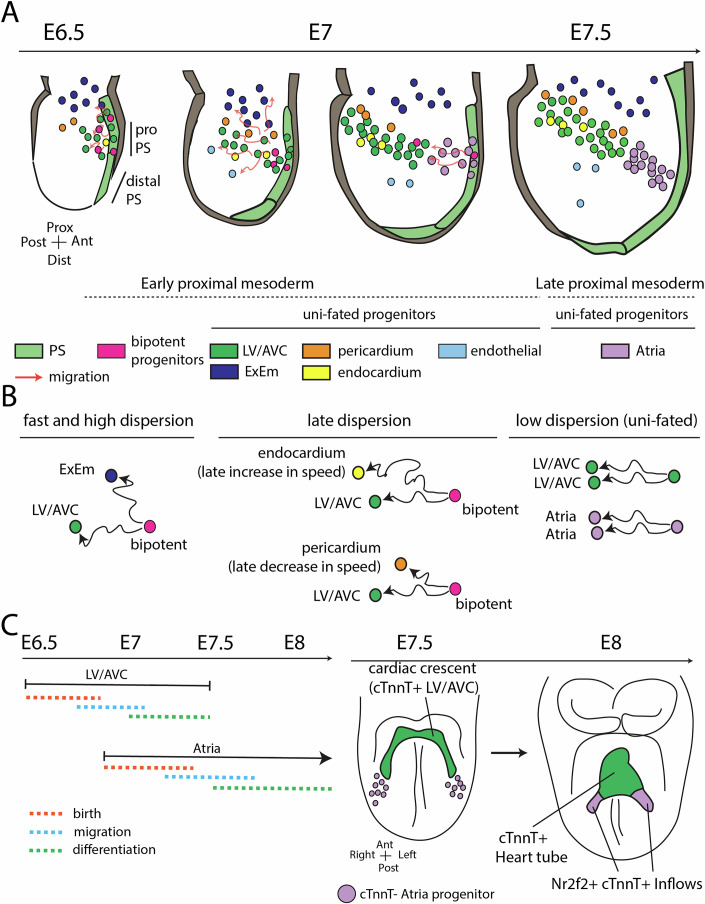
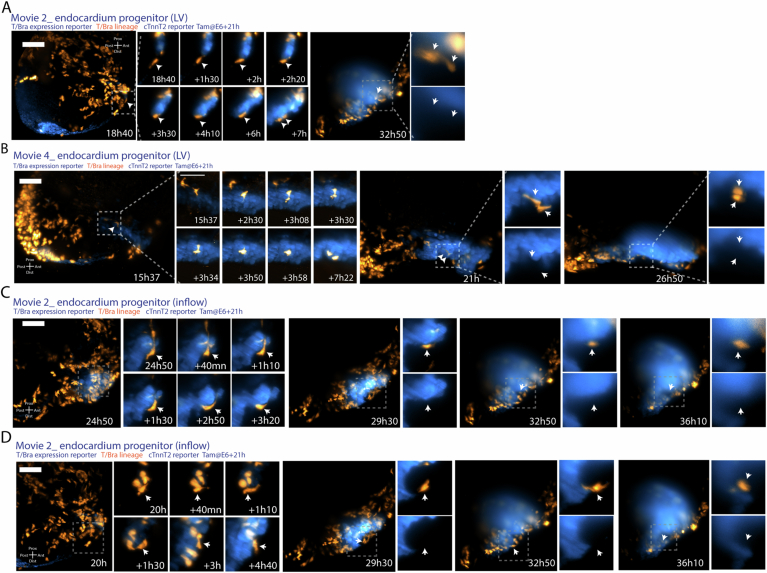
During gastrulation, mesodermal cells derived from distinct regions are destined to acquire specific cardiac fates after undergoing complex migratory movements. Here, we used light-sheet imaging of live mouse embryos between gastrulation and heart tube formation to track mesodermal cells and to reconstruct lineage trees and 3D migration paths for up to five cell divisions. We found independent progenitors emerging at specific times, contributing exclusively to left ventricle/atrioventricular canal (LV/AVC) or atrial myocytes. LV/AVC progenitors differentiated early to form the cardiac crescent, while atrial progenitors later generated the heart tube's Nr2f2+ inflow tract during morphogenesis. We also identified short-lived multipotent progenitors with broad potential, illustrating early developmental plasticity. Descendants of multipotent progenitors displayed greater dispersion and more diverse migratory trajectories within the anterior mesoderm than the progeny of uni-fated progenitors. Progenitors contributing to extraembryonic mesoderm (ExEm) exhibited the fastest and most dispersed migrations. In contrast, those giving rise to endocardial, LV/AVC, and pericardial cells showed a more gradual divergence, with late-stage behavioural shifts: endocardial cells increased in speed, while pericardial cells slowed down in comparison to LV/AVC cells. Together, these data reveal patterns of individual cell directionality and cardiac fate allocation within the seemingly unorganised migratory pattern of mesoderm cells.

Keywords: Cardiac Progenitors; Gastrulation; Heart Fields; Light Sheet Microscopy; Live imaging.


Conflict of interest statement

Disclosure and competing interests statement. The authors declare no competing interests.

Figures

Figure 1
Figure 1. Characterization of the cTnnT-2a-GFP line.
(A) CRISPR-Cas9 strategy to insert a T2a-eGFP cassette into the cTnnT2 gene. (B, C) Immunofluorescence for cTnnT2 in cTnnT-2a-eGFP hearts at E8 (scale: 100 μm) and E12.5 (scale: 200 μm). (D) Multiphoton time-lapse sequence of a TnGPF-CreERT2/+; Bre-cerulean; cTnnT-2a-eGFP embryo (scale: 100 μm). Blue arrows point to cTnnT-2a-eGFP+ cells. IF inflows, HT heart tube, OFT outflow tract, LV left ventricle, RV right ventricle, LA left atrium, RA right atrium, YS yolk sac. Source data are available online for this figure.
Figure 2
Figure 2. Lineage tracing of early cardiac mesoderm.
(A) Tamoxifen administration strategy. (B) TnGPF-CreERT2/+;R26RtdTomato/+; cTnnT-2a-eGFP embryos labelled at E6 + 7 h, E6 + 21 h, and E7 + 7 h, analysed at E8. Scale: 100 μm. (C) Single optical sections from TnGPF-CreERT2/+;R26RtdTomato/+; cTnnT-2a-eGFP embryos labelled at E6 + 7 h, E6 + 21 h, and E7 + 7 h, analysed at E8. Scale: 100 μm. (D) Quantification of tdTomato+ cells (myocardial, endocardial, pericardial) in embryos labelled at E6 + 7 h (n = 3), E6 + 21 h (n = 10), and E7 + 7 h (n = 8). Myocardium: E6 + 7 h vs E6 + 21 h, P value = 0.81. Myocardium: E6 + 21 h vs E7 + 7 h, P value = 0.0061. Myocardium: E6 + 7 h vs E7 + 7 h, P value = 0.014. Endocardium: E6 + 7 h vs E6 + 21 h, P value = 0.55. Endocardium: E6 + 21 h vs E7 + 7 h, P value = 0.029. Endocardium: E6 + 7 h vs E7 + 7 h, P value = 0.24. Pericardium: E6 + 7 h vs E6 + 21 h, P value = 0.8. Pericardium: E6 + 21 h vs E7 + 7 h, P value = 0.0061. Pericardium: E6 + 7 h vs E7 + 7 h, P value = 0.01. Each data points are one embryo. The box boundaries represent the 25th (lower quartile) and 75th (Upper quartile) percentiles, with the centre line indicating the median. The whiskers extend to the minimum and maximum values in the dataset. (E) Embryos labelled at E7 + 7 h, analysed at E8.5. Arrows in (C) and (E) indicate cell types: blue for pericardium, yellow for endocardium, green for endoderm, and red for myocytes. CC cardiac crescent, peri pericardium, ect ectoderm, endoc endocardium, endo endoderm. *P ≤ 0.05, **P ≤ 0.01, ***P ≤ 0.001, ****P ≤ 0.0001. All statistical analyses were performed using the Mann–Whitney U test. Source data are available online for this figure.
Figure 3
Figure 3. Live Analysis of cardiogenesis from gastrulation to heart tube formation.
(A) Schematic of cell tracking showing reporter expression, lineage relationships, and cell trajectories. (B) Example of embryos cultured ex vivo for 30 h. (C) Time-lapse sequences of TnGPF-CreERT2/+;R26RtdTomato/+; cTnnT-2a-eGFP embryos after tamoxifen administration (0.02 mg/g) at the indicated times. Scale bar: 100 μm. (D) Fate mapping of the cardiac crescent. Cells are colour-coded by their final position in the heart tube. Scale bar: 100 μm. (E) HCR in situ hybridization in E7.5-E8 embryos showing expression of HCN4, Nr2f2, and cTnnT, with the inflow region highlighted at E8. Dotted box highlights a Nr2f2/HCN4+ domain. ss somites. Source data are available online for this figure.
Figure 4
Figure 4. Reconstruction of the early mesodermal lineage tree.
Lineage trees of tracked progenitors. Cell types are shown at the endpoints, with GFP-positive descendants indicated by a yellow plus sign. Lineages are colour-coded based on normalized GFP intensities. Dashed lines indicate mother cells that could not be tracked back to their birth. Progenitors not contributing to any LV/AVC myocytes are shown in the bottom panel. cc cardiac crescent. Source data are available online for this figure.
Figure 5
Figure 5. Dispersion analysis of myocardial clones.
(A) (i) Fate maps showing early (green) and late (magenta) mesoderm contributing to cTnnT-2a-GFP+ progenitors. Non-contributing, late progenitors are in white. (ii) Each colour represents a distinct clone. (iii) cTnnT-2a-GFP+ cells are in red, cTnnT-2a-GFP− cells in white. Scale bar: 100 μm. (B, C) Example of myocardial clones dispersed along anteroposterior (AP) and dorsoventral (DV) axes. cTnnT-2a-eGFP-positive cells’ coordinates are mapped onto the AP and DV axes. The spread of each clone was quantified as the proportion of its range (d) along these axes (D). (D) Dispersion along AP and DV axes across movies. Each replicate is a Movie (one embryo). (E) Range of dispersion along the AP and DV axes for each movie. (F) Locations of mesodermal progenitors from left/right nascent mesoderm contributing to cTnnT-2a-GFP+ cells. (G) Schematic of dispersion analysis in lineages. (H) Comparison of cell-cell dispersion for cTnnT-2a-GFP+ myocytes at migration’s end (defined by the mean LV/AVC differentiation time in each movie) and during heart tube formation (41.4 µm ± 31.9 (SD), n = 293 at the end of the migration period; 45.1 µm ± 34.7 (SD), n = 597, after heart tube formation (P = 0.22). HT heart tube, meso mesoderm, A anterior, P Posterior. All statistical analyses were performed using the Mann–Whitney U test. For all boxplots, the box boundaries represent the 25th (lower quartile) and 75th (upper quartile) percentiles, with the centre line indicating the median. The whiskers extend to the minimum and maximum values in the dataset. Source data are available online for this figure.
Figure 6
Figure 6. LV/AVC and Inflow progenitors birthdate and timing of differentiation.
(A, B) Time-lapse images and lineage trees of LV/AVC (AA’) and inflow (BB’) progenitors, coloured by normalized GFP intensity. White arrows (A, B) show the cells analysed in the lineage tree (A’B’). Scale bars: 100 μm. (C) Time points at which LV/AVC and inflow progenitors exceed the GFP intensity threshold. Each replicate is a Movie (one embryo). Movie 1: LV vs Atria, P value = 2.8e-06. Movie 3: LV vs Atria, P value = 8.4e-07. Movie 4: LV vs Atria, P value = 0.0027. Movie 5: LV vs Atria, P value = 5e-14. (D) Birth dates of progenitors contributing to cTnnT-2a-GFP + LV/AVC and inflow myocytes. Each replicate is a Movie (one embryo). (E) Time between the first and last progenitor becoming cTnnT-2a-GFP+ in myocyte lineages. Each replicate is a Movie (one embryo). Statistical analyses: Mann–Whitney U test. *P ≤ 0.05, **P ≤ 0.01, ***P ≤ 0.001, ****P ≤ 0.0001. All statistical analyses were performed using the Mann–Whitney U test. For all boxplots, the box boundaries represent the 25th (lower quartile) and 75th (upper quartile) percentiles, with the centre line indicating the median. The whiskers extend to the minimum and maximum values in the dataset. Source data are available online for this figure.
Figure 7
Figure 7. Fate mapping of cardiac progenitors at the gastrula stage.
(A) Cells are colour-coded by fate. (B) Birth dates of uni-fated progenitors for LV/AVC and inflow myocytes, endocardium, and pericardium. Cells present at the start of the movie are highlighted in a grey-dotted box. (C) Time-lapse sequences of TnGPF-CreERT2/+;R26RtdTomato/+; cTnnT-2a-eGFP embryos showing three nearby progenitors contributing to extraembryonic mesoderm (ExEm), endothelial-like cells, LV/AVC, and undefined mesodermal fates. Corresponding lineage trees are colour-coded by normalized GFP intensity (C’), with arrows indicating tracked cells. (C”) 3D trajectories of the three lineages. Scale bar: 100 μm. (D) Time-lapse of TnGPF-CreERT2/+;R26RtdTomato/+; cTnnT-2a-eGFP embryos showing a bipotent endocardial/myocardium progenitor. Corresponding lineage trees are colour-coded by normalized GFP intensity (D’), with arrows indicating tracked cells. Scale bar: 100 μm. Source data are available online for this figure.
Figure 8
Figure 8. Cell migration analysis in lineages.
(A) Dispersion analysis over time shows the distances between all daughters and granddaughters in all the cardiac lineages at time points T0, T1, and T2. T0 vs T1, P value = 1.5e-05. T1 vs T2, P value = 0.071. Data are from the 5 datasets (Movies EV1–5). (B) Hypothesis schematic: random migration predicts equal dispersion for uni-fated and bipotent progenitors; heterogeneous trajectories predict less dispersion for uni-fated progenitors. “Midpoint distance” is the Euclidean distance between the midpoints of D1’s and D2’s daughters. Homotypic and heterotypic distances are between cells of the same or different fate. (C, D) Dispersion analysis comparing homotypic and heterotypic distances in lineages with (C) and without (D) ExEm cells at T0, T1, and T2. The scores are presented on a logarithmic scale for better visualization of differences across categories. (C) T0: Homo vs Het, P value = 0.72. T1: Homo vs Het, P value = 0.99. T2: Homo vs Het, P value = 0.99. (D) T0: Homo vs Het, P value = 0.72. T1: Homo vs Het, P value = 0.052. T2: Homo vs Het, P value = 1.9e-06. Data are from the five datasets (Movies EV1–5). (E) Dynamic time warping (DTW) quantifies similarities between two migration paths. (F, G) DTW scores comparing D1 and D2 sister tracks up to their next division (F) and for 2nd generation descendant tracks (sisters [D11–D12, D21–D22] and cousins [D11–D21, D11–D22]) (G) under the following conditions: Uni: Both daughters adopt the same cardiac fate. UniExEm: Both daughters adopt the same ExEm fate. Bi: Daughters adopt distinct fates, with none contributing to the ExEm. BiExEm: Daughters adopt distinct fates, with at least one contributing to the ExEm. The scores are presented on a logarithmic scale for better visualization of differences across categories. (F) Uni vs Bi, P value = 0.15. Uni vs UniExEm, P value = 0.2. BiExEm -Bi, P value = 0.024. UniExEm-BiExEm, P value = 0.032. (G) Uni vs Bi, P value = 0.0052. Uni vs UniExEm, P value = 0.021. BiExEm-Bi, P value = 2.1e-06. UniExEm-BiExEm, P value = 1e-04. Results were statistically analysed using a Mann–Whitney test. Data are from the five datasets (Movies EV1–5). (HK) Examples of trajectories and corresponding midpoint distances (H’-K) and lineage trees (H”-K”). Red dots in H’-K’ mark sampling points for midpoint analysis. All statistical analyses were performed using the Mann–Whitney U test. *P ≤ 0.05, **P ≤ 0.01, ***P ≤ 0.001, ****P ≤ 0.0001. For all boxplots, the box boundaries represent the 25th (lower quartile) and 75th (upper quartile) percentiles, with the centre line indicating the median. The whiskers extend to the minimum and maximum values in the dataset. Source data are available online for this figure.
Figure 9
Figure 9. Sister cells sharing the same cardiac fate sustain cell-cell interactions.
(AD) Mean DTW values over time for D1, D2 (generation 1) and D11, D12, D21, D22 (generation 2) daughters from uni-fated and bipotent progenitors, with ExEm cell contribution (A, B) or without (C, D). Shaded areas indicate SE; significant differences for each step are marked with a star. (E) Cell-cell contact duration analysis: ratio of contact time to track duration within the first 16 h. Short tracks ( < 4 h) excluded. (F) Proportion of time sister cells with similar or distinct fates remain in contact. LV vs Bi, P value = 0.057. Pericardium vs Bi, P value = 0.0048. ExEm vs Bi, P value = 0.025. Data are from the five datasets (Movies EV1–5). (G, H) Time-lapse images of uni-fated pericardial (G) and bipotent LVAVC/Endocardium (H) progenitors. White arrows show daughter cells retaining cell-cell contact (G) or showing separating movements following division (H). Scale bar: 100 μm. *P ≤ 0.05, **P ≤ 0.01, ***P ≤ 0.001, ****P ≤ 0.0001. All statistical analyses were performed using the Mann–Whitney U test. For all boxplots, the box boundaries represent the 25th (lower quartile) and 75th (upper quartile) percentiles, with the centre line indicating the median. The whiskers extend to the minimum and maximum values in the dataset. Source data are available online for this figure.
Figure 10
Figure 10. Cardiac mesodermal cells speed and dispersion analysis.
(A) Diagram of dispersion analysis for sister and cousin cell distances with similar fates. (B, C) Cell dispersion at migration end (B) and during heart tube formation (C). Data are from the five datasets (Movies EV1–5). (B) Atria vs LV, P value = 0.00016. LV vs Pericardium, P value = 0.98. LV vs Endocardium, P value = 0.44. LV vs ExEm, P value = 1.5e-11. Pericardium vs Endocardium, P value = 0.47. Pericardium vs ExEm, P value = 0.00011. Endocardium vs ExEm, P value = 0.035. (C) Atria vs LV, P value = 1.9e-05. LV vs Pericardium, P value = 0.54. LV vs Endocardium, P value = 0.013. LV vs ExEm, P value = 1.4e-11. Pericardium vs Endocardium, P value = 0.039. Pericardium vs ExEm, P value = 0.00017. Endocardium vs ExEm, P value = 0.94. Data are from the 5 datasets (Movies EV1–5). (D) (i–ii) Endocardial clones, each in a different colour. (iii) Endocardial cells highlighted in red. (E) Mean cell speeds per fate calculated across 5-h intervals. (F) Time-lapse images of endocardial progenitor (indicated by a white arrow) and non-endocardial progenitors (indicated by yellow, blue and green arrows). Scale bar: 100 μm. (G) Cell speeds per fate were calculated across 5-h time periods. Movies were temporarily aligned as shown in Fig. 5B. Data are from the five datasets (Movies EV1–5). ExEm: 0–5 h vs 5–10 h, P value = 0.16. 5–10 h vs 10–15 h, P value = 2.9e-06. 10–15 h vs 15–20 h, P value = 8.4e-05. 15–20 h vs 20–25 h, P value = 0.045. LV/AVC: 0–5 h vs 5–10 h, P value = 0.0012. 5–10 h vs 10–15 h, P value = 0.00075. 10–15 h vs 15–20 h, P value = 0.13. 15–20 h vs 20–25 h, P value = 3e-08. Pericardium: 0–5 h vs 5–10 h, P value = 0.091. 5–10 h vs 10–15 h, P value = 0.079. 10–15 h vs 15–20 h, P value = 0.24. 15–20 h vs 20–25 h, P value = 0.014. Bi: 0–5 h vs 5–10 h, P value = 0.0017. 5–10 h vs 10–15 h, P value = 0.065. 10–15 h vs 15–20 h, N/A. *P ≤ 0.05, **P ≤ 0.01, ***P ≤ 0.001, ****P ≤ 0.0001. All statistical analyses were performed using the Mann–Whitney U test. For all boxplots, the box boundaries represent the 25th (lower quartile) and 75th (upper quartile) percentiles, with the centre line indicating the median. The whiskers extend to the minimum and maximum values in the dataset. Source data are available online for this figure.
Figure 11
Figure 11. Cardiac mesodermal cell behaviours analysis.
(AC) Time-lapse images of endocardial (A), uni-fated pericardial (B), and ExEm (C) progenitors. Corresponding lineage trees, coloured by GFP intensity, in (A’, B’, C’) and 3D speed plots in (A”, B”, C”). White arrows in (AC) indicate cells in lineage trees (A’, B’, C’). Scale bar: 100 μm. (DD’) Tortuosity analysis comparing ExEm and pericardial cells during heart tube formation stages (corresponding to the 25–42 h interval in Fig. 5B). Data are from the 5 datasets (Movies EV1–5). LV vs Pericardium = P value = 3.7e-05. LV vs ExEm, P value < 2.22e-16. Pericardium vs ExEm, P value = 0.0031. LV/AVC left ventricle/atrioventricular canal, HT heart tube. *P ≤ 0.05, **P ≤ 0.01, ***P ≤ 0.001, ****P ≤ 0.0001. All statistical analyses were performed using the Mann–Whitney U test. For all boxplots, the box boundaries represent the 25th (lower quartile) and 75th (upper quartile) percentiles, with the centre line indicating the median. The whiskers extend to the minimum and maximum values in the dataset. Source data are available online for this figure.
Figure 12
Figure 12. Summary model of early heart development.
(A) Cells located in the early proximal mesoderm contribute to the ExEm, LV/AVC myocardium, endocardium, and pericardium in unequal proportions, with the majority of progenitors giving rise to the LV/AVC myocardium. Bipotent progenitors contributing to all four cell types are initially present. The late proximal mesoderm contributes to the atrial/inflow myocardium. (B) Bipotent progenitors contributing to the ExEm exhibit the fastest and most dispersed migrations. In contrast, those giving rise to the endocardium, LV/AVC, and pericardium follow a more gradual divergence. Unipotent progenitors show more directed migration patterns. (C) LV/AVC progenitors differentiate early to form the cardiac crescent, while atrial progenitors later contribute to the formation of the heart tube’s Nr2f2+ inflow tract during morphogenesis. ExEm Extraembryonic mesoderm, LV left ventricle, AVC atrioventricular canal, PS primitive streak, Prox proximal, Dist distal, Ant anterior, Post posterior.
Figure EV1
Figure EV1. Stage variation of the embryos imaged by light-sheet microscopy.
(AA’) At T0, the embryos in Movies EV1 and 2 are at earlier stages compared to those in Movies 3 to 5. Embryos in Movies EV3–5 at T0 are characterized by the presence of a node structure (highlighted by an asterisk in (A)) and the beginning of the notochord plate (highlighted by the red dotted line in (A’)). In contrast, the node and notochord are absent in embryos from Movies EV1 and 2 at T0. (B) The earlier MS-LS embryos have a lower nGFP primitive streak signal compared to the later-stage OB-LB embryos. Images adapted from Ivanovitch et al, . (C) Quantification of nGFP primitive streak signal at T0 for embryos from Movies EV1–5. nGFP was quantified in four consecutive optical sections (see also Appendix Fig. S6). Each data point represents the mean GFP intensity for each z-slices. PS: primitive streak. Scale bar: 200 μm in (A) and 100 μm in (A’). MS-LS: mid and late streak stages. OB/LB: no bud to late bud stages. nGFP: nuclear GFP. Source data are available online for this figure.
Figure EV2
Figure EV2. Independent progenitors contribute to the LV/AVC and Atria.
(AD) Only progenitors contributing at least one cTnnT-2a-GFP+ cell are displayed. (i) Fate map showing early (green) and late (magenta) mesoderm contributions to heart tube regions (early/late classification is arbitrary). (ii) Each colour represents a unique clone. (iii) cTnnT-2a-GFP+ cells in red. Scale bar: 100 μm.
Figure EV3
Figure EV3. Examples of bipotent and tripotent mesodermal progenitors.
(AC) Time-lapse images of TnGPF-CreERT2/+;R26RtdTomato/+; cTnnT-2a-eGFP embryos showing bipotent (A, B) and tripotent (C) progenitors. Corresponding lineage trees, coloured by normalized GFP intensity, are shown in (A’C’), with arrows indicating the cells in (AC). Scale bar: 100 μm. Source data are available online for this figure.
Figure EV4
Figure EV4. Mesodermal migration paths.
Examples of trajectories (AJ) and corresponding midpoint distances (A’J’) and lineage trees (A”J”). Red lines mark sampling points for midpoint analysis. LV/AVC left ventricle and atrioventricular canal, ExEm Extraembryonic mesoderm. Source data are available online for this figure.
Figure EV5
Figure EV5. Endocardial cell behaviour.
(AD) Image sequences from time-lapse movies of TnGPF-CreERT2/+;R26RtdTomato/+; cTnnT-2a-eGFP embryos showing endocardial progenitors in the LV (A, B) and in the inflows (C, D). White arrows in (AD) show endocardial cells. LV left ventricle. Scale bar: 100 μm.

Similar articles

References

    1. Aanhaanen WT, Brons JF, Dominguez JN, Rana MS, Norden J, Airik R, Wakker V, de Gier-de Vries C, Brown NA, Kispert A et al (2009) The Tbx2+ primary myocardium of the atrioventricular canal forms the atrioventricular node and the base of the left ventricle. Circ Res 104:1267–1274 - PubMed
    1. Bardot E, Calderon D, Santoriello F, Han S, Cheung K, Jadhav B, Burtscher I, Artap S, Jain R, Epstein J et al (2017) Foxa2 identifies a cardiac progenitor population with ventricular differentiation potential. Nat Commun 8:14428 - PMC - PubMed
    1. Bragantini J, Theodoro I, Zhao X, Huijben TA, Hirata-Miyasaki E, Vijay Kumar S, Balasubramanian A, Lao T, Agrawal R, Xiao S, Lammerding J, Mehta S, Falcão AX, Jacobo A, Lange M, Royer LA (2024) Ultrack: pushing the limits of cell tracking across biological scales. Preprint at https://www.biorxiv.org/content/10.1101/2024.09.02.610652v1 - DOI
    1. Chiba HSS (1978) Dynamic programming algorithm optimization for spoken word recognition. IEEE Trans Acoust Speech Signal Process 26:43–49
    1. Christiaen L, Davidson B, Kawashima T, Powell W, Nolla H, Vranizan K, Levine M (2008) The transcription/migration interface in heart precursors of Ciona intestinalis. Science 320:1349–1352 - PubMed

LinkOut - more resources