. 2025 May 13;8(1):742.
doi: 10.1038/s42003-025-07943-x.

Identification of druggable binding sites and small molecules as modulators of TMC1

Affiliations

Identification of druggable binding sites and small molecules as modulators of TMC1

Pedro De-la-Torre et al. Commun Biol. .

Abstract

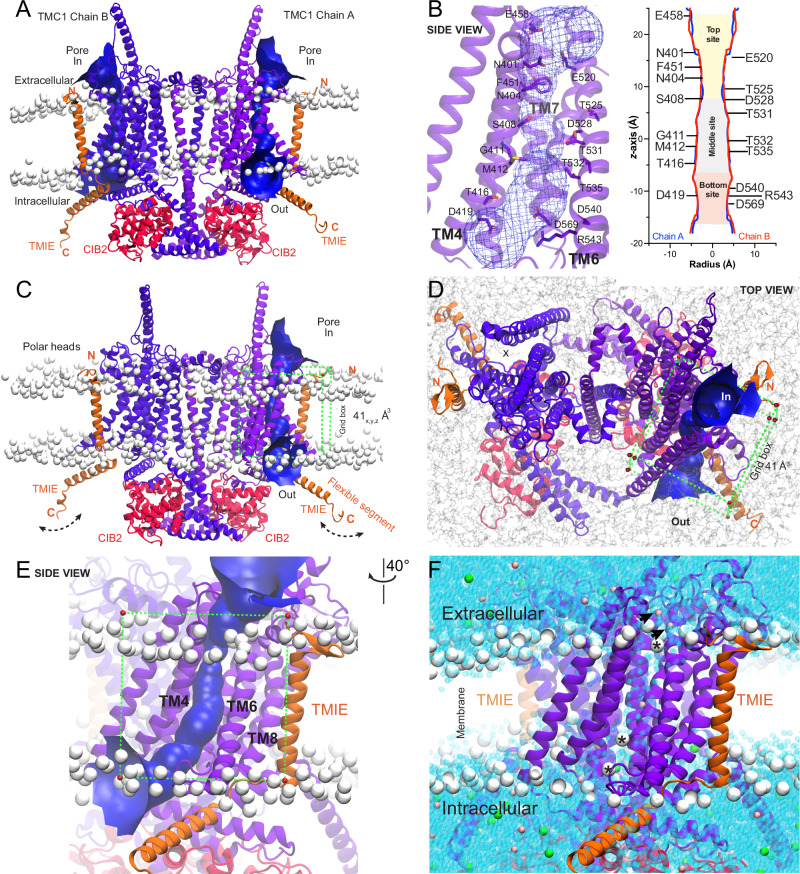
Our ability to hear and maintain balance relies on the proper functioning of inner ear sensory hair cells, which translate mechanical stimuli into electrical signals via mechano-electrical transducer (MET) channels, composed of TMC1/2 proteins. However, the therapeutic use of ototoxic drugs, such as aminoglycosides and cisplatin, which can enter hair cells through MET channels, often leads to profound auditory and vestibular dysfunction. To date, our understanding of how small-molecule modulators interact with TMCs remains limited, hampering the discovery of novel drugs. Here, we propose a structure-based drug screening approach, integrating 3D-pharmacophore modeling, molecular dynamics simulations of the TMC1 + CIB2 + TMIE complex, and experimental validation. Our pipeline successfully identified three potential drug-binding sites within the TMC1 pore, phospholipids, and key amino acids involved in the binding of several compounds, as well as FDA-approved drugs that reduced dye uptake in cultured cochlear explants. Our pipeline offers a broad application for discovering modulators for mechanosensitive ion channels.


Conflict of interest statement

Competing interests: The authors declare no competing interests.

Figures

Fig. 1
Fig. 1. Structural diversity of known MET blockers.
Compounds reported to display varied MET channel blocker potencies and AG protection (see Supplementary Table 1). These compounds share a protonatable nitrogen atom and at least one aromatic ring in their structures. Potential protonatable nitrogen atoms are marked with a blue plus (+) sign. Front view of our dimeric TMC1 model (purple) in complex with two protomers of TMIE (orange) and two protomers of CIB2 (red) proteins. Heads of phospholipids are showed as white beads. Arrows represent the entry site of small molecules via the pores in both TMC1 protomers calculated by HOLE (blue). More details about this model are presented in Fig. 2 and in the Methods section.
Fig. 2
Fig. 2. TMC1 modeling and molecular dynamics simulations.
We built a dimeric open-like conformation of the TMC1 structure using AlphaFold2. A Front view of a 25 ns frame of the dimeric, equilibrated TMC1 protein in complex with two protomers of TMIE (orange) and two protomers of CIB2 (red) proteins. The system is embedded in a POPC membrane, with the phosphorus of the phospholipids heads illustrated as white beads. The TMC1 pores of chain A and B are represented by a blue funnel obtained by HOLE analysis. B Detailed view of the TMC1 pore of chain A, depicting the pore in a mesh representation, and amino acids as purple sticks. The inset depicts the van der Waals radius (Å) of the pore plotted against the distance (Å) along the pore of both TMC1 chains (z-axis), obtained by HOLE analysis. Top (gold), middle (light gray), and bottom (light red) sites of the pore are labeled and color-coded according to the most expanded regions of the pore. The zero (0 Å) at the z-axis represents the reference position of the middle site of the TMC1 pore at the center of the plasma membrane. See Supplementary Fig. 2 for additional details and quantitative analysis. C Front view of the complex as in (A). The flexible TMIE C-terminal segment is labeled (see Supplementary Fig. 2). A 41 Å3 docking grid box is represented by green dashed lines with vertices in red circles. D Top view of the simulated system showing the swapped TMC1 conformation with two pores represented by a blue surface (chain A) and a dashed circle with an X (chain B), respectively. Same grid box as in (C). E Zoomed-in side view of chain A from c showing the grid box and TM domains forming the pore. F Zoomed-in side view of the MET complex showing water molecules filling the pore (blue beads). K+ ions are illustrated as pink beads, while Cl ions as green beads. K+ ions visiting the pore are pointed with black arrows. Phospholipids that moved into the pore are indicated by asterisks (see Supplementary Fig. 5).
Fig. 3
Fig. 3. Pharmacophore modeling of 13 known MET channel blockers.
A The APRR four-point pharmacophore model of MET channel modulators show a hydrogen-bond acceptor feature (A) in red, two aromatic rings (R1 and R2) in orange, and a positively charged group (P) in blue. Distances and angles between the pharmacophoric features are labeled. This model showed the highest PhaseHypoScore (APRR = 0.780) matching 7 out of 13 matching blockers. BH A 2D-representation of the APRR pharmacophore model with matching compounds. I Superposed 3D-structures of the MET blockers phenoxybenzamine (purple) and carvedilol derivative 13 (pink) onto the APRR pharmacophore. These two compounds fit all 10 pharmacophores reported in Table 1 (see also Supplementary Table 2).
Fig. 4
Fig. 4. Molecular docking of known blockers within the TMC1 pore cavity.
Side view surface representation of TMC1 chain A pore (light purple). TMIE is shown as an orange surface, while CIB2 is not displayed for clarity. A Surface electrostatic potential (calculated by PyMOL) of TMC1 cavity. Electronegative area is highlighted in red, electropositive in blue, and hydrophobic in white. The cavity of TMC1 is highly electronegative with a cation pathway indicated by the blue arrow. B TMC1 pore cavity highlighting 3 ligand-binding sites: top (gold), middle (light gray), and bottom (light red) sites of the pore, color-coded for illustration purposes. Binding at these sites is governed by interactions between the positively charged amine group of the ligands with residues E458 and F451 (top site), D528 (middle site), and D569 (bottom site), as well as hydrophobic and hydrogen bond interactions with other residues within the TMC1 pore cavity. C Side view, similar to (B), showing the location of two key phospholipids (POPC-A and POPC-B) identified during MD simulations. The polar head of POPC-A points towards the site forming a zwitterionic-like interaction network near D569, key for ligand binding. Additionally, the polar head of POPC-B forms a similar zwitterionic-like network with R523 at the top site (see also Fig. 6 and Supplementary Fig. 5). D Binding interaction of FM1-43 (green) across the top, middle, and near the bottom sites of the pore. E Binding interaction of benzamil (brown) at the bottom site of the pore. Dashed white line represents a hydrogen bond interaction with D569. F Binding interaction of tubocurarine (yellow) at the middle and the bottom sites of the pore. Dashed white line as in (E). GI Top views of FM1-43, benzamil, and tubocurarine showing the location of the ligands and the phospholipid sidewall formed by POPC-A and POPC-B surrounding the ligands. Additional illustrations on interactions are presented in Fig. 6 and Supplementary Fig. 5.
Fig. 5
Fig. 5. Molecular docking simulations of known and novel TMC1 blockers.
Cartoon representation and binding modes of blockers. A FM1-43 (green) within the cavity of TMC1 (light purple). B Benzamil (brown). C Tubocurarine (yellow). D Posaconazole (dark purple). E Compound ZINC24739924 (green). F Cepharanthine (magenta). GI Bottom view of the ZN3 bottom site with benzamil, tubocurarine, and compound ZINC24739924, respectively. Residues are labeled in black and gray for their position at the front or at the back of each helix, respectively. The side chains and the backbone residues are colored as in Fig. 4, according to their location within the top (gold), middle (light gray), and bottom (light red) sites of the TMC1 pore. Residues within 5 Å distance from each blocker are displayed, and key interactions highlighted with black dashed lines. Additional illustrations on interactions are presented in Supplementary Fig. 5.
Fig. 6
Fig. 6. Molecular docking of dihydrostreptomycin (DHS) within the TMC1 pore.
Binding interactions following molecular docking and MM-GBSA. Phospholipids are not displayed in some panels to visualize DHS and TMC1 only. Each positively charged nitrogen is shown as a blue bead. Dashed lines represent direct hydrogen bonds or salt-bridge interactions. A Top view of DHS (2+) showing the location of the ligand and the phospholipid sidewall formed by POPC-A and POPC-B surrounding the ligand. B Side view of DHS (2+) within the TMC1 pore, showing the top site (gold), middle site (light gray), and bottom (light red) sites. Phospholipids are not displayed for clarity. Binding at these sites is governed by interactions between the positively charged amine and guanidinium groups, as well as the hydroxyl groups of DHS (2+) with amino acids in the middle and bottom sites. C Docking pose of DHA (2+) showing hydrogen bonds between the N-methyl-L-glucosamine head and the amino acids S408 and D528. The streptose moiety points towards TM7, while the guanidinium groups of the streptidine moiety displayed hydrogen bond interactions with N573 and salt bridges with D540. One of the guanidinium groups points to D569 in a solvent-exposed region (more details in (D)). D Bottom view from (C), showing interactions between DHS (2+), TMC1, and POPC-A within the bottom site of the pore cavity. One guanidinium group displayed interactions with N573 and D540 (as in (C)), while the second guanidinium group showed interactions with the polar head of POPC-A. E Side view of DHS (3+) within the pore showing interactions similar to DHS (2+). Additionally, the hydroxyl group of the streptose moiety formed hydrogen bonds with the carbonyl backbone groups of G411 and G572, while the guanidinium groups formed hydrogen bonds with the carbonyl backbone groups of M412 and E567. F Interactions of DHS (3+) within the pore and with POPC-A.
Fig. 7
Fig. 7. List of final hits selected for experimental evaluation.
A Chemical structures of the 10 selected hits from Library 1 (non-FDA-approved). B Chemical structures of the 10 selected hits from Library 2 (FDA-approved drugs). The calculated MM-GBSA ΔGbind energies are shown for all selected hit compounds in blue (without POPCs) and in red (with POPCs), respectively. Compounds were sketched using ChemDraw.
Fig. 8
Fig. 8. Evaluation of predicted TMC1 modulators in live cochlear hair cells using AM1-43 dye uptake assay.
A Representative confocal microscopy images of AM1-43 dye loading into hair cells from the middle region of the mouse cochlea. The Cellpose algorithm was used to segment each OHC as individual region of interest (top left panel). Dye uptake was reduced by treatment with benzamil (top right) and cepharantine (bottom left) but increased following treatment with Amitraz (bottom right) compared to DMSO-treated controls (top left). Scale bar:  15 µm. B Averaged AM1-43 dye uptake by OHCs in cochlear explants treated with 15 commercially available hit compounds normalized to values obtained from DMSO-treated control explants of the same experimental session. The number of experimental sessions and total number of analyzed cells are indicated within the histogram bar. Data are presented as mean ± SD. To compare the average compound fluorescence with the average control levels from the same experimental sessions, the Kruskal-Wallis test followed by Dunn’s multiple comparison test was used. p > 0.5 (ns); p < 0.01(**); p < 0.001(***). Individual AM1–43 dye loading intensities across each experimental sessions are reported in Supplementary Fig. 8.

Update of

Similar articles

Cited by

References

    1. Angeli, S., Lin, X. & Liu, X. Z. Genetics of hearing and deafness. Anat. Rec.295, 1812–1829 (2012). - PMC - PubMed
    1. Bitner-Glindzicz, M. Hereditary deafness and phenotyping in humans. Br. Med. Bull.63, 73–94 (2002). - PubMed
    1. Cornejo-Sanchez, D. M. et al. Rare-variant association analysis reveals known and new age-related hearing loss genes. Eur. J. Hum. Genet.31, 638–647 (2023). - PMC - PubMed
    1. Eileen, D. Noise and hearing loss: a review. J. Sch. Health77, 225–231 (2007). - PubMed
    1. Kros, C. J. & Steyger, P. S. Aminoglycoside- and cisplatin-induced ototoxicity: mechanisms and otoprotective strategies. Cold Spring Harb. Perspect. Med.9, a033548 (2019). - PMC - PubMed

LinkOut - more resources