. 2025 May;6(5):854-873.
doi: 10.1038/s43018-025-00952-z. Epub 2025 May 13.

CHD1 loss reprograms SREBP2-driven cholesterol synthesis to fuel androgen-responsive growth and castration resistance in SPOP-mutated prostate tumors

Affiliations

CHD1 loss reprograms SREBP2-driven cholesterol synthesis to fuel androgen-responsive growth and castration resistance in SPOP-mutated prostate tumors

Feiyu Chen et al. Nat Cancer. 2025 May.

Abstract

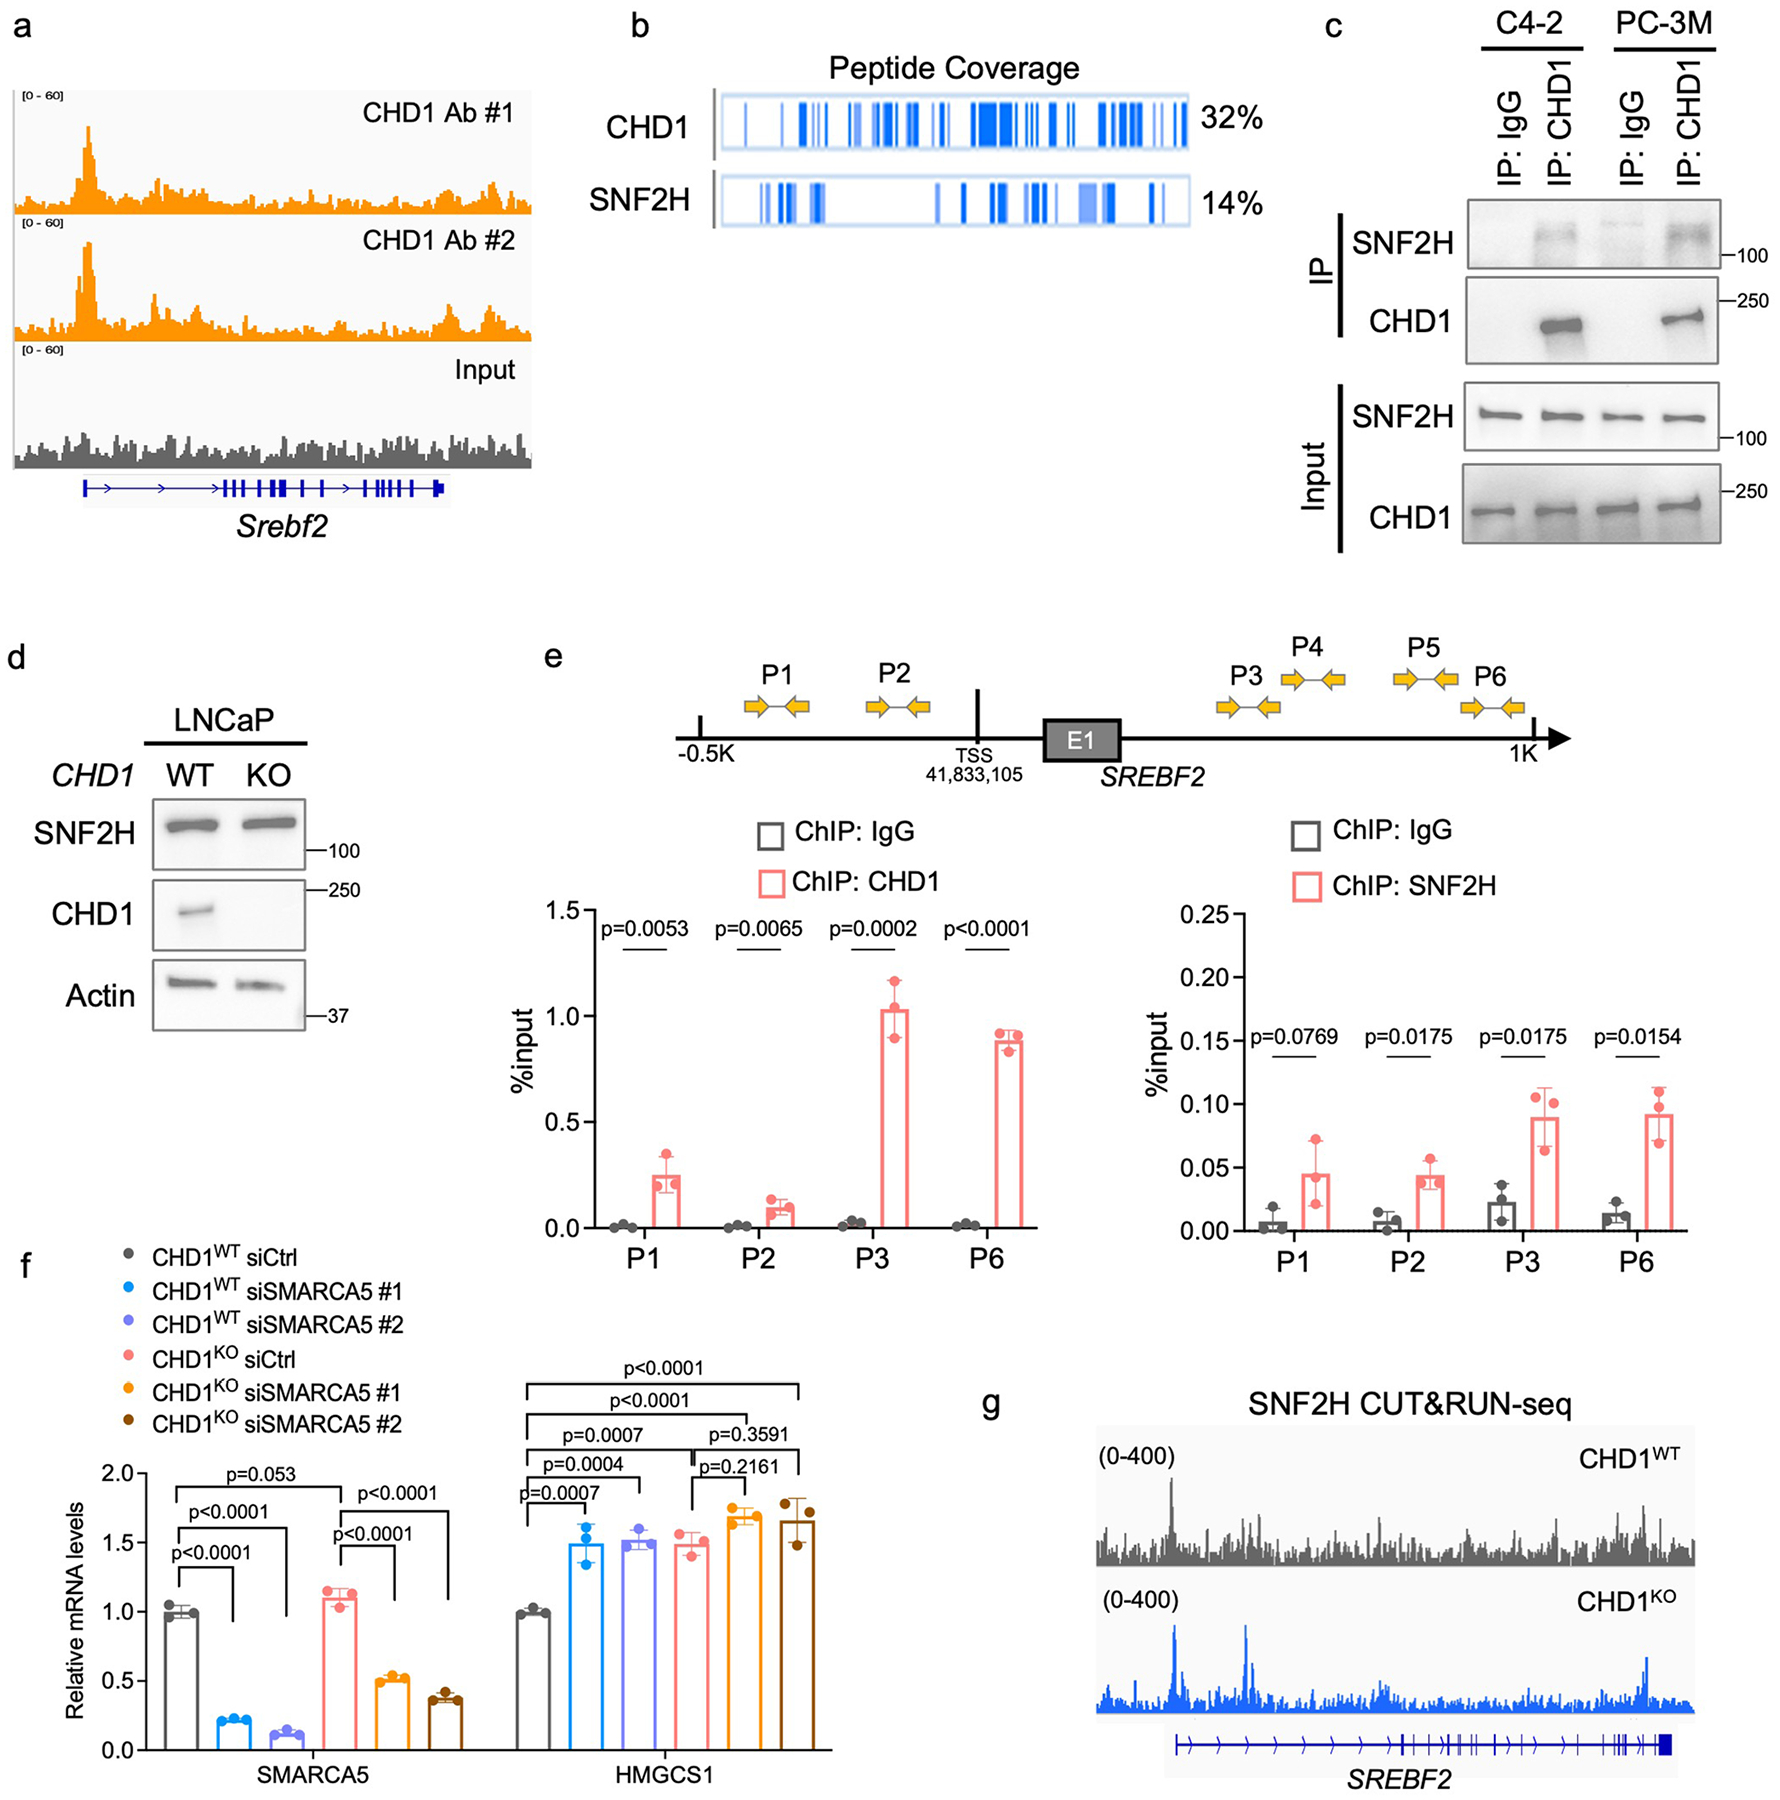
Despite undergoing castration, most individuals with prostate cancer (PCa) experience progression to castration-resistant PCa (CRPC), in which the androgen receptor (AR) remains an important driver. Concurrent genetic alterations in SPOP and CHD1 define a unique subtype of PCa, but their interactions in tumor progression and therapy response remain unclear. Here, we provide genetic evidence supporting that CHD1 loss accelerates disease progression and confers resistance to castration in males with SPOP-mutated PCa. By leveraging genetic engineering and multiomics, we uncovered a noncanonical function of CHD1 in lipid metabolism reprogramming via repressing the SREBP2 transcriptome. Loss of CHD1 induces cholesterol production, supplies intratumoral androgen biosynthesis and enhances AR activity, leading to castration resistance of SPOP-mutated PCa. Combining anti-androgen therapy with cholesterol-lowering drugs showed synergistic and durable activity against CRPC harboring CHD1 loss and SPOP mutations. These findings advance our understanding of an emerging PCa subtype and offer biomarker-driven combinatorial treatment strategies for men with CRPC.


Conflict of interest statement

Competing interests: D.E.F. has received research funding from GTx and has a familial relationship with March Biosciences, Biocity Biopharmaceuticals, Hummingbird Bioscience and Barricade Therapeutics. The other authors declare no competing interests.

Figures

Extended Data Fig. 1 |
Extended Data Fig. 1 |. Combined CHD1Del and SPOPMut Promote Prostate Tumorigenesis.
a, Co-occurrence of CHD1Del and SPOPMut in prostate adenocarcinoma (Log2 Odds Ratio > 3; p < 0.001). Oncoprint was generated from cbioportal. b, Quantification of MRI of prostate tumors from 10-month-old male PC (n = 8 mice), PSp (n = 8 mice), and PCSp (n = 19 mice). c, Histopathology analysis of prostate tumors from PC, PSp, and PCSp male GEMM mice. AP: anterior prostate lobes; VP: ventral prostate lobes; DLP: dorsal and lateral prostate lobes. d, Histopathology analysis revealed the total area of carcinoma region in prostate tumors from male PC (n = 8 mice), PSp (n = 8 mice), and PCSp (n = 6 mice). e, IHC staining (Ser473-phosphorylated AKT; CHD1; Flag; AR and Ki67) of prostate tumors from PC, PSp, and PCSp male GEMM mice at 6 months of age. Representative images are from AP lobes. Scale bar = 50 μm. Data (b) are presented as the mean ± standard deviation. Experiments were performed at least three times with similar results. One-way ANOVA with Tukey’s post hoc tests (b) was performed using GraphPad Prism v.9.2.0.
Extended Data Fig. 2 |
Extended Data Fig. 2 |. CHD1Del confers resistance to castration in SPOPMut PCa.
a-b, Histologic analysis of Ki67 and Cleaved caspase-3 in PCSp prostate tumors with or without surgical castration (n = 3 tumors per group). Tumors that showed response or resistance to castration were compared. Representative images are from anterior prostate (AP) lobes. Cx: Castration. Scale bar = 50 μm. c, Western blot assays of MyC-Cap cells expressing SPOPMut (W131G) with or without Chd1 knockout (KO). Sp, SPOPW131G; CSp, SPOPW131G/Chd1KO. d, Growth curves of Sp and CSp MyC-CaP cells overexpressing vector control (CSp-Vec) or CHD1 (CSp-CHD1) cultured in medium supplied with regular FBS (Normal) or charcoal-stripped FBS (CS). n = 3 biological replicates. e, MYC IHC staining in Sp and CSp MyC-Cap tumors with or without castration. Scale bar = 50 μm. f, Quantification of Ki67 IHC staining in Sp and CSp MyC-Cap tumors with or without castration (n = 3 tumors per group). g, Western blot assays of LNCaP cells expressing SPOP mutation (W131G) with or without Chd1 knockout (KO). Sp, SPOPW131G; CSp, SPOPW131G/CHD1KO. h, Quantification of Ki67 IHC staining in Sp and CSp LNCaP xenograft tumors with or without castration (n = 3 tumors per group). i, Western blot assays of LAPC4 cells expressing SPOP mutants with or without CHD1 depletion. j, Growth curves of SPOPMut LAPC4 cells with or without CHD1 depletion cultured in medium supplied with regular FBS (Normal) or charcoal-stripped FBS (CS) (n = 3 biological replicates per group). Data in b, d, f, h and j are presented as the mean ± standard deviation. Experiments were performed at least three times with similar results. Two-tailed unpaired Student’s t-test (d and j) or one-way ANOVA with Tukey’s post hoc tests (b, f, and h) was performed using GraphPad Prism v.9.2.0.
Extended Data Fig. 3 |
Extended Data Fig. 3 |. CHD1Del retains AR signaling in SPOPMut PCa upon castration.
a, Representative images of GFP+ organoids derived from P and PC GEMMs, cultured with different dosages of DHT for 6 days. Each GFP+ dot indicates an organoids. Scale bar = 2000 μm. b-c, Histopathology analysis of P and PC tumor organoids cultured with or without DHT (n = 3 organoid samples per group). Scale bar = 50 μm. d, Representative images and quantification of AR IHC staining in prostate tumors from PSp and PCSp GEM mice with or without castration (n = 3 tumors). Representative images are from anterior prostate (AP) lobes. Cx: Castration. Scale bar = 50 μm. e, Expression of AR and target genes in P and PC tumor organoids in the absence of DHT, as determined by qPCR (n = 3 biological replicates). f, qPCR analysis of TMPTRSS2 expression in Sp (SPOPW131G) and CSp (SPOPW131G/CHD1KO) MyC-CaP cells cultured in the CS medium (n = 3 biological replicates). g, Western blot assays of LNCaP cells expressing SPOP mutants with or without CHD1 depletion. h, mRNA expression of AR and target genes in LNCaP cells with or without CHD1 knockout, cultured in the CS medium (n = 3 biological replicates). i, V5-tagged CHD1 was overexpressed in CHD1-depleted LNCaP cells, followed by the determination of AR target genes using qPCR (n = 3 biological replicates). j, ChIP-qPCR in control and CHD1 knockout LNCaP cells revealed that CHD1 loss increased AR binding to enhancer regions of PSA and TMPRSS2 genes (n = 3 biological replicates). k, CHD1 expression in 29,861 single epithelial cells from n = 13 mCRPC patients (scRNA-seq dataset, GSE210358). Data (c-f and h-j) presented as the mean ± standard deviation. Experiments were performed at least three times with similar results. Unpaired two-tailed Student’s t-test (e, f, h and j), one-way ANOVA with Tukey’s post hoc test (d and i), or two-way ANOVA (c) with Tukey’s post hoc test were performed using GraphPad Prism v.9.2.0.
Extended Data Fig. 4 |
Extended Data Fig. 4 |. Single-cell transcriptomic profiling of PSp and PCSp GEMMs.
a-e, ScRNA-seq was performed in prostate tumors from PSp and PCSp GEMM mice one month after surgical castration (n = 2 mice per group). a, The UMAP views of 22,943 single cells color-coded by nine major clusters (C1-C9). b, The bubble plot presents marker gene expression for each cluster, where dot size and color represent the percentage of marker gene expression and the averaged scaled expression value, respectively. c, The UMAP view of prostate epithelial cells color-coded by two genotype groups. d, The violin plot of CHD1 gene expression for each subcluster in PSp versus PCSp samples. e, UMAP views of prostate epithelial cells, color-coded by the count of signature genes in indicated pathways. Two-tailed Wilcoxon tests (d) were performed using Bioturing.
Extended Data Fig. 5 |
Extended Data Fig. 5 |. CHD1Del promotes cholesterol biosynthesis and intratumoral androgen production.
a, Heatmap displaying the abundance of all 1013 lipid metabolites in control versus CHD1-depleted LNCaP cells cultured in CS medium. b, Principal Component Analysis (PCA) scores plot for spectral data of lipid metabolites from control and CHD1-depleted LNCaP cells. c, The abundance of each category of lipid metabolites in control versus CHD1-depleted LNCaP cells cultured in CS medium (n = 3 biological replicates). The full name of each lipid metabolite is listed in Supplemental Table 2. d, g, Control and CHD1-depleted LNCaP cells expressing wildtype SPOP or W131G mutant were cultured in CS medium, followed by the determination of cholesterol (d, n = 3 biological replicates) and testosterone (g, n = 6 biological replicates). e, h, MyC-CaP cells expressing SPOPW131G with or without CHD1 depletion were cultured in CS medium. Cells and culture media were collected to determine total cholesterol (e, n = 3 biological replicates) and testosterone (h, n = 3 biological replicates), respectively. f, Total cholesterol and cholesterol esters in P, PC, PSp, and PCSp organoids cultured in the DHT-free medium (n = 3 biological replicates). i, Enrichment of cholesterol metabolism geneset in SPOPMut prostate tumors with or without CHD1Del, determined by Gene Set Enrichment Analysis (GSEA). The normalized Enrichment Score (NES) and False Discovery Rate (FDR) q-value are shown. Data are presented as the mean ± standard deviation. Experiments were performed at least three times with similar results. Two-tailed unpaired Student’s t-test (c, e, g, and h) or one-way ANOVA (d and f) with Tukey’s post hoc tests were performed using GraphPad Prism v.9.2.0.
Extended Data Fig. 6 |
Extended Data Fig. 6 |. CHD1Del promotes cholesterol biosynthesis enzymes by inducing SREBP2 expression.
a-d, qPCR and Western blot analysis of indicated genes in LNCaP cells expressing SPOPMut (W131G or F102C) with or without CHD1 knockout (clone A or C) cultured in normal or charcoal-stripped (CS) medium (n = 3 biological replicates for qPCR assays). e-f, mRNA levels of indicated genes in LAPC4 or Myc-Cap cells expressing SPOPW131G with or without CHD1 depletion (n = 3 biological replicates for qPCR assays). g, mRNA expression of indicated genes in Sp (SPOPW131G) and CSp (SPOPW131G/CHD1KO) LNCaP cells cultured in the normal medium, CS medium, or CS medium supplied with cholesterol (Ch, 30 μM) (n = 3 biological replicates). h, Western blot analysis of SREBP2 in CHD1-depleted LNCap cells upon CHD1 re-expression. i, Expression of CHD1 and SREBF2 in tumors with different CHD1 copy number variation (CNV) (Pan-Cancer TCGA dataset). j, Pearson correlation analysis of CHD1 expression with SREBF2 and its target genes in metastatic PCa containing SPOPMut (n = 13 patients; SU2C/PCF dataset). Data are presented as the mean ± standard deviation. Experiments were performed at least three times with similar results. Two-tailed unpaired Student’s t-test (a, c, e, and f) or one-way ANOVA with Tukey’s post hoc tests (g and i) were performed using GraphPad Prism v.9.2.0.
Extended Data Fig. 7 |
Extended Data Fig. 7 |. Non-canonical function of CHD1 in repressing SREBP2 by interacting with SNF2H/ACF1 complex.
a, ChIP-Seq profile showing the binding of CHD1 to the promoter region of the Srebf2 gene in murine PCa cells. Two antibodies against CHD1 were used for ChIP-seq. b, Peptide coverage of the bait protein (CHD1) and its interacting protein SNF2H, as determined by RIME. Regions shown in blue represent peptides detected by mass spectrometry for each protein. c, Co-IP assays were performed in C4–2 and PC3-M cells using CHD1 antibody, followed by Western blot analysis of CHD1 and SNF2H. d, Western blot analysis of SNF2H in control and CHD1-depleted LNCaP cells. e, ChIP was performed using IgG, CHD1, and SNF2H antibodies in LNCaP cells cultured in CS medium. The binding of CHD1 and SNF2H proteins to the promoter region of the SREBF2 gene was determined using qPCR (n = 3 biological replicates). The locations of primers (P1-P6) in the up- or down-stream of SREBF2’s transcription start site (TSS) and Exon 1 (E1) region are shown. f, Expression of HMGCS1 in control and CHD1-depleted LNCaP cells with or without SNF2H (SMARCA5) knockdown (n = 3 biological replicates). g, CUT&RUN tracks illustrating the binding of SNF2H to the promoter region of the SREBF2 gene in SPOPMut LNCaP cells with or without CHD1 knockout. Data are presented as the mean ± standard deviation. Experiments were performed at least three times with similar results. Two-tailed unpaired Student’s t-test (e) or one-way ANOVA with Tukey’s post hoc tests (f) were performed using GraphPad Prism v.9.2.0.
Extended Data Fig. 8 |
Extended Data Fig. 8 |. SREBP2 is required for intratumoral cholesterol and androgen synthesis driven by CHD1Del.
a-b, SPOPMut LNCaP cells with SREBF2 overexpression were cultured in CS medium for 48 hours, followed by the determination of SREBF2 gene expression (a) and production of total cholesterol and testosterone (b). c, Growth curves of SPOP-mutated LNCaP cells with SREBF2 overexpression cultured in CS medium for 6 days. Data represent the results of triplicates. d-e, Control and CHD1-depleted SPOPMut LNCaP cells were cultured in the CS medium, followed by treatment with Fatostatin (10 μM) for 24 hours. mRNA expression of SREBF2 target genes (d) and AR target genes (e) was determined by qPCR. f, Control and CHD1-depleted SPOPMut LNCaP cells were cultured in CS medium with or without Fatostatin (10 μM) for 6 days. Cell proliferation was determined, and growth curves were presented. g, PSp and PCSp organoids were cultured in the DHT-free medium, followed by treatment of Fatostatin (10 μM) for 6 days. FKBP5 gene expression was determined by qPCR. n = 3 biological replicates in all figures. Data in all figures are presented as the mean ± standard deviation. Experiments were performed at least three times with similar results. Two-tailed unpaired Student’s t-test (a, b, c, and f) or one-way ANOVA with Tukey’s post hoc tests (d, e and g) was performed using GraphPad Prism v.9.2.0.
Extended Data Fig. 9 |
Extended Data Fig. 9 |. Abiraterone synergizes with atorvastatin in suppressing CHD1Del/SPOPMut PCa cells.
a, CHD1-depleted SPOP-mutated LNCaP cells were cultured in the charcoal-stripped (CS) medium, followed by treatment with Abiraterone at different doses for 48 hours. mRNA expression of SREBF2 and its target genes was determined by qPCR (n = 3 biological replicates). b-d, Dose-response matrix and drug interaction landscapes revealing the combination effects of Abiraterone (Abi) and Atorvastatin (Ato) on LNCaP (a,b), MyC-CaP (c), and LAPC4 (d) with or without SPOPW131G and CHD1 deletion. Drug interaction landscapes and synergy scores were generated using Synergyfinder. e, Representative GFP images of P organoids after 6-day treatment of Abiraterone or Atorvastatin, alone or in combination, in the absence of DHT. Scale bar = 2000 μm. f, H&E and IHC staining of indicated markers in P organoids treated with Abiraterone and/or Atorvastatin. Scale bar = 50 μm. g. Quantification of Ki67 (upper), Cleaved caspase-3 (middle), and AR (bottom) IHC staining in P organoids treated with Abiraterone or Atorvastatin, alone or in combination (n = 3 organoid samples per group). Data are presented as the mean ± standard deviation. Experiments were performed at least three times with similar results. One-way ANOVA with Dunnett’s post hoc tests (a) or one-way ANOVA with Tukey’s post hoc tests (g) were performed using GraphPad Prism v.9.2.0.
Extended Data Fig. 10 |
Extended Data Fig. 10 |. Abiraterone combined with cholesterol-lowing drugs shows therapeutic potential in CHD1Del/SPOPMut CRPC.
a, Body weights of male PSp (n = 3 mice) and PCSp (n = 4 mice) were documented throughout the treatment period. b-c, MRI imaging and tumor volume quantification of prostate tumors from male PSp (n = 3 mice) before and after treatment with Abiraterone and Atorvastatin. Prostate tumor regions are circled with orange dashed lines. Cx: Castration. d, H&E and AR staining of prostate tumors from castrated PSp male mice, with and without combination treatment. Scale bar = 100 μm. Experiments were performed at least three times with similar results. Two-tailed paired Student’s t-test (c) was performed using GraphPad Prism v.9.2.0.
Fig. 1 |
Fig. 1 |. Combined CHD1 deletion and SPOP mutation promote prostate tumorigenesis.
a, Co-occurrence of CHD1 deletion and SPOP mutation in prostate adenocarcinoma (log2 (odds ratio) > 3; P < 0.001). The oncoprint was generated from cbioportal. b, Schematics of alleles in Pb-cre; PtenL/L; Chd1L/L; SpopF133V; mTmG (PbPCSpF133V; hereafter PCSp) GEMM mice. c, Representative MRI of prostate tumors from PC (Pb-cre; PtenL/L; Chd1L/L), PSp (Pb-cre; PtenL/L; SpopF133V) and PCSp male mice at 10 months of age. Prostate tumor regions are circled with orange dashed lines. d, Representative images of primary prostate tumors from male PC, PSp and PCSp mice; scale bar, 5 mm. e, Weight of prostate tumors from PC (n = 11), PSp (n = 15) and PCSp (n = 13) mice at 10 months of age. f, Histopathology analysis of prostate tumors from male PC, PSp and PCSp mice at 10 months of age; AP, anterior prostate lobes; scale bar, 4 mm (×0.6 magnification) or 200 μm (×10 magnification). g, Histopathology analysis revealed the percentage of the carcinoma region in prostate tumors from male PC (n = 8), PSp (n = 8) and PCSp (n = 6) mice. h, IHC staining and quantification of Ki67+ cells in prostate tumors from PC (n = 9 tumor views from 3 mice), PSp (n = 9 tumor views from 3 mice) and PCSp (n = 21 tumor views from 5 mice) mice at 10 months of age. Representative images are from anterior prostate lobes; scale bar, 100 μm. Data in e and h are presented as mean ± s.d. Experiments were performed at least three times with similar results. A one-way analysis of variance (ANOVA) with Tukey’s post hoc tests (e and h) was performed using GraphPad Prism v.9.2.0.
Fig. 2 |
Fig. 2 |. CHD1 deletion confers resistance to castration in SPOP-mutant PCa.
a, Surgical castration was performed in 9-month-old male PSp (n = 7) and PCSp (n = 12) mice. MRI was used to monitor prostate tumor growth before and 30 days after castration. The waterfall plot shows the log2 (fold change) in prostate tumor volume before and after castration; FC, fold change. b, Representative MRI of prostate tumors from male PCSp mice before and 1 month after castration. c,d, Histologic analysis of Ki67 and cleaved caspase-3 expression in PSp and PCSp prostate tumors with or without castration (n = 3 tumors per group). Representative images are from dorsal and lateral prostate lobes; Cx, castration; scale bar, 50 μm. e,f, In total, 1 × 10⁶ MyC-CaP cells expressing mutant Spop (W131G) with or without Chd1 knockout (KO) were subcutaneously injected into both flanks of male FVB/NTac mice. After tumors reached ~60 mm3, surgical castration was performed, and tumor sizes were measured twice a week. Tumor growth (e) of Sp-Sham (n = 6 tumors), Sp-Castration (n = 16 tumors), CSp-Sham (n = 13 tumors) and CSp-Castration (n = 14 tumors) groups is presented. The expression of CHD1 and Ki67 (f) in Sp (SpopW131G) and CSp (SpopW131G/Chd1KO) tumors with or without castration was analyzed by IHC; scale bar, 50 μm. g,h, In total, 2 × 10⁶ LNCaP cells expressing mutant SPOP (W131G) with or without CHD1 knockout were subcutaneously injected into both flanks of male SCID mice. After the tumors reached ~100 mm3, surgical castration was performed. Tumor volumes were measured twice a week. Tumor growth (g) of Sp-Sham (n = 9 tumors), Sp-Castration (n = 6 tumors), CSp-Sham (n = 6 tumors) and CSp-Castration (n = 4 tumors) groups is presented. The expression of CHD1 and Ki67 (h) in Sp (SPOPW131G) and CSp (SPOPW131G/CHD1KO) tumors with or without castration was analyzed by IHC; scale bar, 50 μm. Data in d, e and g are presented as mean ± s.d. Experiments were performed at least three times with similar results. A two-tailed unpaired Student’s t-test (a, e and g) or one-way ANOVA with Tukey’s post hoc test (d) was performed using GraphPad Prism v.9.2.0.
Fig. 3 |
Fig. 3 |. CHD1 deletion retains AR signaling in SPOP-mutant PCa following castration.
a, Representative images of GFP+ organoids derived from PSp and PCSp prostate tumors cultured with different dosages of DHT for 6 days. Each GFP+ dot indicates an organoid; scale bar, 2,000 μm. b,c, Histopathology analysis of PSp and PCSp tumor organoids cultured with or without DHT (n = 3 organoid samples per group); scale bar, 50 μm. d,e, Representative images and quantification of AR IHC staining in Sp (SPOPW131G) and CSp (SPOPW131G/CHD1KO) MyC-CaP or LNCaP tumors with or without castration (n = 3 tumors per group); scale bar, 50 μm. f, Expression of AR and target genes in PSp and PCSp tumor organoids in the absence of DHT, as determined by qPCR (n = 3 biological replicates). g,h, LNCaP (g) and LAPC4 (h) cells expressing SPOPW131G with or without CHD1 deletion were cultured in medium supplemented with CS FBS, followed by assessment of AR and target gene expression by qPCR (n = 3 biological replicates). i, In total, 29,861 epithelial cells from a published scRNA-seq dataset (GSE210358) consisting of data from 13 individuals with mCRPC were analyzed. The Circos plot shows the expression of AR target genes in relation to 13 mCRPC samples (GSE210358). Samples expressing low levels of CHD1 are highlighted in blue. j, Bubble plot showing the expression of AR target genes in epithelial cells from 13 individuals with mCRPC ranked by CHD1 expression. Dot size and color represent the percentage of gene expression and the averaged scaled expression value, respectively. Data in ch are presented as mean ± s.d. Experiments were performed at least three times with similar results. An unpaired two-tailed Student’s t-test (fh), one-way ANOVA with Tukey’s post hoc test (d and e) or two-way ANOVA (c) with Tukey’s post hoc test was performed using GraphPad Prism v.9.2.0.
Fig. 4 |
Fig. 4 |. CHD1 deletion promotes cholesterol biosynthesis and intratumoral androgen production.
af, scRNA-seq was performed in prostate tumors from male PSp and PCSp mice 1 month after surgical castration (n = 2 mice per group). In total, 8,974 prostate epithelial cells were analyzed. a, Uniform manifold approximation and projection (UMAP) view of prostate epithelial cells color coded by seven subclusters (C1–C7). b, Violin plot of marker gene expression. c, Composition distribution of seven subclusters among samples. d, Bubble plot of signature pathways in C1–C4 subclusters. Dot size and color represent the percentage of marker gene expression and the averaged scaled expression value, respectively; EMT, epithelial–mesenchymal transition; IFN, interferon; IL-1, interleukin-1. e, UMAP views of prostate epithelial cells color coded by the count of signature genes in the indicated pathways. f, Upregulated Hallmark pathways in PCSp samples. Differentially expressed genes (false discovery rate (FDR) < 0.05) in C1–C4 subclusters in PSp versus PCSp tumors were analyzed using Ingenuity Pathway Analysis. g, Volcano plot of lipid metabolites in control versus CHD1-depleted LNCaP cells cultured in CS medium, as determined by lipidomic profiling. Each dot represents a lipid compound; red dot, cholesterol and cholesteryl ester compounds. Horizontal and vertical dashed lines indicate thresholds of FDR = 0.05 and fold change = 1.5, respectively. h, Heat map displaying the relative abundance of individual cholesterol (Ch) and cholesteryl ester (ChE) metabolites. i, Quantification of total cholesterol (left) and cholesteryl esters (right), as determined by lipidomic profiling (n = 3 biological replicates). j,l, LAPC4 cells expressing SPOPW131G with or without CHD1 depletion were cultured in CS medium. Cells and culture media were collected to determine cholesterol (j) and testosterone (l), respectively (n = 3 biological replicates); conc., concentration; KD, knockdown. k,m, P, PC, PSp and PCSp organoids were cultured in DHT-free medium for 6 days, followed by determination of cholesterol (k; n = 3 biological replicates) and testosterone (m; n = 4 biological replicates). n, UMAP views of 29,861 epithelial cells from human mCRPC samples (GSE210358; n = 13 individuals) color coded by participant (left) or signature gene count in the indicated pathways (right). Individuals with PCa were classified into two groups (CHD1low and CHD1mid/high) based on CHD1 expression in epithelial cells. Data are presented as mean ± s.d. Experiments were performed at least three times with similar results. A Fisher’s exact test (d and f), two-tailed Student’s t-test (g, i, j and l) or one-way ANOVA with Tukey’s post hoc test (k and m) was performed using GraphPad Prism v.9.2.0.
Fig. 5 |
Fig. 5 |. CHD1–SNF2H complex governs the expression of cholesterol biosynthesis genes by repressing SREBF2 expression.
a, Schematics of de novo cholesterol and androgen synthesis pathways and key enzymes; DHEA, dehydroepiandrosterone. b,c, Expression of indicated genes in SPOP-mutant LNCaP cells with or without CHD1 knockout (clone C) cultured in CS medium (b; n = 3 biological replicates) or PSp and PCSp organoids cultured in DHT-free medium (c; n = 3 biological replicates). d,e, IHC staining of SREBP2 in PSp and PCSp GEMM prostate tumors or Sp (SpopW131G) and CSp (SpopW131G/Chd1KO) MyC-CaP tumors after surgical castration; scale bar, 50 μm. Representative images in d are from dorsal and lateral prostate lobes. f, Scatter plot showing 47 CHD1-interacting proteins in PCa cells, as determined by RIME. Both anti-IgG and anti-CHD1 were used for RIME analysis. Horizontal and vertical axes indicate the fold changes in CHD1 RIME versus IgG RIME in replicates 1 and 2 (R1 and R2), respectively. g, Co-IP assays verified the interaction between CHD1 and the SNF2H–ACF1 chromatin remodeling complex. h, CUT&RUN tracks illustrating the binding of CHD1 and SNF2H to the promoter region of the SREBF2 gene in SPOP-mutated LNCaP cells cultured in CS medium. i, ChIP–qPCR was performed using IgG and antibodies to CHD1 and SNF2H in LNCaP cells cultured in CS medium (n = 3 biological replicates). Two primers (P4 and P5) were used to determine their binding to the SREBF2 promoter. j, Venn diagram showing the distribution of unique and shared target genes of CHD1 and SNF2H identified by CUT&RUN-seq. k, Expression of SREBF2 in control and CHD1-depleted LNCaP cells, with or without knockdown of SMARCA5 (the gene encoding SNF2H); n = 3 biological replicates. l, SPOP-mutant LNCaP cells were transfected with SNF2H overexpression plasmid (SNF2H-OE) or vector control, followed by luciferase assay of SREBF2 reporter (SREBF2-Luc); n = 4 biological replicates. Data are presented as mean ± s.d. Experiments were performed at least three times with similar results. A two-tailed unpaired Student’s t-test (b, c and i) or one-way ANOVA with Tukey’s post hoc test (k and l) was performed using GraphPad Prism v.9.2.0.
Fig. 6 |
Fig. 6 |. SREBP2 is required for intratumoral cholesterol and androgen synthesis driven by CHD1 deletion.
ad, SPOP-mutant LNCaP cells with CHD1 knockout and SREBF2 knockdown were cultured in CS medium for 24 h, followed by assessment of SREBF2 target gene expression (a; n = 3 biological replicates), cholesterol levels (b; n = 3 biological replicates), testosterone production (c; n = 3 biological replicates) and AR target gene expression (d; n = 3 biological replicates). e, Growth curves of SPOP-mutant LNCaP cells with CHD1 deletion and/or SREBF2 knockdown cultured in CS medium for 6 days (n = 3 biological replicates). f, Propidium iodide (PI) staining of SPOP-mutant LNCaP cells with CHD1 deletion and/or SREBF2 knockdown cultured in CS medium for 4 days. gi, PSp and PCSp organoids were cultured in DHT-free medium, followed by treatment with fatostatin (10 μM) for 6 days. SREBF2 target gene expression (g; n = 3 biological replicates), cholesterol levels (h; n = 3 biological replicates) and testosterone production (i; n = 6 biological replicates) were determined. Data are presented as mean ± s.d. Experiments were performed at least three times with similar results. A two-tailed unpaired Student’s t-test (e), one-way ANOVA with Tukey’s post hoc test (b, c and gi) or one-way ANOVA with Dunnett’s post hoc test (a and d) was performed using GraphPad Prism v.9.2.0.
Fig. 7 |
Fig. 7 |. Abiraterone synergizes with atorvastatin in suppressing CHD1-deleted/SPOP-mutant PCa cells.
ad, Dose–response matrix and drug interaction landscapes revealing combination effects of abiraterone (Abi) and atorvastatin (Ato) on LNCaP (a and b), MyC-CaP (c) and LAPC4 (d) cells with or without SPOPW131G and CHD1 deletion. Drug interaction landscapes and synergy scores were generated using Synergyfinder. e, Representative GFP images of PCSp organoids after 6 day of treatment with abiraterone or atorvastatin, alone or in combination, in the absence of DHT; scale bar, 2,000 μm. f, Hematoxylin and eosin (H&E) and IHC staining of the indicated markers in PCSp organoids treated with abiraterone or atorvastatin; scale bar, 50 μm. g, Quantification of Ki67 (top), cleaved caspase-3 (middle) and AR (bottom) IHC staining in PCSp organoids treated with abiraterone or atorvastatin, alone or in combination (n = 3 organoid samples per group). Data are presented as mean ± s.d. Experiments were performed at least three times with similar results. A one-way ANOVA with Tukey’s post hoc test (g) was performed using GraphPad Prism v.9.2.0.
Fig. 8 |
Fig. 8 |. Abiraterone combined with cholesterol-lowering drugs shows therapeutic potential in CHD1-deleted/SPOP-mutant CRPC.
a, Schematics of treatment design in PSp and PCSp mice. Surgical castration was performed in 10-month-old male PSp and PCSp mice. After 30 days, the mice were orally treated with abiraterone (Abi; 200 mg per kg per day) and atorvastatin (Ato; 20 mg per kg per day) for 3 weeks. Tumor growth was monitored using 7T-MRI; D, day. b,c, Representative MRI and tumor volume quantification of prostate tumors from PCSp mice (n = 4 mice) before and after treatment with abiraterone and atorvastatin. Prostate tumor regions are circled with orange dashed lines. d, H&E and IHC staining of the indicated markers in prostate tumors from castrated male PCSp mice, with and without combination treatment. Representative images are from dorsal and lateral prostate lobes; scale bar, 100 μm. e, Quantification of Ki67 (left), cleaved caspase-3 (middle) and AR (right) IHC staining in PCSp prostate tumors treated with abiraterone and atorvastatin (n = 3 tumors per group). Data are presented as mean ± s.d. Experiments were performed at least three times with similar results. Two-tailed paired Student’s t-tests (c and g) were performed using GraphPad Prism v.9.2.0. f, Schematic of the working model. CHD1 cooperates with the transcriptional repressor SNF2H–ACF1 complex to suppress the expression of SREBP2 (encoded by SREBF2 gene), a master transcriptional factor in cholesterol metabolism. In CHD1-deleted/SPOP-mutant prostate tumors, loss of CHD1 induces SREBP2 and its targets (HMGCR, SQLE and DHCR24) that catalyze cholesterol biosynthesis, thereby fueling de novo androgen synthesis mediated by CYP17A1 and other enzymes. Together with stabilized AR protein induced by SPOP mutation, increased androgen production augments AR signaling, retains AR activity under castration and facilitates the development of CRPC. Combining CYP17A1 inhibitor (abiraterone) with statins targeting cholesterol synthesis has therapeutic potential in CHD1-deleted/SPOP-mutant CRPC.

References

    1. Desai K, McManus JM & Sharifi N Hormonal therapy for prostate cancer. Endocr. Rev 42, 354–373 (2021). - PMC - PubMed
    1. Huggins C & Hodges CV Studies on prostatic cancer. I. The effect of castration, of estrogen and of androgen injection on serum phosphatases in metastatic carcinoma of the prostate. Cancer Res. 1, 293–297 (1941). - PubMed
    1. Stanbrough M et al. Increased expression of genes converting adrenal androgens to testosterone in androgen-independent prostate cancer. Cancer Res. 66, 2815–2825 (2006). - PubMed
    1. Montgomery RB et al. Maintenance of intratumoral androgens in metastatic prostate cancer: a mechanism for castration-resistant tumor growth. Cancer Res. 68, 4447–4454 (2008). - PMC - PubMed
    1. Holzbeierlein J et al. Gene expression analysis of human prostate carcinoma during hormonal therapy identifies androgen-responsive genes and mechanisms of therapy resistance. Am. J. Pathol 164, 217–227 (2004). - PMC - PubMed

MeSH terms