. 2025 May 13;24(1):141.
doi: 10.1186/s12943-025-02342-6.

Profiling triple-negative breast cancer-specific super-enhancers identifies high-risk mesenchymal development subtype and BETi-Targetable vulnerabilities

Affiliations

Profiling triple-negative breast cancer-specific super-enhancers identifies high-risk mesenchymal development subtype and BETi-Targetable vulnerabilities

Qing-Shan Chen et al. Mol Cancer. .

Abstract

Background: Super-enhancers (SEs) are critical regulators of tumorigenesis and represent promising targets for bromodomain and extra-terminal domain inhibitors (BETi). However, clinical studies across various solid tumors, including triple-negative breast cancer (TNBC), have demonstrated limited BETi efficacy. This study aims to investigate SE heterogeneity in TNBC and its influence on BETi effectiveness, with the goal of advancing BETi precision treatment strategies and enhancing therapeutic efficacy.

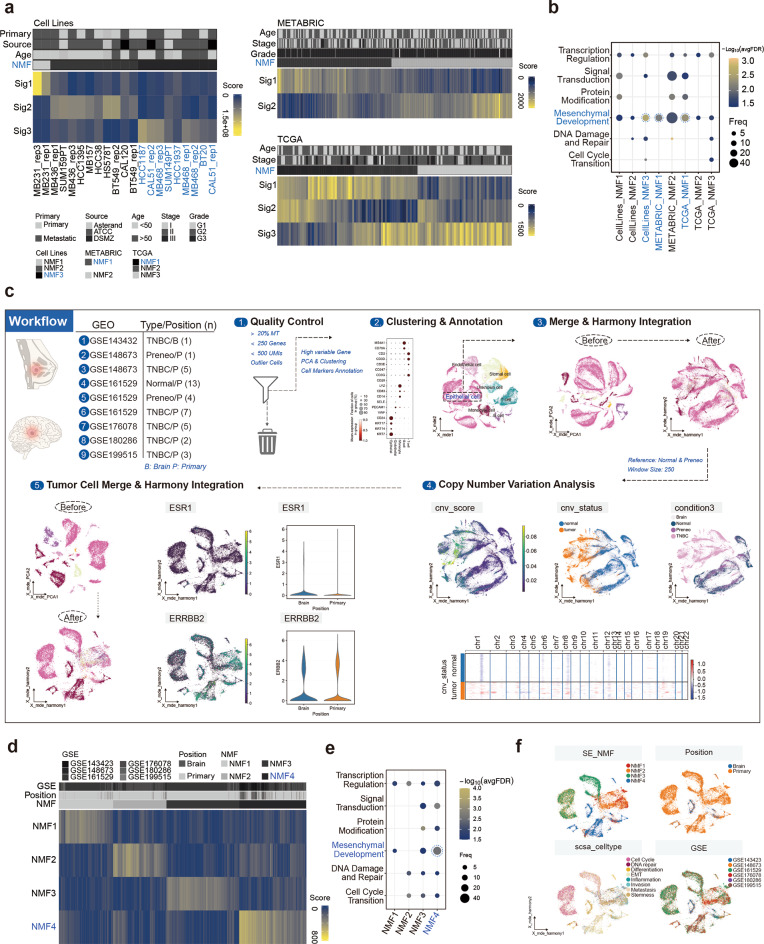
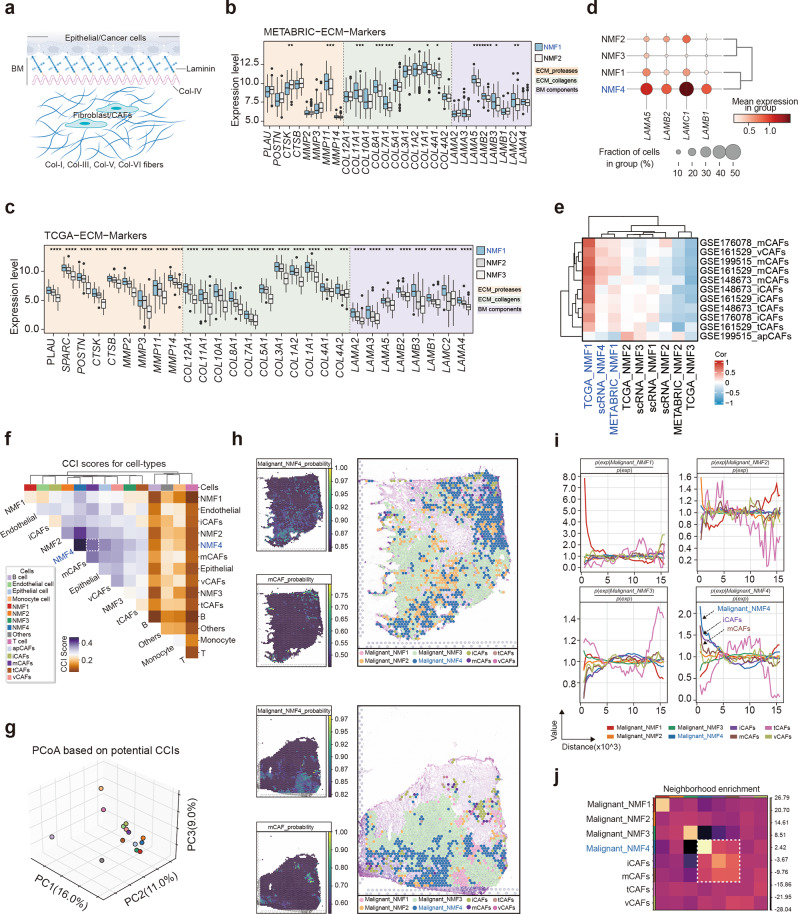
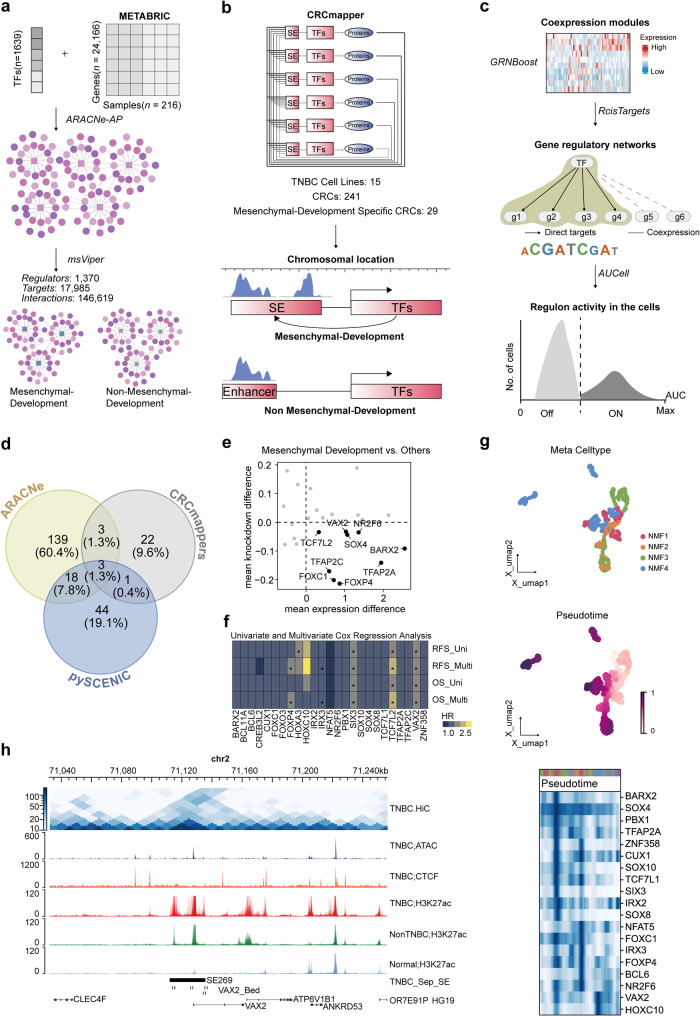
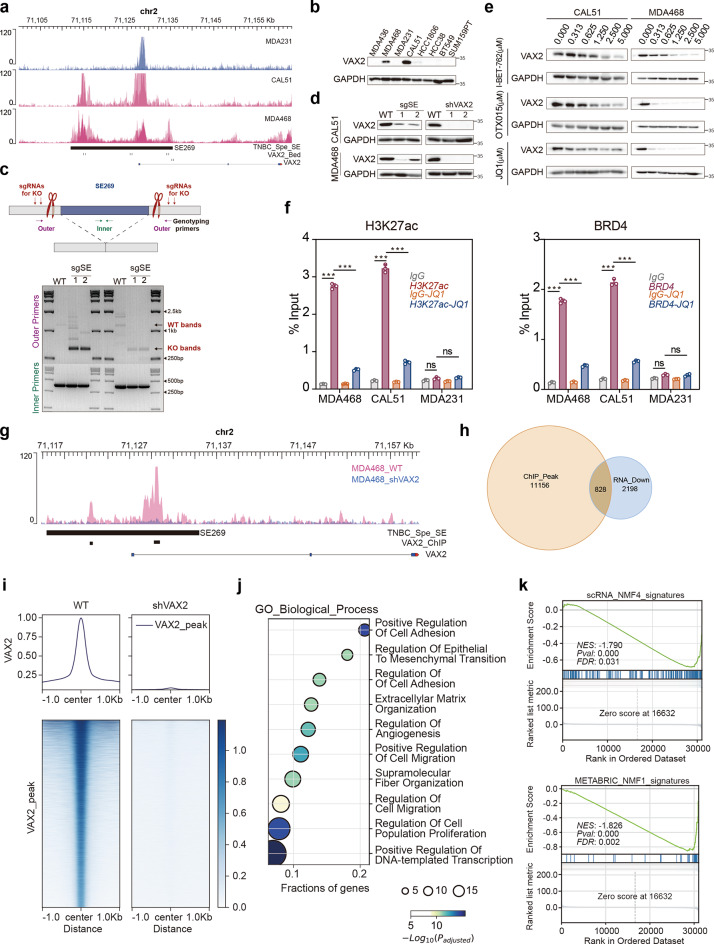
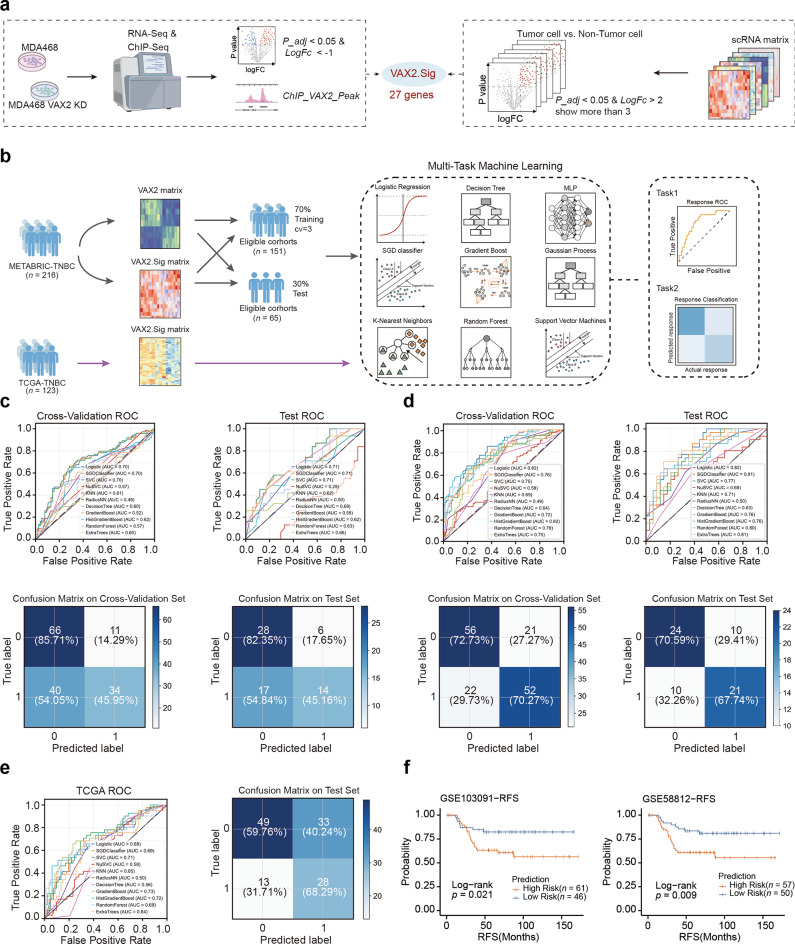
Methods: We conducted a comprehensive analysis of H3K27ac ChIP-Seq data from TNBC cell lines and clinical samples, integrating multiple bulk RNA-Seq, scRNA-Seq, and stRNA-Seq datasets to characterize the SE landscape and heterogeneity in TNBC. Utilizing various bioinformatics algorithms, CERES scoring, and clinical prognostic data on transcription factors (TFs), we identified core transcriptional regulatory circuits (CRCs) composed of TNBC-specific SEs and master regulators, characterizing different TNBC subtypes. The biological significance of CRCs in these different TNBC subtypes and their influence on BETi sensitivity were evaluated using in vitro and in vivo models.

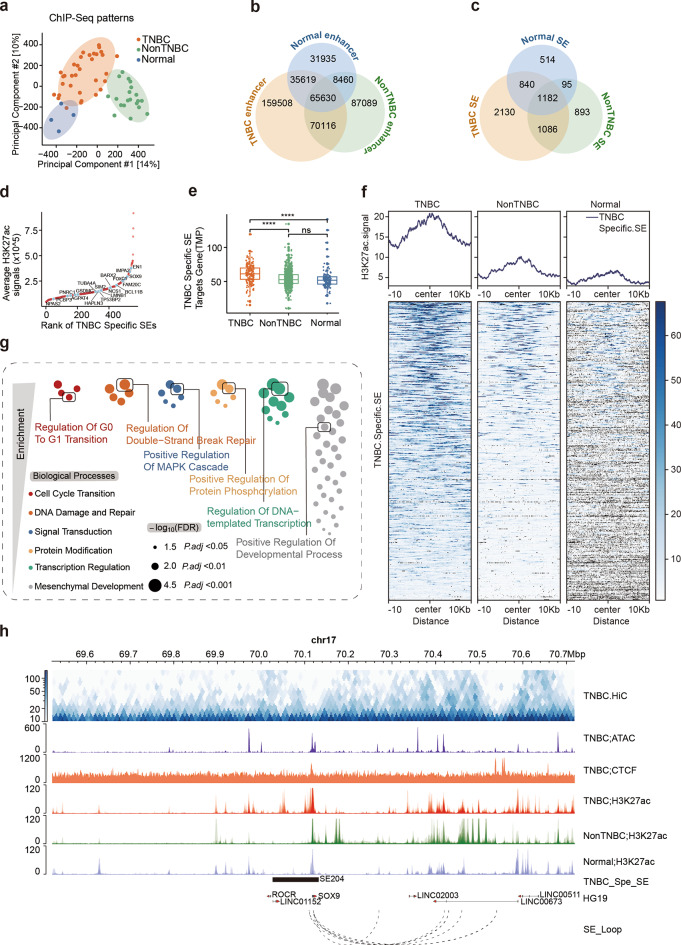
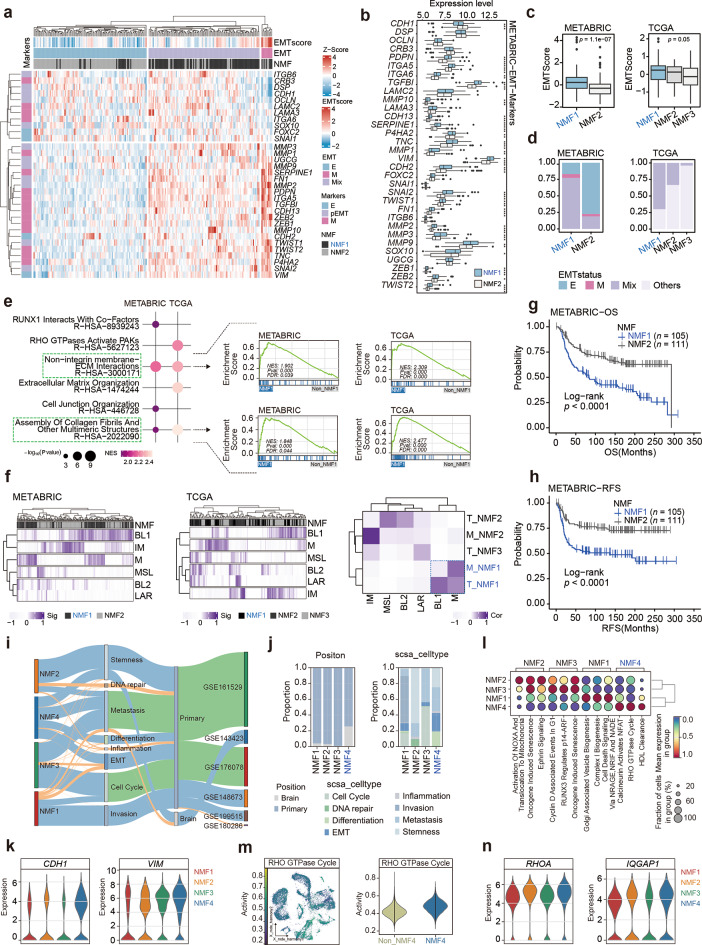
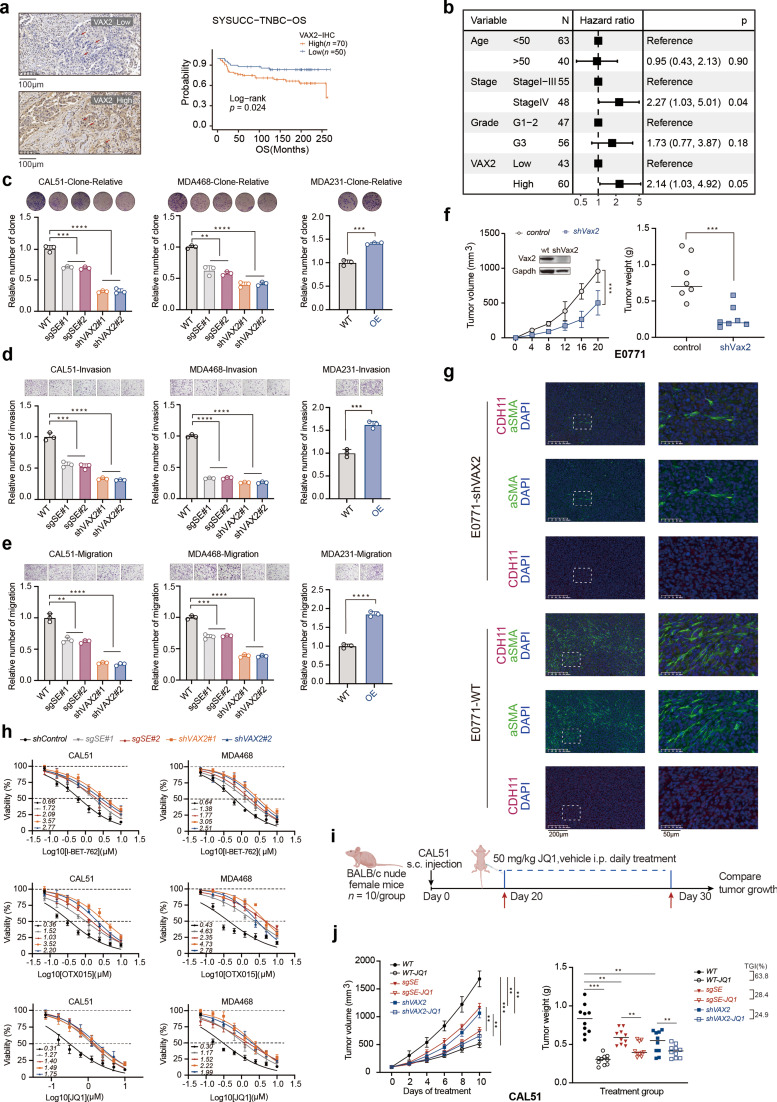
Results: Our findings revealed a distinct SE landscape in TNBC compared to non-TNBC and normal breast epithelium, allowing TNBC to be classified into distinct subtypes based on TNBC-specific SEs. Importantly, we identified a high-risk mesenchymal development subtype, validated across cell lines and transcriptomic analyses, primarily driven by a CRC consisting of the master regulator VAX2 and a TNBC-specific SE. This SE-VAX2 CRC is essential for sustaining the malignant traits of this subtype and increasing its sensitivity to BETi.

Conclusions: Our research clarifies the heterogeneity of SEs in TNBC and identifies a high-risk mesenchymal development subtype driven by the SE-VAX2 CRC. The subtype shows more sensitivity to BETi, supporting its precision application in TNBC.

Keywords: Heterogeneity; Super-enhancers; Transcription factors; Triple-negative breast cancer.


Conflict of interest statement

Declarations. Ethical approval: The study protocol was approved by the Medical Ethics Committee of Sun Yat-sen University Cancer Center (Medical Research Ethics Review No. G2021-092-01). The study conformed to the principles of the Helsinki Declaration. Competing interests: The authors declare no competing interests.

Figures

Fig. 1
Fig. 1
Triple-negative breast cancer-specific super-enhancer profile. (a) Multidimensional scaling plot for global H3K27ac ChIP-seq patterns in breast cancer. (b) Venn diagram showing overlaps in the total number of H3K27ac-defined active enhancer peaks in TNBC (yellow), non-TNBC (green) and normal mammary epithelium (blue). (c) Same as (b), analyzing the number of active SE peaks. (d) Distribution of TNBC-specific SE signals and corresponding target genes. (e) Boxplot representing the mean expression of TNBC-specific SE target genes among TNBC, non-TNBC, and normal mammary epithelium. (f) Genome-wide rank-ordered heatmap of mean H3K27ac ChIP-seq signal at TNBC-specific SE peaks. (g) Enrichment analysis of TNBC-specific SE target genes. Individual terms are grouped into meta-functional classes. FDR, false discovery rate. (h) Multiple layers of regulatory information, including HiC, CTCF, ATAC–seq and H3K27ac ChIP–seq profiles, TNBC-specific SEs and chromatin interactions, integrated in this study, are shown exemplarily for the SOX9 locus, which is regulated by one of the TNBC-specific SEs. Statistical analysis was performed using the Wilcoxon rank-sum test. **** p < 0.0001.
Fig. 2
Fig. 2
Heterogeneous subtype defined by TNBC-Specific SEs. (a) NMF analysis of TNBC-specific SE H3K27ac signals in TNBC cell lines and NMF analysis of TNBC samples based on the expression of the TNBC-specific SE target genes. (b) Enrichment analysis of signature genes from different NMF subtypes based on TNBC-specific SE H3K27ac signals or target genes. The enrichment analysis results were categorized into different functional groups. (c) Workflow for extracting TNBC tumor cells from scRNA-Seq datasets. (d) NMF analysis of TNBC tumor cells based on the expression of the TNBC-specific SE target genes. (e) Enrichment analysis of signature genes from different NMF subtypes based on TNBC-specific SE target genes in TNBC tumor cells. (f) Dataset sources, lesion locations, SCSA functional subtypes, and different NMF subtypes of TNBC tumor cells.
Fig. 3
Fig. 3
TNBC-specific SE heterogeneity analysis identifies a consistently high-risk mesenchymal development subtype. (a–d) EMT scores and status across different TNBC NMF subtypes (a). Mean expression levels of EMT marker genes (b), EMT scores (c), and the distribution of different EMT statuses (d) across TNBC NMF subtypes. (e) GSEA of differentially expressed genes between mesenchymal and non-mesenchymal TNBC subtypes in METABRIC and TCGA cohorts. (f) Lehmann bulk RNA-seq subtype gene signatures in TNBC samples from METABRIC (left) and TCGA (mid). The correlation between Lehmann bulk RNA-seq subtype gene signatures and NMF subtype gene signatures (right). (g-h) Kaplan–Meier OS (g) and RFS (h) curves for patients assigned to different NMF subtypes in METABRIC. (i-j) River plot and bar plot showing an overview of dataset sources, lesion locations, SCSA functional subtypes, and different NMF subtypes of TNBC tumor cells. (k) Expression of EMT marker genes CDH1 and VIM across different NMF subtypes of TNBC tumor cells. (l) Pathway enrichment analysis of different NMF subtypes of TNBC tumor cells using AUCell. (m-n) Enrichment of Rho GTPase cycle pathway activity (m) and the expression of corresponding marker genes (n) across different NMF subtypes of TNBC tumor cells. Statistical analysis was performed using the Wilcoxon rank-sum test. * p < 0.05, ** p < 0.01, *** p < 0.001, ****p < 0.0001.
Fig. 4
Fig. 4
Tumor microenvironment characteristics of the mesenchymal development subtype. (a) Schematic representation of sources and components of the ECM. (b–d) Expression of ECM marker genes across different NMF subtypes in METABRIC (b), TCGA (c), and scRNA-seq (d). (e) Correlation between the signature gene enrichment scores of different CAF subtypes and the signature scores of NMF subtypes. (f-g) Cell-cell communication interaction scores between different cell types in the tumor microenvironment using the Cell2Cell tool. (h) Spatial images showing cell abundance and location, as estimated by Scanpy, for different NMF subtype tumor cells and different CAF subtypes. (i) Spatial distances between different NMF subtype tumor cells and different CAF subtypes. (j) Neighborhood enrichment analysis between different NMF subtype tumor cells and different CAF subtypes. Statistical analysis was performed using the Wilcoxon rank-sum test. * p < 0.05, ** p < 0.01, *** p < 0.001, ****p < 0.0001.
Fig. 5
Fig. 5
The master regulator for the mesenchymal development subtype of TNBC. (a–c) Workflow for determining the core TFs and computing TF activities using the ARACNe-AP and msVIPER methods (a), CRCmapper (b), and the pySCENIC algorithm (c). CRC, core regulatory circuit. (d) Venn diagram illustrating the core TFs identified by different algorithms. (e) Comparison of the knockdown sensitivity of all core TFs (n = 25 genes) between mesenchymal development subtype cell lines (n = 6) and other cancer cell lines (n = 9). The labeled genes are those that are highly specific for mesenchymal development subtype cell lines. (f) Univariate and multivariate Cox analyses of the effects of core TFs on TNBC survival. * p < 0.05. (g) Changes in the expression levels of core TFs during single-cell pseudotime analysis. (h) Integration of multiple layers of regulatory information, including Hi-C, CTCF, ATAC-seq, H3K27ac ChIP-seq profiles, TNBC-specific SEs, and chromatin interactions, exemplified by the VAX2 locus, a master regulator controlled by TNBC-specific SEs.
Fig. 6
Fig. 6
VAX2 is a key master regulator for the TNBC mesenchymal development subtype. (a) Genome browser plot showing TNBC-specific SE and key master regulator VAX2 H3K27ac signals. The data were obtained from public databases, refer to Supplementary Table 1 for details. (b) Immunoblotting detection of VAX2 expression in a panel of TNBC cell lines. (c) Top: Schematic illustrating CRISPR-knockout of SE269. Bottom: DNA blot confirming successful heterozygous knockout of SE269. (d) Immunoblotting of VAX2 in CAL51 and MDA468 upon deletion of SE269 or direct knockdown of VAX2. (e) Inhibition of VAX2 expression levels in CAL51 and MDA468 cell lines by BETi, with the inhibitory effect increasing as the drug concentration increases. (f) H3K27ac and BRD4 ChIP-qPCR of the indicated cell lines using primers amplifying VAX2 SE269. Error bars represent mean ± SD, n = 3 biological independent samples. (g) IGV map showing VAX2 peaks and VAX2 ChIP-seq binding locations around SE269 in MDA468 and VAX2-knockdown MDA468 cell lines. (h) ChIP-seq analysis of VAX2 identified 11,156 potential target genes. Among them, 828 genes were downregulated in VAX2-knockdown cells. (i) ChIP-seq signal heatmap showing that VAX2 is enriched in 828 regulated genes. (j) Functional enrichment analysis of 828 genes regulated by VAX2, identified by VAX2 ChIP-seq and RNA-seq, showed relevance to mesenchymal development functions (including EMT, ECM formation, cell proliferation, cell adhesion, etc.). (k) GSEA of differentially expressed genes between VAX2-knockdown and wild-type MDA468 cell lines showed attenuated enrichment of gene sets characteristic of the TNBC mesenchymal development subtype. The p value in (f) was determined by a two-sided Student's t-test. *** p < 0.001; ns, no significance. Data in (b–f) were representative of three independent experiments.
Fig. 7
Fig. 7
The VAX2-driven mesenchymal development subtype of TNBC exhibits high malignancy and heightened sensitivity to BETi. (a) Clinical data from SYSUCC-TNBC analysis on the impact of VAX2 immunohistochemical staining intensity on patient prognosis. (b) Multivariate Cox model analysis of the effect of VAX2 immunohistochemical staining intensity on OS in SYSUCC-TNBC. (c–e) Effects of VAX2 SE269 excision, direct VAX2 knockdown in CAL51 and MDA468 cell lines, and VAX2 overexpression in MDA231 cells on cell proliferation (c), migration (d), and invasion (e). n = 3 biological independent samples. (f) Tumour growth of the indicated E0771 cells in C57BL/6 mice (n = 7 mice per group). (g) Multiple immunofluorescence analyses showing the effect of VAX2 expression on mCAF infiltration. (h) Sensitivity of wild-type TNBC mesenchymal development subtype cell lines, SE269-deleted lines, and VAX2-knockdown lines to BETi, n = 6 biological independent samples. (i-j) Schematic of JQ1 in vivo therapy experiments (n = 10 mice per group). Blue dashed lines indicate the JQ1 dosing period. (i). Tumor growth curves and weight measurements of CAL51 and modified strains from BALB/c nude mice 30 days after vehicle or JQ1 treatment (j). Error bars represent mean ± SD. The p value in (c, d, e) was caluculated by a two-sided Student's t-test. The p value in (f) and (j) was determined by one-way ANOVA, ** p < 0.01, *** p < 0.001. Data in (c, d, e, h) were representative of three independent experiments. Data in (f, g, i, j) were representative of two independent experiments.
Fig. 8
Fig. 8
A simple machine-learning model predicts TNBC mesenchymal subtype patients. (a) Flowchart illustrating the construction of the VAX2 signature (VAX2.sig). First, downregulated genes (p.adj < 0.05 & logFC < -1) were identified from RNA-seq of VAX2-knockdown MDA468 vs. WT-MDA468. Second, genes near VAX2-binding peak regions were obtained from ChIP-seq analysis of VAX2-knockdown MDA468 vs. WT-MDA468. Finally, genes specifically expressed in tumor cells were identified from six TNBC single-cell datasets (p.adj < 0.05 & logFC > 2; genes present in more than three datasets). The intersection of these gene sets was taken to define VAX2.sig. (b) VAX2 or VAX2.sig expression was used in a multi-task machine-learning model to predict patients with the TNBC mesenchymal subtype. METABRIC-TNBC was used for model training and validation, and TCGA-TNBC was used for independent validation. (c-d) In METABRIC-TNBC, the predictive performance of different machine-learning models based on VAX2 expression (c) or VAX2.sig (d), including the ROC curves of different machine-learning models and the confusion matrix of the best-performing model. (e) In TCGA-TNBC, the predictive performance of different machine-learning models based on VAX2.sig, including the ROC curves of different machine-learning models and the confusion matrix of the best-performing model. (f) The best-performing machine-learning model based on VAX2.sig predicted the prognosis of patients with the mesenchymal subtype in two additional TNBC cohorts.

Similar articles

References

    1. Garrido-Castro AC, Lin NU, Polyak K. Insights into molecular classifications of Triple-Negative breast cancer: improving patient selection for treatment. Cancer Discov. 2019;9:176–98. - PMC - PubMed
    1. Liu Y, Hu Y, Xue J, Li J, Yi J, Bu J, et al. Advances in immunotherapy for triple-negative breast cancer. Mol Cancer. 2023;22:145. - PMC - PubMed
    1. Ye F, Dewanjee S, Li Y, Jha NK, Chen Z-S, Kumar A, et al. Advancements in clinical aspects of targeted therapy and immunotherapy in breast cancer. Mol Cancer. 2023;22:105. - PMC - PubMed
    1. Cancer Genome Atlas Network. Comprehensive molecular portraits of human breast tumours. Nature. 2012;490:61–70. - PMC - PubMed
    1. Pereira B, Chin S-F, Rueda OM, Vollan H-KM, Provenzano E, Bardwell HA, et al. The somatic mutation profiles of 2,433 breast cancers refines their genomic and transcriptomic landscapes. Nat Commun. 2016;7:11479. - PMC - PubMed

MeSH terms

LinkOut - more resources