. 2025 May 13;23(1):129.
doi: 10.1186/s12915-025-02229-4.

Guanine quadruplexes mediate mitochondrial RNA polymerase pausing

Affiliations

Guanine quadruplexes mediate mitochondrial RNA polymerase pausing

Ryan J Snyder et al. BMC Biol. .

Abstract

Background: The information content within nucleic acids extends beyond the primary sequence to include secondary structures with functional roles in transcription regulation. Guanine-rich sequences form structures called guanine quadruplexes that result from non-canonical base pairing between guanine residues. These stable guanine quadruplex structures are prevalent in gene promoters in nuclear DNA and are known to be associated with promoter proximal pausing of some genes. However, the transcriptional impact of guanine quadruplexes that form in nascent RNA is poorly understood.

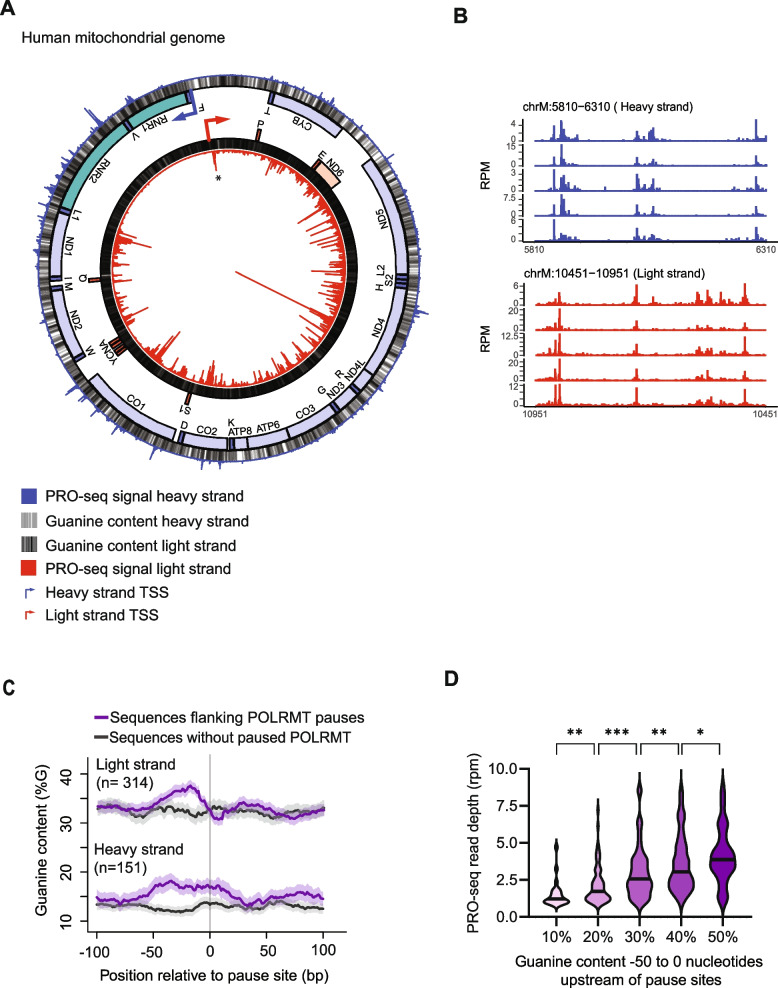
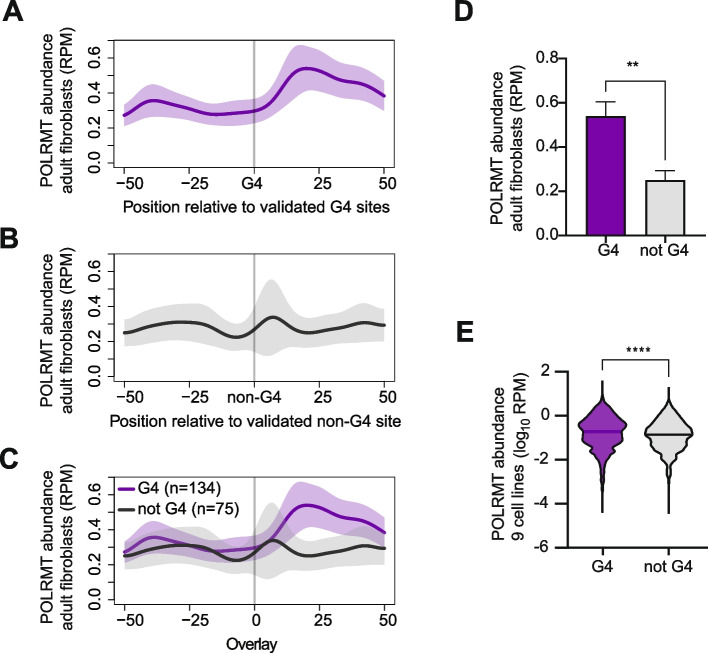
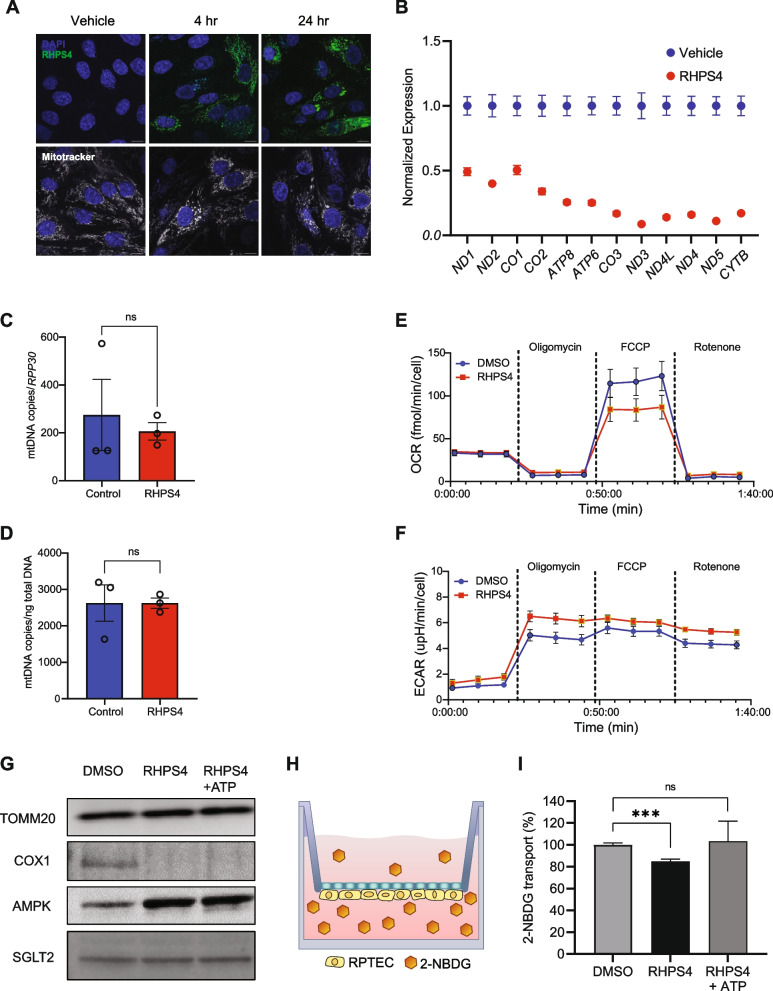
Results: We examined mitochondrial RNA polymerase (POLRMT) pausing patterns in primary human skin fibroblast cells using the precision nuclear run-on assay and uncovered over 400 pause sites on the mitochondrial genome. We identified that these pauses frequently occur following guanine-rich sequences where quadruplexes form. Using an in vitro primer extension assay, we show that quadruplexes formed in nascent RNA act as mediators of POLRMT pausing, and in cell-based assays their stabilization disrupts POLRMT transcription. Cells exposed to a guanine-quadruplex stabilizing agent (RHPS4) had diminished mitochondrial gene expression and significantly lowered cellular respiration within 24 h. The resulting ATP stress was sufficient to reduce active transport in renal epithelia.

Conclusions: Our findings connect RNA guanine quadruplex-mediated pausing with the regulation of POLRMT transcription and mitochondrial function. We demonstrate that tuning of quadruplex dynamics in nascent RNA, rather than template DNA upstream of the polymerase, is sufficient to regulate mitochondrial gene expression.

Keywords: Guanine quadruplex; Mitochondria; Proximal tubule; RNA polymerase pausing; Transcription.


Conflict of interest statement

Declarations. Ethics approval and consent to participate: Not applicable. Consent for publication: Not applicable. Competing interests: The authors declare no competing interests.

Figures

Fig. 1
Fig. 1
POLRMT pauses throughout the mitochondrial genome. A Locations where POLRMT pauses along the mitochondrial genome. From the center: PRO-seq signal from the light strand shown as a circularized bar graph (red), guanines (grey), genes on the light strand (mRNA red, tRNA dark red), genes on the heavy strand (rRNA green, mRNA blue, tRNA dark blue), guanines (grey), PRO-seq signal from the heavy strand shown in the outer circularized bar graph in blue. The location of a previously identified promoter-proximal pause is indicated (*). Y-axis is 0 to 50 reads per million (RPM) for both heavy and light strands. Data are average PRO-seq signal from primary adult fibroblasts (N = 5). B PRO-seq from five individuals cell lines shown in panel A. Y-axis is RPM. C Guanine content is significantly higher at POLRMT pause sites compared to sequences without pausing (heavy stand P < 10–13, light strand P < 3 × 10–7, Wilcoxon test). D Violin plots of POLRMT abundance by guanine content upstream of the pause (*P < 0.05, **P < 0.01 ***P < 0.001; Mann–Whitney U-test)
Fig. 2
Fig. 2
Guanine quadruplexes are enriched upstream of POLRMT pause sites. A, B Predicted G4 forming sequences were identified by two algorithms, G4Hunter (A) or QGRS mapper (B) at the 465 POLRMT pause sites or 481 random locations without paused POLRMT. Scores on the Y-axis reflect the strength of G4 prediction. C G4 abundance determined experimentally by BG4 immunoprecipitation followed by sequencing is plotted for the 465 POLRMT pause sites or 481 random sequences without paused POLRMT. In A-C average values are shown and error bands represent S.E.M. D Tracks showing locations of predicted G4 forming sequences by G4Hunter and QGRS mapper (black tracks), G4 enrichment measured by BG4 or mitoBG4 immunoprecipitation followed by sequencing (green tracks), and POLRMT location measured by PRO-seq (blue tracks; RPGC = reads per genomic region mapped, RPM = reads per million, FB = fibroblast, interval shown ChrM:5650–6450)
Fig. 3
Fig. 3
POLRMT accumulates downstream of guanine quadruplex forming sequences. A-C POLRMT distribution is plotted as average PRO-seq signal from 5 adult fibroblast centered on sequences that form G4s (A), or guanine rich sequences that do not form G4s (B), or overlayed (C). D POLRMT abundance 25 nucleotides downstream of known G4 forming sequences (n = 134) compared to sequences known not to form G4s (n = 75) in adult fibroblasts (**P < 0.01, t-test; Cohen’s D 0.33). In A-D, Y-axis is RPM, and error represent S.E.M. E Violin plots of POLRMT abundance 25 nucleotides downstream of known G4 forming sequences (n = 134) compared to sequences known not to form G4s (n = 75) across all 12 PRO-seq datasets from 9 cell lines. Line indicates the median (****P < 0.0001, t-test; Cohen’s D 0.26)
Fig. 4
Fig. 4
CO1-G4 forms in RNA but not DNA. A G4Hunter and QGRS mapper predicted G4 forming sequence (underlined) present upstream of the pause site in the MT-CO1 gene in adult fibroblast samples. B G4-IP in fibroblasts shows enrichment of G4 at this pause site (n = 4; ***P < 0.01; t-test). C NMR spectra for CO1-G4 sequences in RNA, or DNA, or where the guanines are converted to uracil to prevent G4 formation. NMR chemical shifts in the range of 10–12 ppm indicate Hoogsteen base-pairing during quadruplex formation. D Circular dichroism spectra of RNA or DNA oligos corresponding to sequences in panel B, annealed in different buffer solutions. The pattern with minima at ~ 240 nm and maxima at ~ 260 nm is consistent with a parallel G4, whereas minima at ~ 240 nm with maxima at ~ 275 nm is an unfolded oligonucleotide
Fig. 5
Fig. 5
Stable G4 lead to more paused POLRMT. A NMR spectra of reference (red) and mutant (blue) CO1-G4 RNA sequence. The position of a G to A mutation is in bold. B Representative gel showing intensity of fluorescently labelled RNA product from in vitro transcription and DNA loading control. Quantification of normalized fluorescence signal is plotted (n = 6; P < 0.01; t-test error bars = S.E.M). C Representative gel showing intensity of fluorescently-labelled RNA product from in vitro transcription using 7-deaza-G and DNA loading control. Quantification of normalized fluorescence signal is plotted (n = 6; P > 0.05; t-test error bars = S.E.M). D Confocal image showing RHPS4 (green) and MitoTracker (grey) localization in the cytoplasm following 4 and 24 h of RHPS4 treatment. Cells in the upper panels are not stained with MitoTracker. Scale bar is 10 µm. E Immunofluorescence staining for G4 using 1H6 antibody (green) before and 24 h after treatment with RHPS4. Scale bar is 50 µm. Bulk G4 abundance measured by immunofluorescence, expressed as percentage of intracellular area labeled, before and after RHPS4 treatment (n = 9; P < 0.001, t-test). F PRO-seq data from biological replicate experiments showing POLRMT distribution before and after treatment with RHPS4. Y-axis is RPM. RHPS4 results in a shift in POLRMT localization with more polymerase at the 5’ end of the polycistron and decreased POLRMT at the 3’ end of the polycistron. G-rich light strand transcripts are in red and G-poor heavy strand transcripts are in blue
Fig. 6
Fig. 6
POLRMT pausing impairs renal proximal tubule function. A Confocal image showing RHPS4 (green) uptake into mitochondria following 4 and 24 h of drug treatment. Mitochondria are stained with Mitotracker (grey). Cells in the upper panels are not stained with MitoTracker. Scale bar is 10 µm. B Mitochondrial gene expression in renal proximal tubule epithelial cells (RPTEC) 24 h after RHPS4 treatment, normalized to vehicle treated cells. Gene expression is in arbitrary units (n = 3; P < 0.0001, one-way ANOVA, error bars = S.E.M.). C mtDNA copies per nuclear genome (n = 3; P > 0.05, t-test) (D) mtDNA copies per total DNA mass (n = 3; P > 0.05, t-test). E Oxygen consumption (OCR) is lower (n = 5; P < 0.0001, two-way ANOVA, error bars = S.D.) and (F) Extracellular acidification rate (ECAR) is higher (n = 5, P < 0.0001, two-way ANOVA, error bars = S.D.) in RPTEC 24 h after treatment with RHPS4. G Protein expression of nuclear-encoded TOMM20, mitochondria-encoded COX1 (MT-CO1) and AMPK phosphorylation before and after 72 h of RHPS4 treatment. H Schematic of renal proximal tubule culture system, where cells are seeded on the bottom of the permeable membrane. I Active transport of glucose analogue 2-(N-(7-Nitrobenz-2-oxa-1,3-diazol-4-yl)Amino)−2-Deoxyglucose (2-NBDG), expressed as a percentage of transport performed by DMSO-treated cells (n ≥ 5; ***P < 0.001, t-test, error bars = S.E.M)

Update of

References

    1. Chandel NS. Mitochondria. Cold Spring Harb Perspect Biol. 2021;13(3):a040543. - PMC - PubMed
    1. Sorrentino V, Menzies KJ, Auwerx J. Repairing mitochondrial dysfunction in disease. Annu Rev Pharmacol Toxicol. 2018;58:353–89. - PubMed
    1. Tran M, Tam D, Bardia A, Bhasin M, Rowe GC, Kher A, et al. PGC-1alpha promotes recovery after acute kidney injury during systemic inflammation in mice. J Clin Invest. 2011;121(10):4003–14. - PMC - PubMed
    1. Sharoyko VV, Abels M, Sun J, Nicholas LM, Mollet IG, Stamenkovic JA, et al. Loss of TFB1M results in mitochondrial dysfunction that leads to impaired insulin secretion and diabetes. Hum Mol Genet. 2014;23(21):5733–49. - PubMed
    1. Ishii K, Kobayashi H, Taguchi K, Guan N, Li A, Tong C, et al. Kidney epithelial targeted mitochondrial transcription factor A deficiency results in progressive mitochondrial depletion associated with severe cystic disease. Kidney Int. 2021;99(3):657–70. - PMC - PubMed

LinkOut - more resources