. 2025 Apr 25;15(9):1094.
doi: 10.3390/diagnostics15091094.

Identification of PECAM1 as a Prognostic Biomarker for Lung Adenocarcinoma

Affiliations

Identification of PECAM1 as a Prognostic Biomarker for Lung Adenocarcinoma

Shih-Sen Lin et al. Diagnostics (Basel). .

Abstract

Background: Lung cancer continues to be one of the most fatal malignancies globally. Uncovering differentially expressed genes (DEGs) is crucial for advancing our understanding of tumor mechanisms and discovering new therapeutic targets. This study sought to identify key genes linked to prognosis and immune infiltration in lung cancer through the analysis of public gene expression datasets. Methods: We examined three microarray datasets from the Gene Expression Omnibus (GSE10072, GSE33356, and GSE18842) to detect DEGs between tumor and normal lung tissues. Functional enrichment was performed using Gene Ontology (GO) and Kyoto Encyclopedia of Genes and Genomes (KEGG) pathway analyses to interpret the biological relevance of these genes. Protein-protein interaction (PPI) networks were constructed via STRING and visualized using Cytoscape to screen for central hub genes. The prognostic implications of the hub genes were investigated using Kaplan-Meier Plotter and TIMER2.0 based on data from The Cancer Genome Atlas (TCGA). PECAM1 expression levels and its relationship with immune cell infiltration were further explored using UCSC Xena. Results: A total of 477 DEGs were consistently identified across all three datasets. Among the top 10 down-regulated hub genes, PECAM1 was significantly reduced in tumor tissues. Lower PECAM1 expression was positively associated with better first-progression survival (FPS) in lung cancer patients. This gene was particularly suppressed in lung adenocarcinoma (LUAD) and showed strong correlations with immune cell infiltration. Co-expression analysis revealed that genes linked to PECAM1 are involved in immune-related pathways. Conclusions: Our findings highlight PECAM1 as a potential prognostic biomarker in lung cancer, especially in LUAD. Its association with immune infiltration and patient survival supports its possible utility in early detection and as a candidate for immunotherapy development.

Keywords: DEGs; NSCLC; PECAM1; bioinformatics; immune infiltration; lung cancer.


Conflict of interest statement

The authors declare that they have no conflicts of interest.

Figures

Figure 1
Figure 1
Overview of the bioinformatics workflow used in this study, including dataset selection, DEG identification, enrichment analyses, hub gene prioritization, and prognostic evaluation.
Figure 2
Figure 2
Intersecting DEGs in GEO datasets in lung cancer: (AC) volcano plots of genes significantly up-regulated (red) and down-regulated (blue) in lung tumors compared to normal tissue; (D) sample sizes: GSE10072 (49 normal and 58 lung cancer tissues), GSE33356 (60 normal and 60 lung cancer tissues), and GSE18842 (45 normal and 46 lung cancer tissues); (E,F) Venn diagrams of overlapping up-regulated and down-regulated DEGs.
Figure 3
Figure 3
Functional roles of DEGs in gene ontology analysis (color marks false discovery rate (FDR): (A) cellular component (CC); (B) biological process (BP); (C) molecular function (MF); and (D) Kyoto encyclopedia of genes and genomes (KEGG).
Figure 4
Figure 4
Top 10 down-regulated hub genes in lung cancer: (A) The protein–protein interaction (PPI, p-value was <1.0 × 10⁻¹⁶) generated by STRING; (B) DEG clusters generated by Cytoscape; (C) top 10 hub genes screened using Cytoscape; (D) hub genes ranked by degree. Note: IL6, interleukin 6; NR4A1, nuclear receptor 4A1; FOSB, FosB proto-oncogene; PECAM1, platelet and endothelial cell adhesion molecule 1; FOS, Fos proto-oncogene; DUSP1, dual-specificity phosphatase 1; NR4A2, nuclear receptor subfamily 4 group A member 2; EGR1, early growth response 1; ATF3, activating transcription factor 3; ZFP36, zinc finger protein 36.
Figure 5
Figure 5
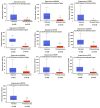
Comparison of top 10 hub gene expressions in LUAD and normal tissues in TCGA database. *: p< 0.05.
Figure 6
Figure 6
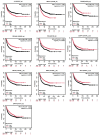
Assessment of the first-progression survival of hub genes: The First-progression survival (FPS) of top 10 hub genes obtained from Kaplan–Meier analysis (HR = hazard ratio; and red and black, respectively, high and low hub gene expression).
Figure 7
Figure 7
Expression of hub genes in lung cancer subtypes: UCSC Xena analysis of expression of hub genes in normal and pathological lung tissues with sub-tissues magnoid (orange), suqamoid (purple), and bronchioid (red).
Figure 8
Figure 8
Meta-analysis of PECAM1 in NSCLC: (A) meta-analysis of PECAM1 expression in LUAD and (B) meta-analysis of PECAM1 expression in LUSC. The random effects model was applied when determining the standardized mean difference (SMD), which is represented by the black squares for each dataset. The varying sizes of the squares reflect the weight of each study, the horizontal lines represent the 95% confidence interval (CI) of each study, and the diamond represents the overall effect size.
Figure 9
Figure 9
Expression of PECAM1 in pan-cancer: (A) expression of PECAM1 in LUAD and various cancer types in the TCGA database analyzed using TIMER2.0; (B,C) Kaplan–Meier plots of PECAM1 expression level and overall survival in LUAD and LUSC patients. *: p < 0.05; **: p < 0.01; ***: p < 0.001. Dotted line represented 95% CI.
Figure 10
Figure 10
Role of PECAM1 co-expressing genes: (A) volcano map of co-expressed genes linked to PECAM1 expression in LUAD from TCGA datasets; (B,C) heat maps of top 50 co-expressed genes positively and negatively correlated with PECAM1 in LUAD from TCGA datasets; (D) gene ontology analysis of PECAM1 co-expression genes, focusing on biological processes and molecular functions; (E) GSEA of PECAM1 co-expression genes, focusing on TNF superfamily cytokine production and adaptive immune response.
Figure 11
Figure 11
Correlations among PECAM1, tumor purity, and immune cells (TPM, transcripts per million).

References

    1. Molina J.R., Yang P., Cassivi S.D., Schild S.E., Adjei A.A. Non-small cell lung cancer: Epidemiology, risk factors, treatment, and survivorship. Mayo Clin. Proc. 2008;83:584–594. doi: 10.1016/S0025-6196(11)60735-0. - DOI - PMC - PubMed
    1. Xu L., Xu B., Wang J., Gao Y., He X., Xie T., Ye X.Y. Recent advances of novel fourth generation EGFR inhibitors in overcoming C797S mutation of lung cancer therapy. Eur. J. Med. Chem. 2023;245:114900. doi: 10.1016/j.ejmech.2022.114900. - DOI - PubMed
    1. Sequist L.V., Lynch T.J. EGFR tyrosine kinase inhibitors in lung cancer: An evolving story. Annu. Rev. Med. 2008;59:429–442. doi: 10.1146/annurev.med.59.090506.202405. - DOI - PubMed
    1. Frontiers Production O. Erratum: The landscape of immunotherapy resistance in NSCLC. Front. Oncol. 2023;13:1187021. doi: 10.3389/fonc.2023.1187021. - DOI - PMC - PubMed
    1. Horvath L., Thienpont B., Zhao L., Wolf D., Pircher A. Overcoming immunotherapy resistance in non-small cell lung cancer (NSCLC)—Novel approaches and future outlook. Mol. Cancer. 2020;19:141. doi: 10.1186/s12943-020-01260-z. - DOI - PMC - PubMed

LinkOut - more resources