

Cold-Induced DHRS4 Promotes Thermogenesis via Enhanced Fatty Acid β-Oxidation in Porcine Subcutaneous Adipocytes
- PMID: 40362005
- PMCID: PMC12071078
- DOI: 10.3390/ani15091190
Cold-Induced DHRS4 Promotes Thermogenesis via Enhanced Fatty Acid β-Oxidation in Porcine Subcutaneous Adipocytes
Abstract
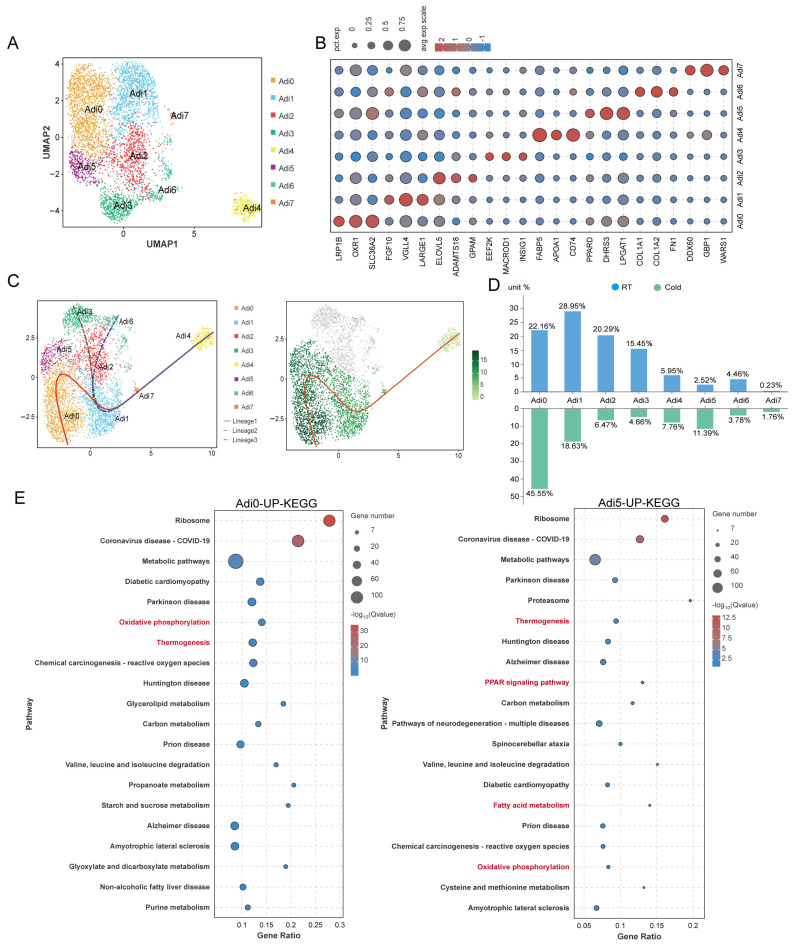
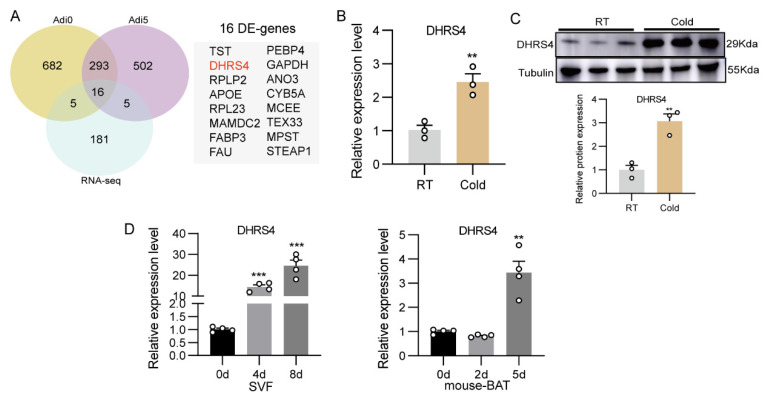
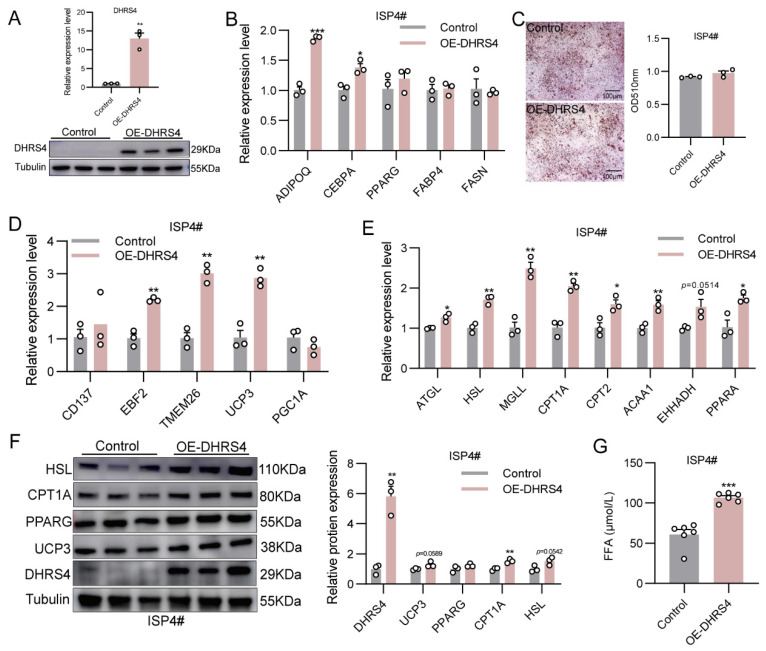
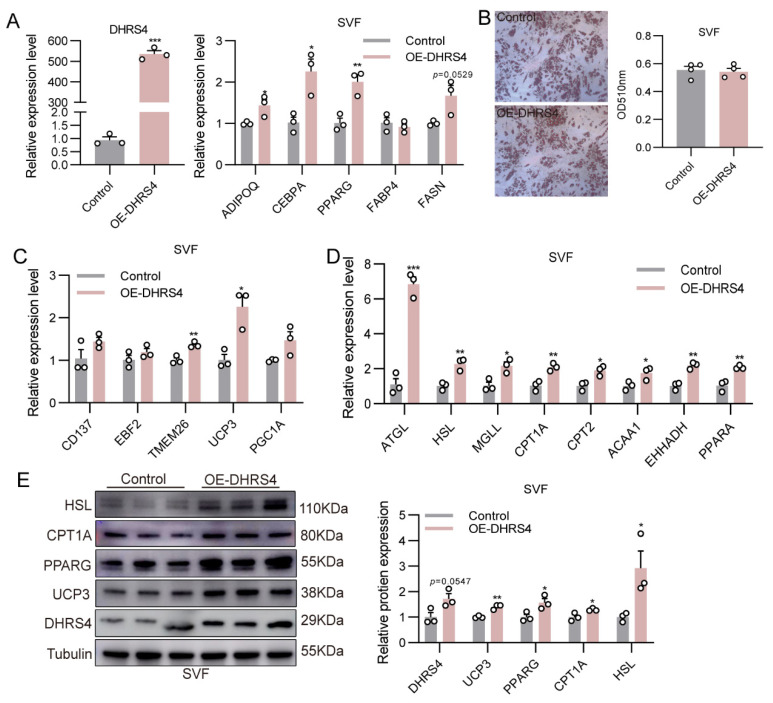
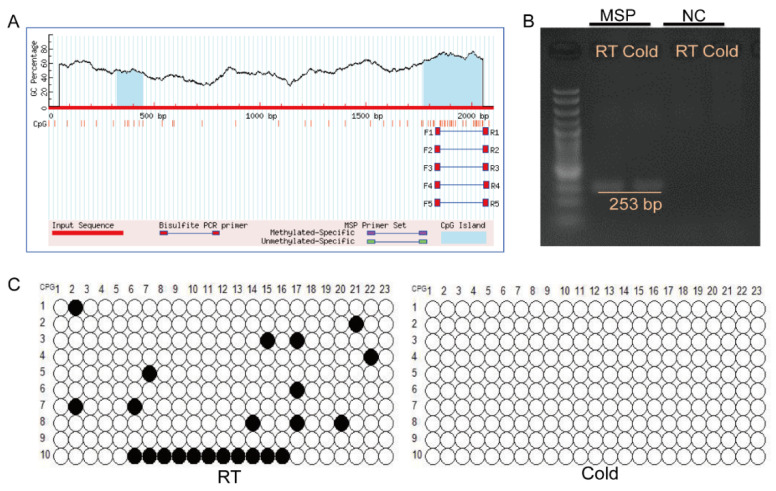
Adipose tissue exhibits remarkable plasticity in adapting to thermal stress, yet the epigenetic mechanisms coordinating metabolic reprogramming in large mammals-particularly in livestock species lacking classical brown adipose tissue (BAT) such as swine-remain elusive. Using a porcine cold exposure model, we investigated adipose adaptation mechanisms through integrated single-cell RNA sequencing and bulk transcriptomic analyses of subcutaneous adipose tissue (subWAT). We identified a cold-induced thermogenic adipocyte subpopulation, characterized by upregulated DHRS4 expression. Mechanistically, cold exposure induced hypomethylation at the DHRS4 promoter locus, enhancing its expression to potentiate fatty acid β-oxidation, accompanied by thermogenic capacity upregulation. Our findings establish DHRS4 as an epigenetic-metabolic switch governing cold adaptation and a potential target for improving cold resistance in swine production systems.
Keywords: cold adaptation; dehydrogenase/reductase (SDR family) member 4; fatty acid β-oxidation.
Conflict of interest statement
The authors declare no conflict of interest.
Figures
Similar articles
-
Adipocyte-specific mTORC2 deficiency impairs BAT and iWAT thermogenic capacity without affecting glucose uptake and energy expenditure in cold-acclimated mice.Am J Physiol Endocrinol Metab. 2021 Nov 1;321(5):E592-E605. doi: 10.1152/ajpendo.00587.2020. Epub 2021 Sep 20. Am J Physiol Endocrinol Metab. 2021. PMID: 34541875
-
Overexpression of Adiponectin Receptor 1 Inhibits Brown and Beige Adipose Tissue Activity in Mice.Int J Mol Sci. 2021 Jan 18;22(2):906. doi: 10.3390/ijms22020906. Int J Mol Sci. 2021. PMID: 33477525 Free PMC article.
-
White adipose remodeling during browning in mice involves YBX1 to drive thermogenic commitment.Mol Metab. 2021 Feb;44:101137. doi: 10.1016/j.molmet.2020.101137. Epub 2020 Dec 5. Mol Metab. 2021. PMID: 33285300 Free PMC article.
-
Human Brown Adipose Tissue Plasticity: Hormonal and Environmental Manipulation.2018 Mar 8. In: Spiegelman B, editor. Hormones, Metabolism and the Benefits of Exercise [Internet]. Cham (CH): Springer; 2017. 2018 Mar 8. In: Spiegelman B, editor. Hormones, Metabolism and the Benefits of Exercise [Internet]. Cham (CH): Springer; 2017. PMID: 31314462 Free Books & Documents. Review.
-
Brown fat thermogenesis and cold adaptation in humans.J Physiol Anthropol. 2025 Apr 21;44(1):11. doi: 10.1186/s40101-025-00391-w. J Physiol Anthropol. 2025. PMID: 40259336 Free PMC article. Review.
References
Grants and funding
LinkOut - more resources
Full Text Sources
Miscellaneous
