. 2025 Apr 22;26(9):3926.
doi: 10.3390/ijms26093926.

Long-Term Elite Controllers of HIV-1 Infection Exhibit a Deep Perturbation of Monocyte Homeostasis

Affiliations

Long-Term Elite Controllers of HIV-1 Infection Exhibit a Deep Perturbation of Monocyte Homeostasis

José M Benito et al. Int J Mol Sci. .

Abstract

Elite controllers (ECs) represent a unique subset of people living with HIV (PLWHs), who can suppress viral replication without requiring antiretroviral therapy (ART). However, despite this viral control, ECs exhibit increased incidences of various comorbid conditions and heightened systemic inflammation, which has been linked to monocyte activation. In this study, we performed an in-depth phenotypic analysis of monocytes in a cohort of long-term ECs (LTECs) and compared them to non-controller patients with ART-mediated control of HIV replication and to non-controller patients with uncontrolled viral replication. A total of 67 participants were included: 22 LTECs, 15 non-controllers on ART (onART), 10 non-controllers without ART (offART), and 20 uninfected controls (UCs) as a reference group. Monocyte phenotypes were analyzed using spectral flow cytometry with a 13-marker panel. The data were analyzed using two approaches: (a) FCS Express software v.7 to define different subsets of monocytes and assess the levels of expression of eight different monocyte functional markers and (b) R software v.4.1.1 for unsupervised multidimensional analysis, including batch correction, dimensionality reduction, and clustering analysis. Monocyte phenotypic profiling was conducted using three different approaches: (1) assessment of monocyte subsets (classical, intermediate, and non-classical monocytes); (2) evaluation of the levels of expression of eight monocyte functional markers, and (3) characterization of monocyte clusters defined through the dimensionality reduction of flow cytometry data (56 different clusters). The monocyte phenotype of the onART group closely resembled that of the UC group. In contrast, LTECs exhibited important alterations in the monocyte phenotype compared to that of the UCs, including (a) an increased proportion of intermediate monocytes and a decreased proportion of classical monocytes (p < 0.01), (b) altered expressions of functional markers across monocyte subsets (p < 0.05), and (c) alterations in sixteen different monocyte clusters (twelve decreased and four increased, p < 0.05). Many of these alterations were also observed when comparing the LTEC and onART groups. Our findings suggest that monocyte-driven mechanisms may contribute to HIV control in LTECs; however, some of these alterations could also promote systemic inflammation and immune activation. These observations provide a compelling rationale for considering therapeutic interventions in this unique population of PLWHs.

Keywords: HIV infection; clustering analysis; elite controllers; immune phenotype; monocytes.


Conflict of interest statement

Author José M Ligos was employed by the company Cytek Biosciences. The remaining authors declare that the research was conducted in the absence of any commercial or financial relationships that could be construed as a potential conflict of interest.

Figures

Figure 1
Figure 1
Violin-plot graphs showing the levels of monocytes (left graph) and of different subsets of monocytes based on the relative expressions of CD14 and CD16 markers (right graphs) in the different study groups. The Y-axis on the graphs represents the level expressed either as the percentage of peripheral blood mononuclear cells (for the left graph showing the total monocytes) or as the percentage of the total monocytes (for the right graphs showing the different subsets of monocytes). The p-values inside the graphs are for the comparison among the four study groups (Kruskal–Wallis test); (*) p < 0.05 compared to uninfected controls (the UC group); (¶) p < 0.05 compared to the LTEC group (Mann–Whitney U test). CD14 and CD16 expressions were categorized into three levels: negative (n), dim (d), and bright (b).
Figure 2
Figure 2
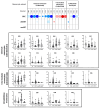
(A) Schematic representation (bubble diagram) of the profile of the alterations in single-marker expressions by different subsets of monocytes in the PLWH groups compared to the UC group as a reference. Each dot in the table represents a significant difference with respect to the UC reference group. The size of the dot indicates the degree of the difference in the fold change: <2, 2–3, and >3 from the smallest to the biggest dots. Red colors indicate increases, and blue colors indicate decreases with respect to the UC group. The level of statistical significance (corrected p-value) is indicated by the color tone: 0.05–0.01, 0.01–0.001, and <0.001 for the light, medium, and dark tones, respectively. (B) Violin plots of the expression levels of each single marker by different monocyte subsets in the LTEC study groups: (*) p < 0.05 with respect to the UC group. Only those single markers and monocyte subsets that showed a significant difference between the LTEC and UC groups are shown. (C) Violin plots of the expression levels of each single marker by different monocyte subsets in the offART study groups: (*) p < 0.05 with respect to the UC group. Only those single markers and monocyte subsets that showed a significant difference between the offART and UC groups are displayed.
Figure 3
Figure 3
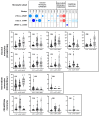
The upper part of the figure shows a schematic representation (bubble diagram) of monocyte clusters with significant differences between the PLWH groups and the UC group. Clusters are grouped according to CD14 and CD16 expressions into different monocyte subsets. Each dot in the table represents a significant difference (adjusted p < 0.05) with respect to the UC group. The size of the dot (from the smallest to the biggest size) indicates the degree of the difference in the fold change: <2, 2–3, 3–4, 4–5, and >5. Red colors indicate increases, and blue colors indicate decreases with respect to the UC group. The level of statistical significance (corrected p-value) is indicated by the color tone: 0.05–0.01, 0.01–0.001, and <0.001 for the light, medium, and dark tones, respectively. The lower parts of the figure show violin-plot graphs of the levels (expressed as percentages over the total monocytes) of each cluster in the four study groups. As in the upper part, clusters are grouped according to the subset of the monocytes: (*) adjusted p < 0.05 compared to the UC group.
Figure 4
Figure 4
The upper part of the figure shows a schematic representation (bubble diagram) of monocyte clusters with significant differences between pairs of PLWH groups. Clusters are grouped according to CD14 and CD16 expressions into different monocyte subsets. Each dot in the table represents a significant difference with respect to the reference group, as indicated in the figure. The size of the dot indicates the degree of the difference in the fold change: <2, 2–3, 3–4, 4–5, and >5 from the smallest to the biggest dot. Red colors indicate increases, and blue colors indicate decreases with respect to the reference group. The level of statistical significance (corrected p-value) is indicated by the color tone: 0.05–0.01, 0.01–0.001, and <0.001 for the light, medium, and dark tones, respectively. The lower parts of the figure show violin plots of the levels (expressed as percentages over the total monocytes) of each cluster in the three PLWH groups. As in the upper part, clusters are grouped according to the monocyte subset: (*) p < 0.05 with respect to the LTEC group; (¶) p < 0.05 with respect to the onART group.

Similar articles

References

    1. Autran B., Descours B., Avettand-Fenoel V., Rouzioux C. Elite controllers as a model of functional cure. Curr. Opin. HIV AIDS. 2011;6:181–187. doi: 10.1097/COH.0b013e328345a328. - DOI - PubMed
    1. Deeks S.G., Lewin S.R., Ross A.L., Ananworanich J., Benkirane M., Cannon P., Chomont N., Douek D., Lifson J.D., Lo Y.R., et al. International AIDS Society global scientific strategy: Towards an HIV cure 2016. Nat. Med. 2016;22:839–850. doi: 10.1038/nm.4108. - DOI - PMC - PubMed
    1. Navarrete-Muñoz M.A., Restrepo C., Benito J.M., Rallón N. Elite controllers: A heterogeneous group of HIV-infected patients. Virulence. 2020;11:889–897. doi: 10.1080/21505594.2020.1788887. - DOI - PMC - PubMed
    1. Grabar S., Selinger-Leneman H., Abgrall S., Pialoux G., Weiss L., Costagliola D. Prevalence and comparative characteristics of long-term nonprogressors and HIV controller patients in the French Hospital Database on HIV. AIDS. 2009;23:1163–1169. doi: 10.1097/QAD.0b013e32832b44c8. - DOI - PubMed
    1. Pereyra F., Lo V., Triant V.A., Wei J., Buzón M.J., Fich K.V., Hwang J., Campbell J.H., Burdo T.H., Williams K.C., et al. Increased Coronary Atherosclerosis and Immune Activation in HIV-1 Elite Controllers. AIDS. 2012;26:2409–2412. doi: 10.1097/QAD.0b013e32835a9950. - DOI - PMC - PubMed

LinkOut - more resources