. 2025 Apr 23;26(9):4000.
doi: 10.3390/ijms26094000.

Dibromo-Edaravone Induces Anti-Erythroleukemia Effects via the JAK2-STAT3 Signaling Pathway

Affiliations

Dibromo-Edaravone Induces Anti-Erythroleukemia Effects via the JAK2-STAT3 Signaling Pathway

Qiqing Chen et al. Int J Mol Sci. .

Abstract

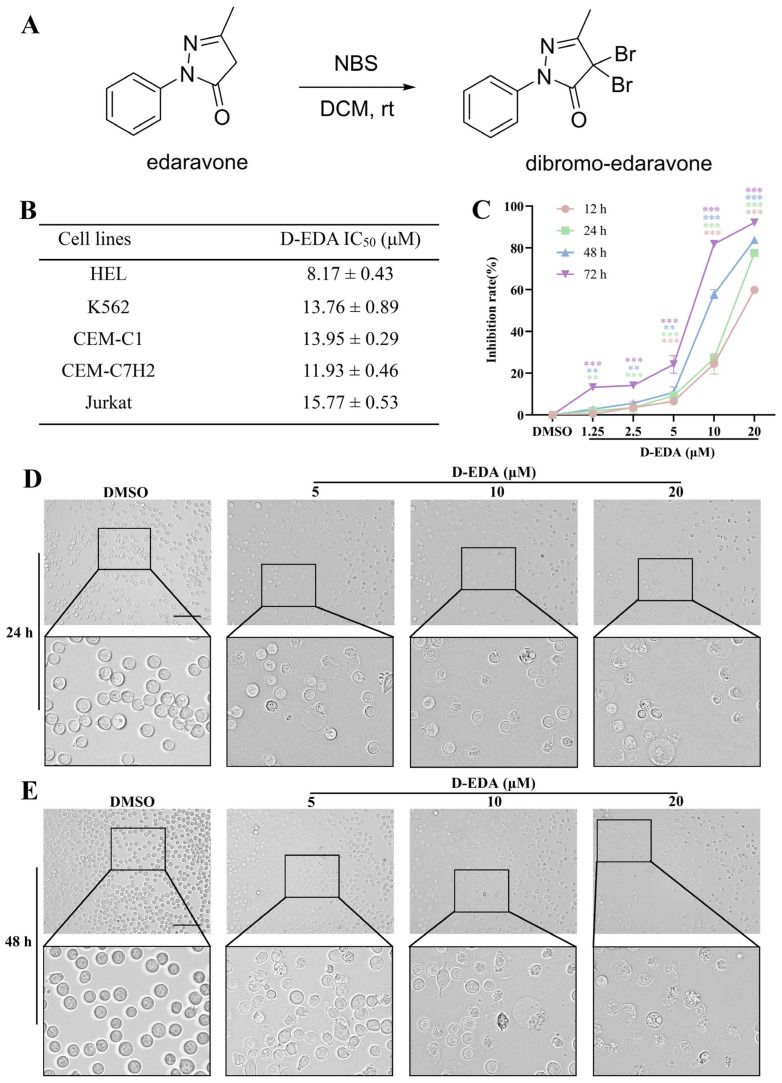
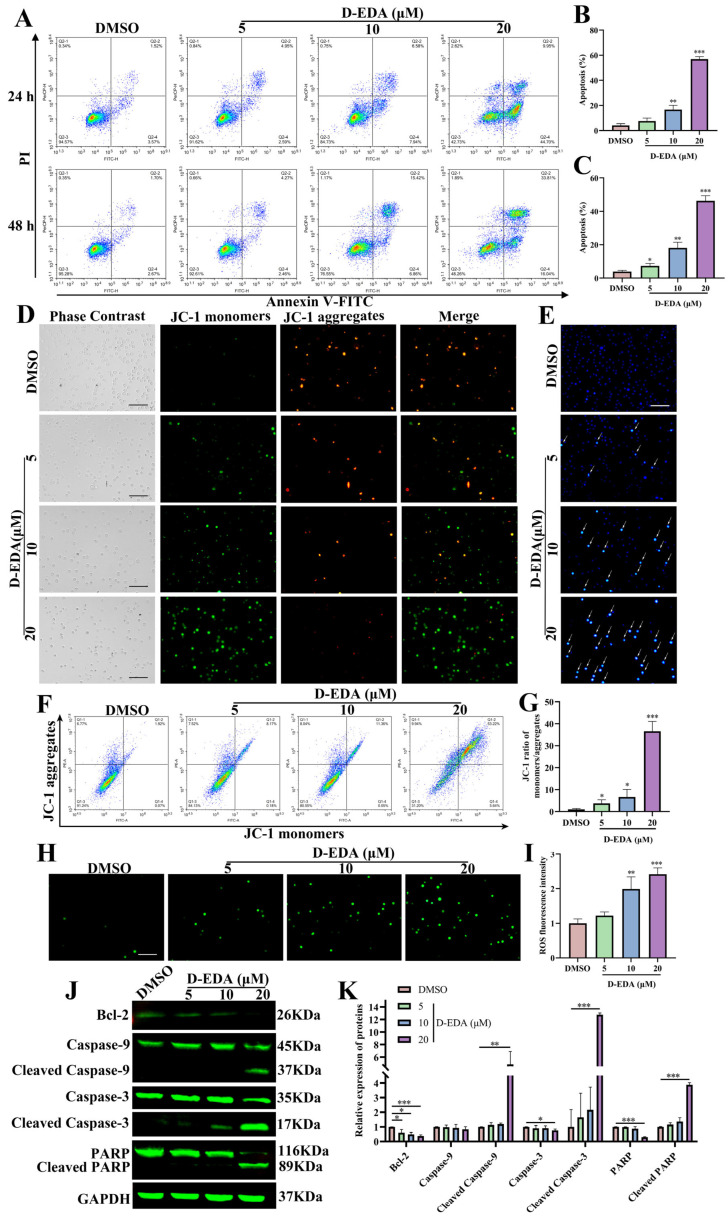
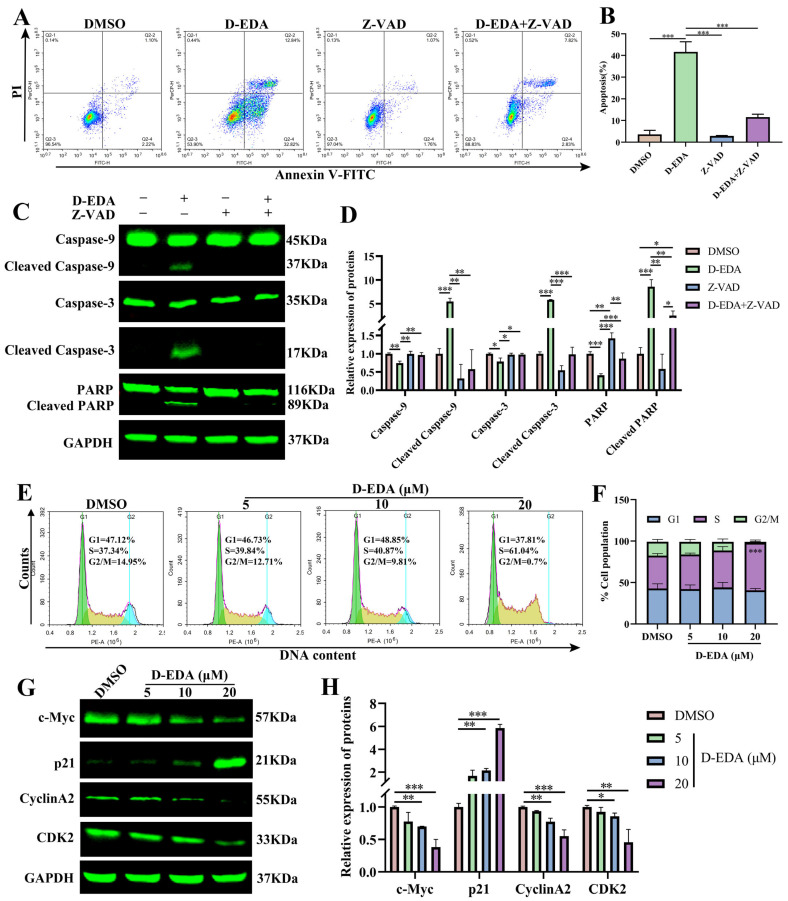
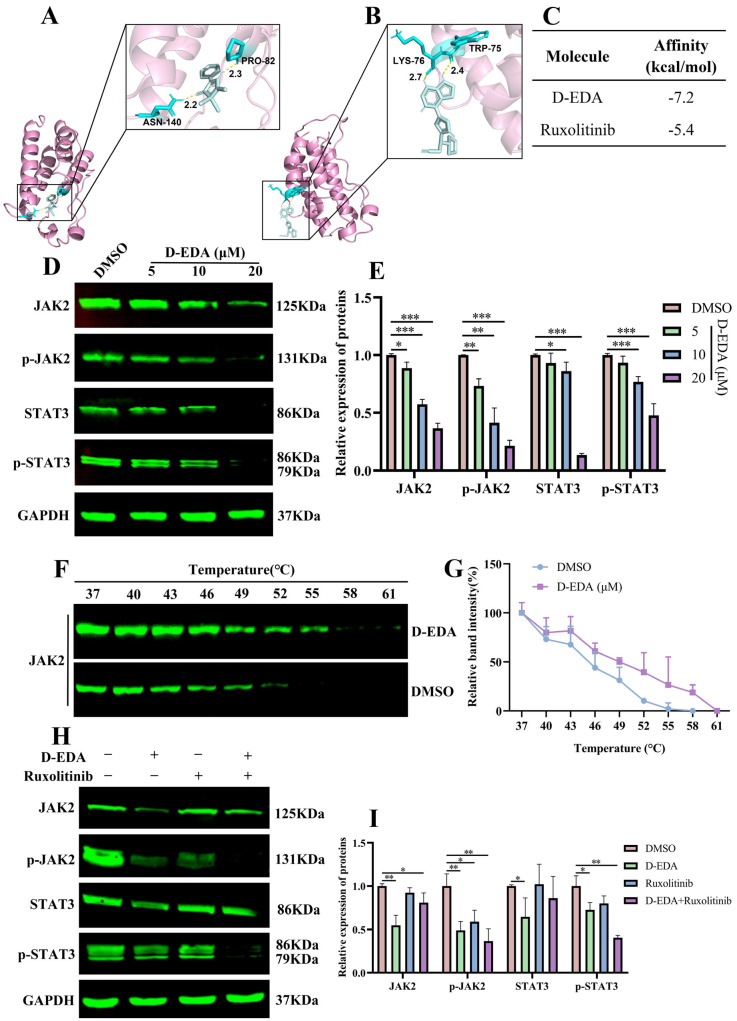
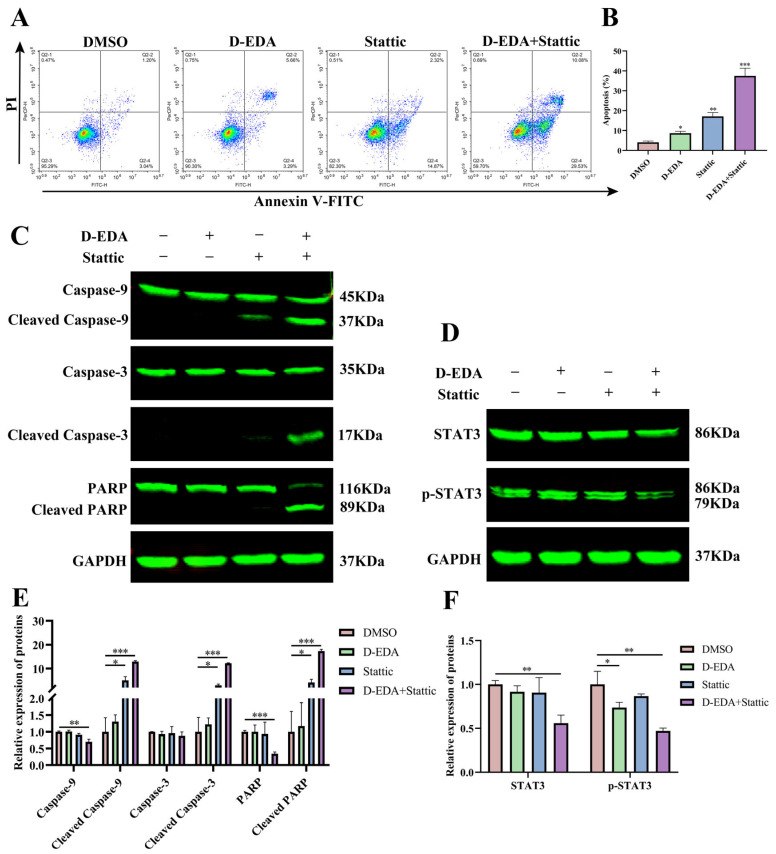
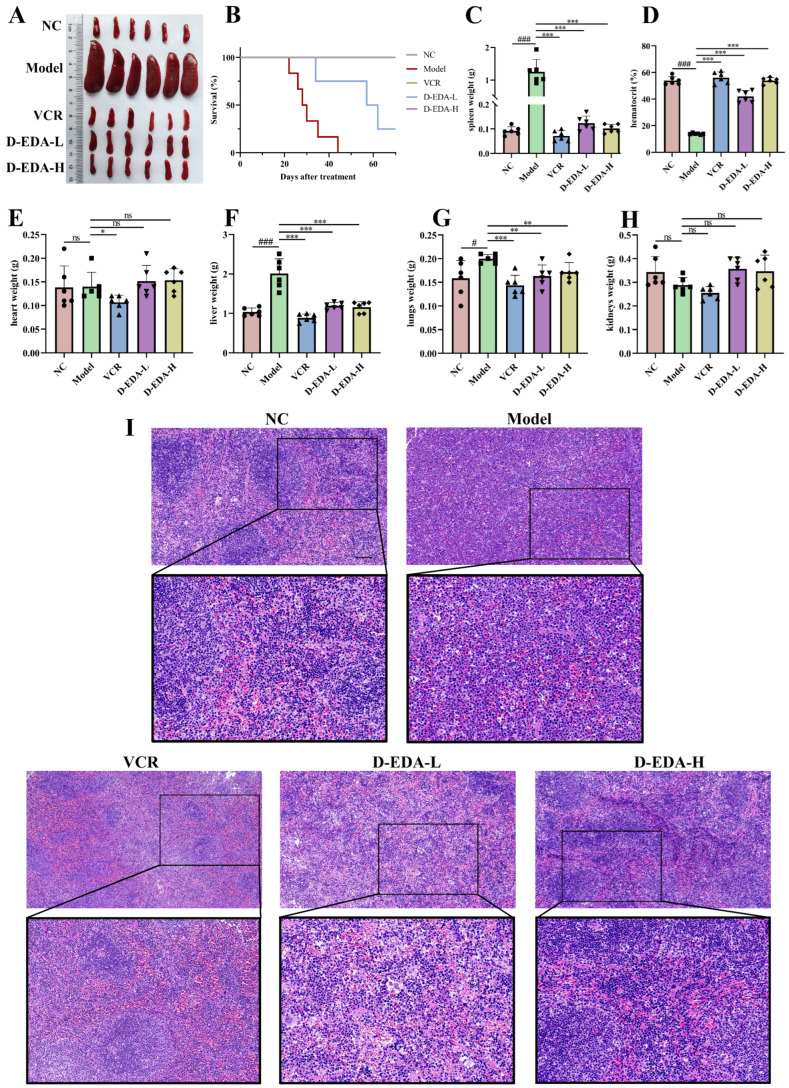
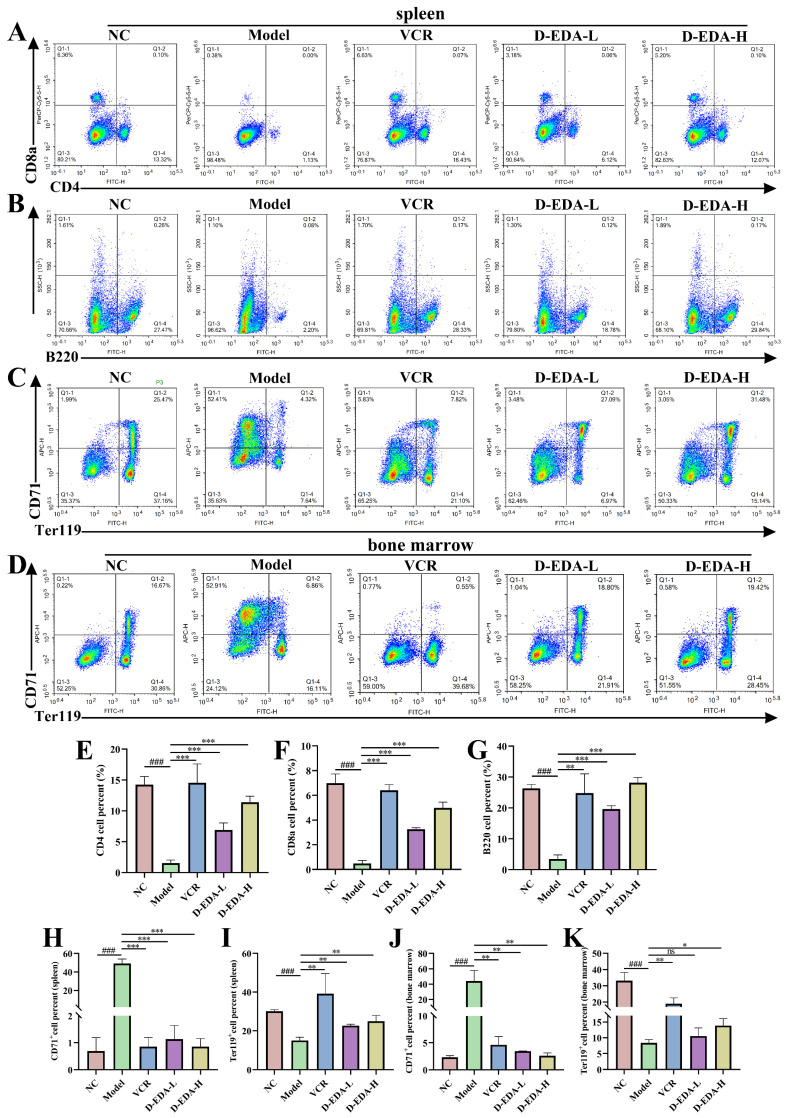
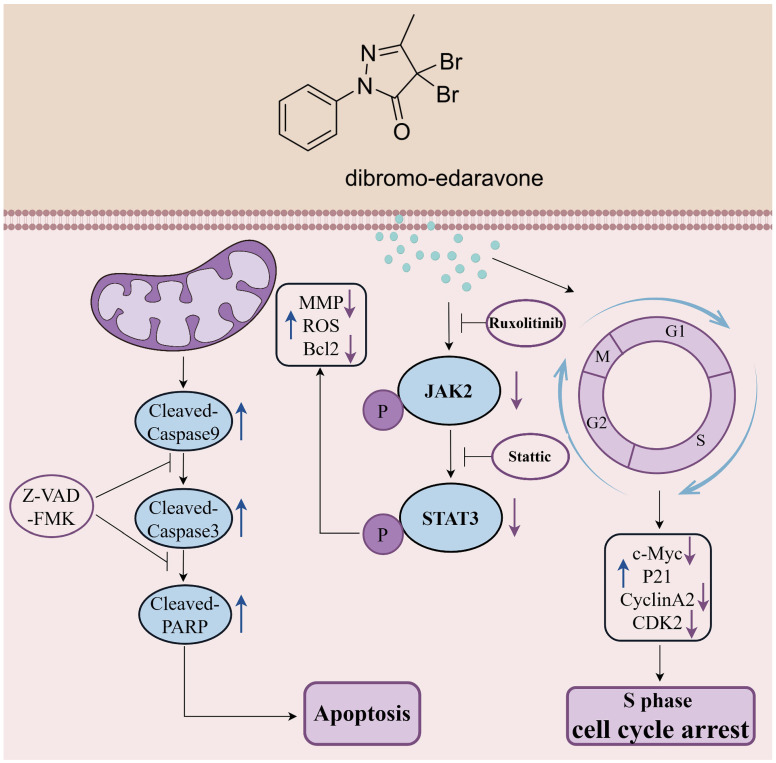
Acute erythroid leukemia (AEL) is a rare and aggressive hematological malignancy managed with chemotherapy, targeted therapies, and stem cell transplantation. However, these treatments often suffer from limitations such as refractoriness, high toxicity, recurrence, and drug resistance, underscoring the urgent need for novel therapeutic approaches. Dibromo-edaravone (D-EDA) is a synthetic derivative of edaravone (EDA) with unreported anti-leukemic properties. In this study, D-EDA demonstrated potent cytotoxicity against HEL cells with an IC50 value of 8.17 ± 0.43 μM using an MTT assay. Morphological analysis via inverted microscopy revealed reductions in cell number and signs of cellular crumpling and fragmentation. Flow cytometry analysis, Hoechst 33258 staining, Giemsa staining, a JC-1 assay, and a reactive oxygen species (ROS) assay showed that D-EDA induced apoptosis in HEL cells. Furthermore, D-EDA induced S-phase cell cycle arrest. Western blot analysis showed significant upregulation of key apoptosis-related proteins, including cleaved caspase-9, cleaved caspase-3, and cleaved poly ADP-ribose polymerase (PARP), alongside a reduction in Bcl-2 expression. Additionally, oncogenic markers such as c-Myc, CyclinA2, and CDK2 were downregulated, while the cell cycle inhibitor p21 was upregulated. Mechanistic studies involving molecular docking, a cellular thermal shift assay (CETSA), the caspase inhibitor Z-VAD-FMK, JAK2 inhibitor Ruxolitinib, and STAT3 inhibitor Stattic revealed that D-EDA activates the caspase cascade and inhibits the JAK2-STAT3 signaling pathway in HEL cells. In vivo, D-EDA improved spleen structure, increased the hemolysis ratio, and extended survival in a mouse model of acute erythroleukemia. In conclusion, D-EDA induces apoptosis via the caspase cascade and JAK2-STAT3 signaling pathway, demonstrating significant anti-leukemia effects in vitro and in vivo. Thus, D-EDA may be developed as a potential therapeutic agent for acute erythroleukemia.

Keywords: JAK2-STAT3; apoptosis; cell cycle; dibromo-edaravone; erythroleukemia.


Conflict of interest statement

All authors declare no conflicts of interest.

Figures

Figure 1
Figure 1
D-EDA inhibits HEL cell viability. (A) Chemical structure of D-EDA. (B) IC50 values of various leukemia cell lines treated with D-EDA for 48 h. (C) Growth curves of HEL cells treated with D-EDA for 12, 24, 48, and 72 h. (D,E) Morphological changes of D-EDA-interacting HEL cells at 24 h, and 48 h (Magnification: 200×, Scale bar: 100 μm). Data are denoted as mean ± SD (n = 3. ** p < 0.01, *** p < 0.001 vs. the control group).
Figure 2
Figure 2
D-EDA induces apoptosis in HEL cells. (A) The impact of D-EDA on HEL cell apoptosis was analyzed by flow cytometry after 24 h and 48 h. (B,C) Statistical graph of apoptosis. (D) The effect of D-EDA on the MMP of HEL cells at 24 h (The green fluorescence indicates JC-1 monomers, and the red fluorescence indicates JC-1 aggregates.). (E) The effect of D-EDA on Hoechst 33258 in HEL cells after 48 h of treatment. (F) Changes in MMP in HEL cells affected by D-EDA were detected by flow cytometry. (G) A statistical graph of MMP. (H) Fluorescence inversion microscopy was used to detect the effect of D-EDA on 24 h ROS in HEL cells. (I) Statistical graph of changes in ROS detected by flow cytometry. (J) The impact of D-EDA on the expression of apoptotic proteins Bcl-2, Caspase-9, Caspase-3, PARP, Cleaved Caspase-9, Cleaved Caspase-3, and Cleaved PARP in HEL cells was detected by Western blot. (K) Statistical graph of apoptotic proteins expression (Magnification: 200×, Scale bar: 100 μm). Data are denoted as mean ± SD (n = 3. * p < 0.05, ** p < 0.01, *** p < 0.001 vs. the control group).
Figure 3
Figure 3
D-EDA activated the caspase cascade reaction and blocked the S phase in HEL cells. (A) The effect of Z-VAD on apoptosis of HEL cells at 24 h was detected by flow cytometry. (B) Apoptosis statistics graph. (C) Protein expression changes of Caspase-9, Caspase-3, PARP, Cleaved Caspase-9, Cleaved Caspase-3 and Cleaved PARP. (D) Statistical graph of expression of apoptotic proteins. (E) The impact of D-EDA on the cell cycle of HEL cells was analyzed after 24 h using flow cytometry (G1 phase: green; S phase: yellow; G2/M phase: blue). (F) Cell cycle statistics. (G) Effects of D-EDA on HEL cells for 24 h on cycle proteins: c-Myc, p21, CyclinA2 and CDK2. (H) Statistical chart of cell cycle proteins. Data are denoted as mean ± SD (n = 3. * p < 0.05, ** p < 0.01, *** p < 0.001).
Figure 4
Figure 4
D-EDA inhibits the JAK2-STAT3 signaling pathway in HEL cells. (AC) To predict the binding ability of JAK2 to D-EDA and Ruxolitinib by molecular docking assay. (D,E) Protein expression changes and statistical plots of JAK2, STAT3, p-JAK2, and p-STAT3. (F) Cellular thermal shift assay to detect the binding stability of D-EDA to JAK2. (G) Graph of thermal fusion curves of JAK2. (H,I) The impact of Ruxolitinib combined with D-EDA on JAK2, p-JAK2, STAT3, and p-STAT3 protein expression, along with statistical plots. Data are denoted as mean ± SD (n = 3. * p < 0.05, ** p < 0.01, *** p < 0.001 vs. the control group).
Figure 5
Figure 5
The combination of Stattic and D-EDA exhibits an anti-erythroleukemia effect by activating the caspase cascade reaction. (A) The effect of Stattic in combination with D-EDA on HEL cell apoptosis at 24 h was examined by flow cytometry. (B) Graph of apoptosis statistics. (C,E) Effect of Stattic with D-EDA on the expression of Caspase-9, Caspase-3, PARP, Cleaved Caspase-9, Cleaved Caspase-3, and Cleaved PARP proteins and statistical analyses. (D,F) The impact of Stattic combined with D-EDA on STAT3 and p-STAT3 protein expression, along with statistical plots. Data are denoted as mean ± SD (n = 3. * p < 0.05, ** p < 0.01, *** p < 0.001 vs. the control group).
Figure 6
Figure 6
D-EDA blocks the progress of F-MuLV-induced erythroleukemia in mice. (A) Photographs of the spleens of mice in each group (n = 6). (B) Spleen weight statistics of mice. (C) Hematocrit statistics of mice. (D) Heart weight statistics of mice. (E) Liver weight statistics of mice. (F) Weight statistics of mice lungs. (G) Weight statistics of mice kidneys. (H) Growth curves after D-EDA treatment in mice (n = 6). (I) H&E staining of the spleen (Magnification: 200×, Scale bar: 100 μm). Data are denoted as mean ± SD (Model vs. NC, # p < 0.05, ### p < 0.001; other groups vs. Model, * p < 0.05, ** p < 0.01, *** p < 0.001; ns indicates statistically non-significant difference).
Figure 7
Figure 7
D-EDA reduced the expression of the CD71+ cell population, promoted the expression of the Ter119+ cell population, and activated immune cells in erythroleukemia mice. (A,B) Changes in CD4, CD8a, and B220 cell populations in mouse spleen. (C,D) Changes in CD71+ and Ter119+ cell populations in the spleen and bone marrow of mice. (EG) Statistical graph of CD4, CD8a, and B220 in mice spleen. (H,I) Statistical graph of CD71+ and Ter119+ in mice spleen. (J,K) Statistical graph of CD71+ and Ter119+ in mouse bone marrow. Data are denoted as mean ± SD (n = 3. Model vs. NC, ### p < 0.001; other groups vs. Model, * p < 0.05, ** p < 0.01, *** p < 0.001; ns indicates statistically non-significant difference).
Figure 8
Figure 8
Molecular mechanism of D-EDA on anti-erythroleukemia (The red arrows represent down-regulation, and the blue arrows represent up-regulation).

Similar articles

References

    1. Zhang N., Wu J., Wang Q., Liang Y., Li X., Chen G., Ma L., Liu X., Zhou F. Global burden of hematologic malignancies and evolution patterns over the past 30 years. Blood Cancer J. 2023;13:82. doi: 10.1038/s41408-023-00853-3. - DOI - PMC - PubMed
    1. Fernandes P., Waldron N., Chatzilygeroudi T., Naji N.S., Karantanos T. Acute Erythroid Leukemia: From Molecular Biology to Clinical Outcomes. Int. J. Mol. Sci. 2024;25:6256. doi: 10.3390/ijms25116256. - DOI - PMC - PubMed
    1. Weinberg O.K., Arber D.A. Erythroleukemia: An Update. Curr. Oncol. Rep. 2021;23:69. doi: 10.1007/s11912-021-01060-8. - DOI - PubMed
    1. Alexander C. A History and Current Understanding of Acute Erythroid Leukemia. Clin. Lymphoma Myeloma Leuk. 2023;23:583–588. doi: 10.1016/j.clml.2023.04.011. - DOI - PubMed
    1. Whiteley A.E., Price T.T., Cantelli G., Sipkins D.A. Leukaemia: A model metastatic disease. Nat. Rev. Cancer. 2021;21:461–475. doi: 10.1038/s41568-021-00355-z. - DOI - PMC - PubMed

MeSH terms

LinkOut - more resources